UK Fisheries White Paper, July 2018
Understanding the pattern of UK trade in fish
The overall economic importance of fishing and fisheries to the UK economy is small. The share of fishing and fish processing in UK gross value added (GVA) in 2016 was 0.12%, and total employment was 24,000 people. Fishing and aquaculture accounted for 55% of the GVA, and 33% of the total employment, while fish processing correspondingly accounted for 45% and 66%.[1]
Similarly, the sector accounts for a very small share of the UK’s trade. For the UK as a whole the share of Standard International Trade Classification (SITC) section 03 which is classified as “fish (not marine mammals)” in the exports and imports of all UK goods with the world in 2015 was 0.6% and 0.4% respectively, and the share of the UK’s trade with the EU was 0.7% and 0.4%.[2]
This does mask some regional variations. In particular, the sector is more important in Scotland where, in 2015, it accounted for 3.6% of all Scottish exports to the EU, and 1.4% of all imports and the sector can provide an important contribution to employment and economies in some coastal, island and rural areas.
Nevertheless, from a political economy perspective, the sector is considered ‘sensitive’, and there have been several pronouncements by leading politicians including from Michael Gove, the Secretary of State for Environment, Food and Rural Affairs, announcing that the UK will ‘take back control over its fishing waters’. There are probably several reasons for this. First, this sensitivity is no doubt driven in part by the UK’s maritime history, the close association with coastal communities and hence the cultural significance of the sector for the UK. Second, fishing and fisheries is highly sensitive not just in the UK but in many EU and EU Free Trade Agreement (FTA) partner countries, and the issue of fishing rights has historically been a source of some friction both with and between the EU and other countries, such as the Icelandic Cod Wars in the 1970s. Third, due to the UK joining the European Economic Community at the same time as countries were establishing their Exclusive Economic Zones under the United Nations Convention of the Law of the Sea (UNCLOS), UK fishermen felt that the UK’s fisheries’ resources were given away under the Common Fisheries Policy’s principle of equal access to waters. As a result of all this, the fishing lobby is reasonably strong, particularly around the Brexit negotiations. The Fishing for Leave campaign staged a flotilla of fishing boats up the River Thames to Westminster during the referendum campaign and again in March 2018. The industry is pushing hard for a more assertive UK stance managing its waters, with the Scottish Fishermen’s Federation referring to the potential of Brexit as a ‘sea of opportunity’.
Fisheries are complex. They are a classic example of a common property resource, which if not managed correctly leads to declining fish stocks or worse. It is, therefore, a resource which has to be managed ‘in common’ otherwise each country/fishing vessel has a strong incentive to overfish. Because of overcapacity, leading in part to a long-run decline in fishing with consequent impacts on fishing communities, the sector is one which has long been a recipient of aid, most recently through the European Maritime and Fisheries Fund [3] and has been subject to a series of decommissioning schemes to reduce fleet capacity. Finally, there is a level of foreign investment, in the catching, processing and aquaculture sectors, from both EU and EEA countries, and a degree of dependency on EU labour, particularly in processing.
The aim of this Briefing Paper is twofold. First, to detail the policy environment, and the policy considerations facing the UK government in the Brexit negotiations. Secondly, to provide an empirical assessment of what the impact of leaving the EU might be on the seafood industry. As the nature of the UK’s future trade relations with the EU are still uncertain, in this paper we explore several simulations which, broadly speaking, aim to capture the key variants of Brexit that appear to be under discussion. Leaving the EU will involve some possible combination of changes in tariffs, non-tariff measures, and also the amount of fish quotas that can be caught by the UK and the EU.
The scenarios modelled, therefore, make different assumptions with regard to each of these key policy areas. As opposed to modelling seafood as a single industry we explicitly examine 10 key fish and shellfish species which are caught, produced and traded by the UK (cod, crab, haddock, hake, herring, mackerel, Norwegian lobster (‘Nephrops’), saithe, salmon (produced through aquaculture) and scallops). Conversely, we do not explicitly address the fish processing industry, although the processing of fish and shellfish is incorporated into the model through the trade of the more processed forms of these species. The ten species modelled account for 60% of the value of UK trade (imports plus exports) in the HS 03 category and 13% of UK trade in the 1604 and 1605 categories. Together, they account for 67% of the value of UK landings and 94% of the value of UK aquaculture production. In presenting the results we report on the impact on both the UK and the EU.
Under current policy arrangements with the EU, there are no tariffs on intra-EU trade in fish or fish products, and the level of non-tariff measures is very low. Fish caught by a UK vessel may well be landed in another country e.g. France (and other EU vessels may land directly in UK ports). Hence, part of the UK’s exports are landed directly from fishing vessels into foreign ports, principally to Norway (mackerel and herring) and the Netherlands (demersal fish such as plaice and sole). The reasons for this are market (price) and company structure (vertical integration/linkages between vessels and processing facilities). Where this occurs then these are usually treated as UK exports. Approximately 20% of fish caught by the UK fleet is landed elsewhere in the EU.[4] While the European Economic Area (EEA) countries do not levy tariffs on EU imports, the EU still retains some tariffs on imports from EEA countries, though these are lower than the EU’s MFN tariffs.
A key aspect of the EU’s Common Fisheries Policy (CFP) is the principle of ‘equal access’ for EU fishing vessels to EU waters beyond 12 nautical miles, which means EU fishing vessels may legally fish throughout EU waters subject to their quota allocation. Access between 6nm and 12nm also exists for vessels with historical rights.[5] In the North East Atlantic, most commercially exploited fish stocks are managed through Total Allowable Catches (TACs) that determine the amount that can be sustainably caught each year. For EU stocks, the TAC is set annually in December in Brussels and is then divided up between Member States as quotas according to the ‘Relative Stability’ principle. Relative Stability aims to provide a stable share of fishing opportunities for Member States, in relation to a species in a fishing area, based on historic reported landings over a five-year reference period (1973–1978).
For stocks that are shared with non-EU countries, such as Norway, the TACs are agreed jointly with them, and quotas shared between the parties, and there are mechanisms in place for allowing access to the Norwegian Exclusive Economic Zone (EEZ) by the EU and vice versa. Under the agreement between the EU and Norway, the share of the TAC that each party receives is based on ‘zonal attachment’ rather than historical landings. The zonal attachment is based on the spatial distribution of a stock over time and over its various life history stages which is particularly important for migratory species.[6]
The issue of ‘relative stability’ v ‘zonal attachment’ is highly sensitive in the UK fishing industry. There is a long-standing concern that the current system of allocation based on relative stability has been strongly disadvantageous to the UK. Many industry lobby groups have been arguing hard that the UK government should adopt the principle of zonal attachment in its negotiations with the EU over future fishing rights. For many fish stocks, switching to a system based on zonal attachment would result in a substantial increase in the UK’s quota allocation – and conversely a decrease in the EU’s.
When the UK leaves the EU, it will become an independent coastal state under United Nations Convention on the Law of the Sea (UNCLOS) with rights and responsibilities to manage and exploit sustainably the resources in its EEZ. It must make any surplus fish stocks that it cannot catch available to other states, and must cooperate in the management of shared stocks. The UK will need to cooperate with the EU and other countries such as Norway, the Faroe Islands and Iceland, to manage shared fish stocks, including agreeing on overall catch limits and their allocation. The EU fishing industry is keen to maintain the existing distribution of quota[7] whereas the UK is looking to renegotiate a fairer share of quotas.[8]
The Government published its White Paper on ‘Sustainable fisheries for future generations’, setting out its vision for the UK to become an independent coastal state with the right to control and manage access to fish in UK waters out to the 200nm limit or the median line. When the UK leaves the EU, access to UK waters will be ‘on our terms, under our control and for the benefit of UK fishermen’.
The document sets out the intention to move away from Relative Stability quota shares towards ‘a fairer and more scientific method for future TAC shares as a condition of future access’. This implies shares that better reflect the resources in UK waters, and a series of maps and analyses are presented in the White Paper that set out the UK’s current quota share for various stocks, and the shares based on three different ‘zonal attachment’-type criteria.
The White Paper separates the issue of trade from fisheries, setting out the intention for access to markets to be agreed as part of the future economic partnership with the EU, although the EU has signalled its intention to link fisheries access to market access more broadly. The White Paper highlights the ambition for a ‘deep and special partnership’ with the EU, the intention for continuity in existing trade relationships (e.g. the EU’s existing Free Trade Agreements) and preferential arrangements (such as countries covered by the Generalised System of Preferences, and Cotonou Agreement), as well as the objective of developing new global markets for the UK.
The White Paper is broad in its scope, covering international relations, sustainability principles, establishing powers to set fishing opportunities, the allocation of additional fishing opportunities, integration of recreational angling in the fisheries management framework, a common UK framework for fisheries and devolution aspects, the need for scientific evidence, monitoring and enforcement, and rapid and responsive regulation, and the potential use of economic incentives and cost recovery.
In 2016, the UK fishing fleet landed 701,000 tonnes of fish and shellfish into the UK and abroad, worth £936 million.[9] The Scottish fleet contributed 65% of these landings (by weight), with pelagic fish such as mackerel being particularly important. The majority of catches are from the North Sea, West of Scotland, English Channel and Irish Sea, with approximately 80% of catches being taken in UK waters, although UK vessels also fish further afield, outside of UK waters[10], off the Norwegian coast, West of Ireland, Faroese waters and the Bay of Biscay. The fish processing industry is also important in certain regions of the UK, particularly in the Humberside region in England, and in the Grampian region in Scotland, with a total turnover of £4,395 million and £776 million GVA in 2014 (Seafish, 2016).[11] The processing industry relies on both local landings as well as imported products (which may be fresh, frozen or part processed, for example into fillets or fillet blocks), and provides output both for UK consumption as well as for export.
The UK’s waters encompass productive fishing grounds and are important for other EU Member States’ fishing fleets. Other EU Member States landed an estimated 749,000 tonnes of fish and shellfish worth £575 million from the UK EEZ (annual average, 2013-2015). In contrast, the UK fleet landed only 79,000 tonnes worth £96 million from other EU Member States’ waters, and a further 45,000 tonnes worth £54 million from neighbouring third countries.[12]
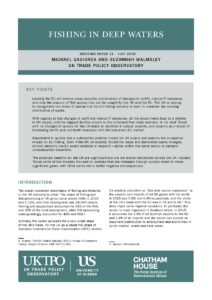
Trade in fish and fishery products is important for the UK, with much of the fleet’s landings being exported, and a large amount of what is consumed is imported. Imports of fish and fish preparations were 730,000 tonnes in 2016, with 441,000 tonnes exported. Imports were mainly tuna, cod, salmon, shrimps and prawns, reflecting consumer tastes; while exports were mainly salmon (produced by aquaculture), mackerel and herring. The main countries for imports are Iceland, China (which is an important processor of fish) and other EU Member States such as Germany and Denmark; whereas other EU Member States (France, Spain, Netherlands) and the USA are the most important export markets.
Graphs 1 and 2 give the total value of UK exports and imports for the trade codes of the ten species that we model, as well as the share of the EU in the UK’s trade of these species. Several features emerge clearly from these charts. Salmon is by far the single most exported and imported species. On the export side, this is followed by Nephrops, mackerel and scallops. On the import side, the most significant species other than salmon are cod and haddock. From the second graph, we can see that a very high proportion of UK exports is destined for the EU; more than 80% of UK exports of cod, crab, hake, Nephrops, saithe and scallops go to the EU. With regard to imports, the picture is a bit more mixed, with more than 80% of UK imports of herring and mackerel coming from the EU, and around 20% of cod, haddock, hake and saithe coming from the EU.
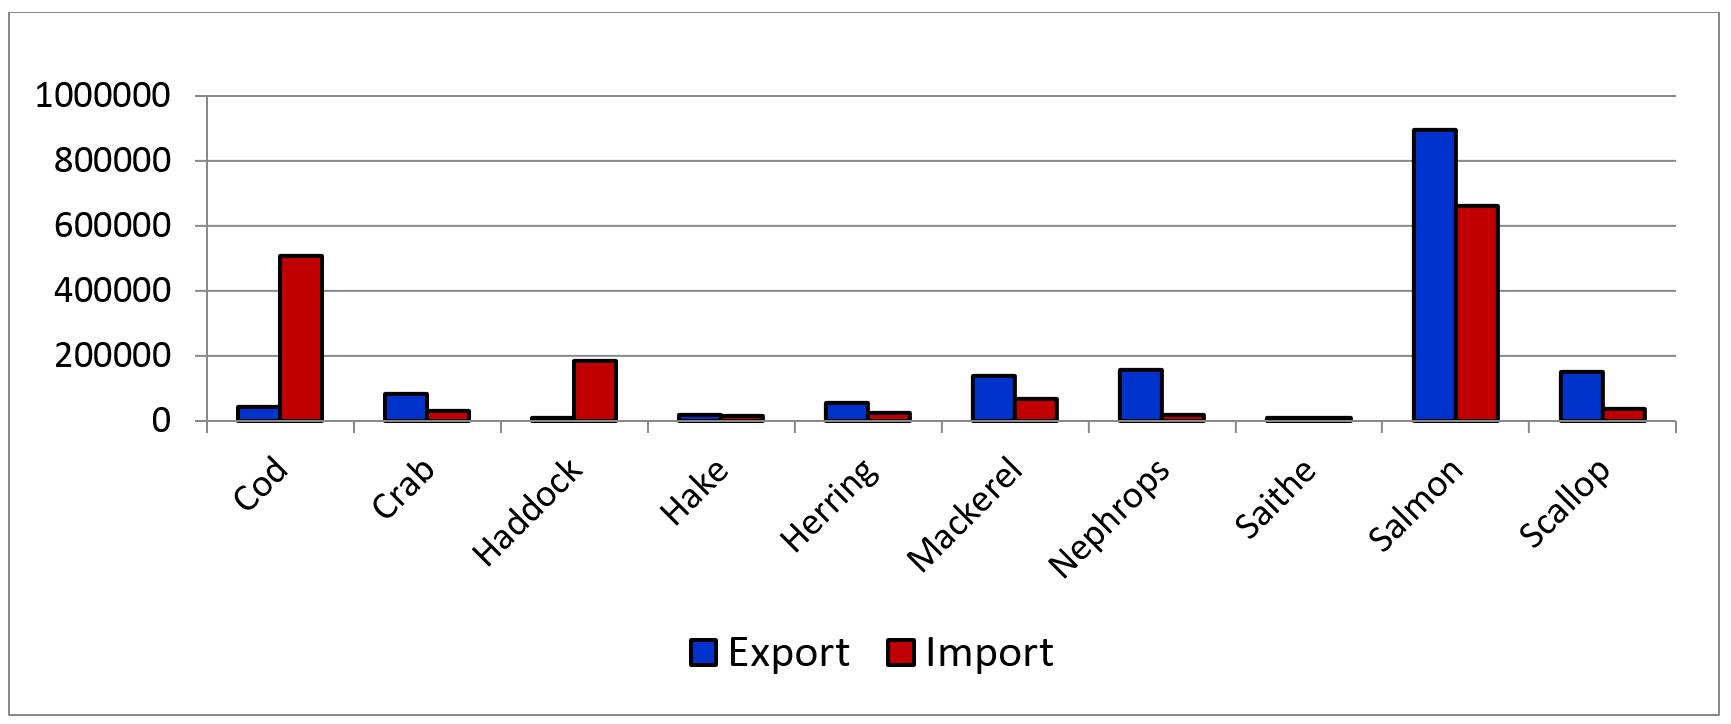
Source: UN Comtrade, data provided in $000.
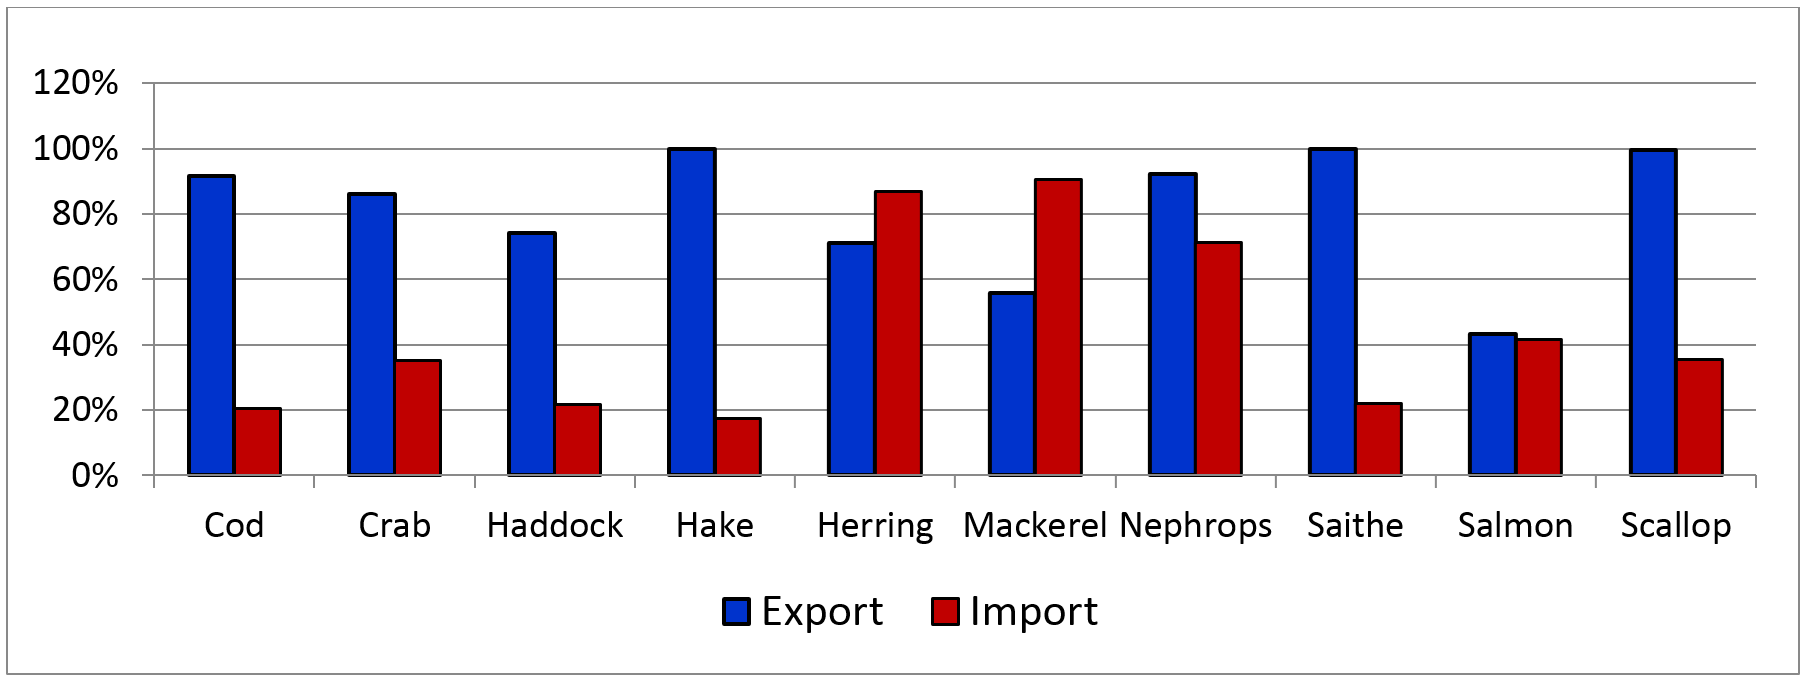
Finally, graph 3 gives the value and share of each of the UK home nations in UK landings of each of the species, excluding salmon.[13] Once again several interesting features emerge. The two most significant species are mackerel and Nephrops, and for both of these the majority of the landings are from Scottish vessels. The most important fish landings for English vessels are cod and crab, for Northern Ireland Nephrops and mackerel, and for Wales scallops and crab.
In this section, we report on the results of several different possible Brexit scenarios. Leaving the EU gives the UK the possibility of greater autonomy with regard to tariffs, non-tariff measures and quotas. Hence the experiments that we consider make different assumptions with regard to each of these elements.
Before we detail the experiments, it is important to be clear about the data that we are using and the level of disaggregation we are working with. As opposed to modelling the fishing industry as a single entity we explicitly examine 10 key fish and shellfish species which are caught and then traded by the UK. In order to do this, we need information on the amount of trade in each species, the value and quantity of landings, and also on how much of the fish which is caught by the UK fishing fleet is consumed in the UK as opposed to traded. We similarly need the same information with regard to the UK’s key trading partners.
With regard to the key trading partners it is important to note that these may differ substantially according to the species traded; both in terms of key export destinations, and principal import suppliers. Hence, we work with a different set of country configurations for each of the species. In each case, we have the UK and the EU-27 as countries in the model, and then we include individually all the countries which are either a key supplier to the UK or a key destination for UK exports.[14] The remaining countries are grouped in a ‘Rest of World’ (RoW) category. This also means that the number of partner countries in the model varies across the species considered. The data used derive from several sources which include the UN Comtrade database (for exports and imports), the TRAINS database (for tariffs), and the United Nations Food and Agriculture Organization (FAO) for information on landings and processing. Reconciling the trade data with the landings and processing data, and even reconciling different sources of information on the landings data is far from straightforward. The process of reconciliation inevitably involves making some assumptions and some adjustments to the data, but these have been kept to a minimum.[15]
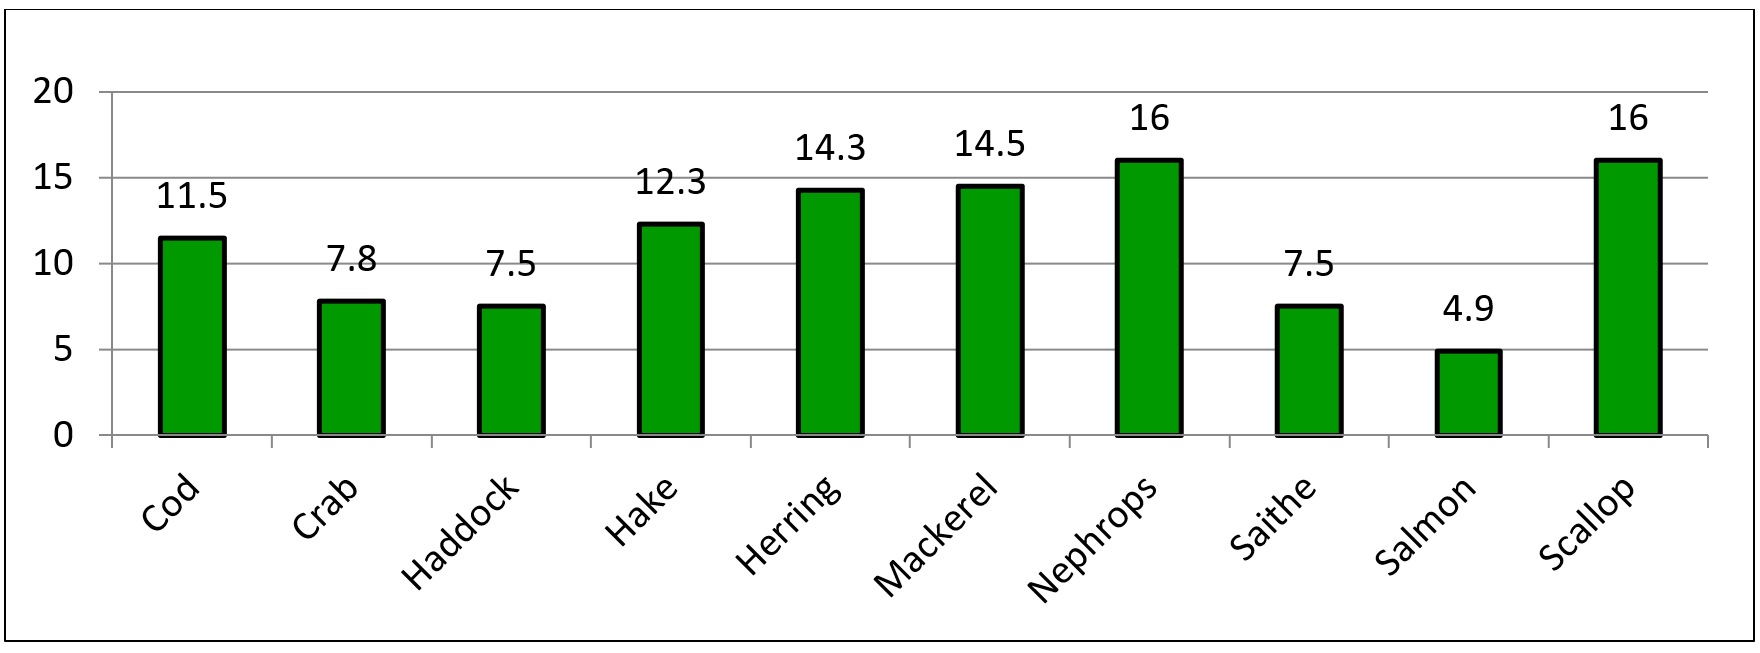
The information on tariffs comes from the TRAINS database at the HS 6-digit level and then is aggregated to correspond to each of our fish species. The EU’s Most Favoured Nation (MFN) tariffs, which would apply between the UK and the EU are given in the chart below. From this we see that tariffs are quite high (above 10%) for six of the species, and below 5% only for Salmon. The introduction of tariffs between the UK and the EU is likely therefore to have non-negligible effects.
Definitive information on ad valorem equivalents of non-tariff measures (or barriers) for the fishing industry do not exist. Non-tariff measures which could raise the costs of trade in fish include rules of origin, Sanitary and Phytosanitary certification and checks, technical import requirements (size, presentation, catch method, labelling requirements), and catch certificates. The key studies typically used and cited with estimates of such ad valorem equivalents (Dean, 2009; Berden & Francois, 2015; Fontagne et.al., 2013; Fugazza, 2013; Egger et.al. 2015; Cadot & Gourdon, 2015, Ghodsi et.al., 2016) do not provide separate estimates for the fishing industry. At best there are estimates for ‘agriculture forestry and fishing. However, it is worth noting the conclusions from an UNCTAD study which states:
“First, products of the fish sector are relatively more affected by NTMs and more intensively than products belonging to non-fish sectors. Second, products of the fish sector are mostly affected by technical regulations and in particular SPS measures. Third, almost all countries impose SPS measures on all imports of products of the fish sector. Fourth, similar types of SPS measures and TBTs affect both fish and non-fish products. However, their incidence is much larger in fish products.”
In the absence of reliable estimates, we have assumed that the ad valorem equivalent could take one of the levels: 5% (low); 10% (medium) or 15% (high). In the base, we assume that even within the EU there exist Non Tariff Measures (NTMs) on trade but that these are low. We assume the same low level for trade between the UK/EU and the EEA countries. Conversely, NTM are high on trade between the UK, EU or EEA countries and the rest of the world.
Finally, we also need information on the changes in quotas that could arise from the shift from a system based on relative stability to one based on zonal allocation. We sourced this primarily from a study which derived zonal attachment percentage shares based on survey data,[16] and applied this to the overall Total Allowable Catches. The percentage changes in quotas arising from a switch to zonal attachment for the species modelled are given in the graph 5.
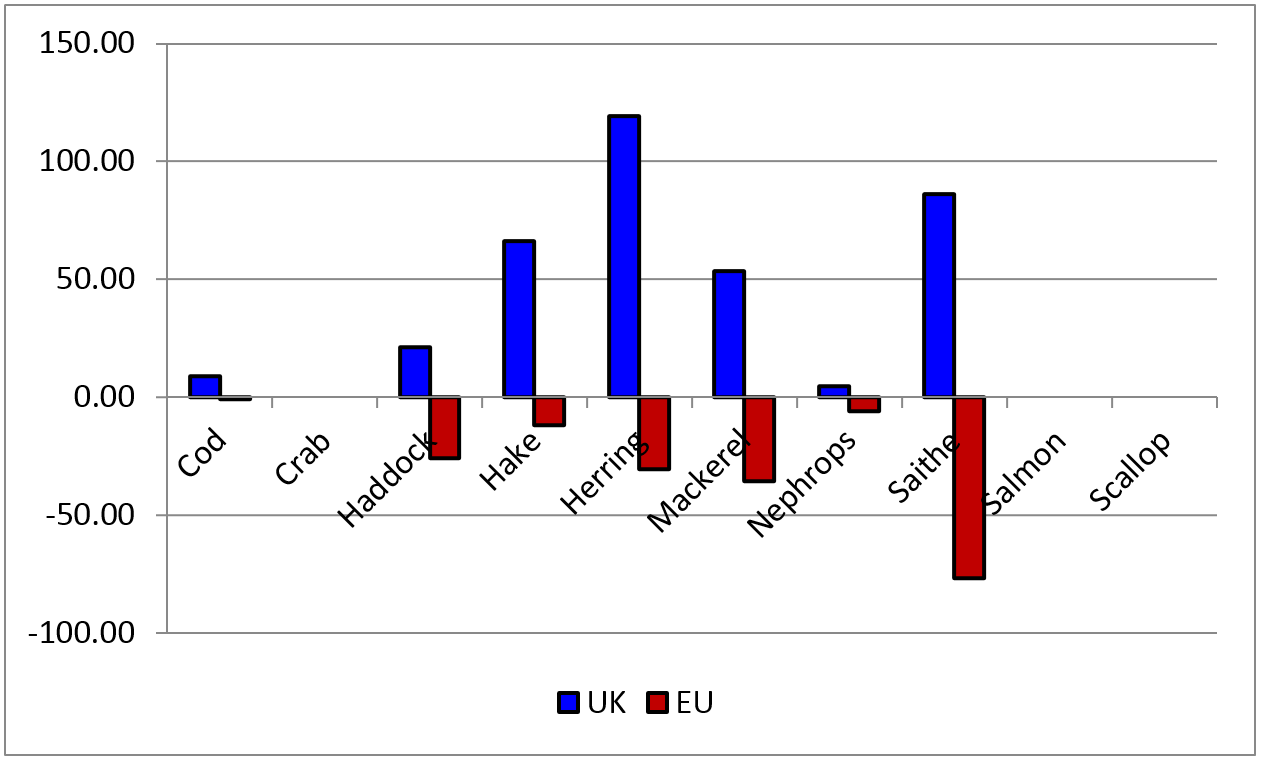
As can be seen for some species there may be no change in the quota (for those not managed by quotas – crab, salmon and scallop), whereas for others the changes are very substantial indeed. Moving to zonal attachment could result in the UK quota increasing by 119% for herring and for saithe by 86%. It is important to note that there are correspondingly large declines in EU quotas for these species.
Given the preceding, the five scenarios that we consider are:
Scenario 1 (EEA): In this scenario, we assume that the UK leaves the EU Customs Union and signs a Free Trade Agreement (FTA) with the EU which, with regard to tariffs, is similar to the current EEA arrangements. What this means is the introduction of some tariffs between EU and UK; and also between the UK and the EEA countries.[17] These are based on the existing EU-Norway agreement. We also assume that the UK will also be leaving the Single Market which results in an increase in the non-tariff costs of trading with the EU (such as rules of origin, and with regard to conformity assessment on standards). The non-tariff measures are increased from ‘low’ to the ‘medium’ level. This also applies to trade between the UK and the EEA countries. There is no change to the quota distribution. This is a ‘soft’ Brexit scenario.
Scenario 2 (No deal with EU or ROW): In this scenario, we assume that, at least with regard to fishing, that there is no agreement with the EU, and no new free trade agreements with third countries. This experiment, therefore, involves the introduction of tariffs between the UK and the EU as well as the EEA countries; and an increase in non-tariff measures to ‘high’. There is no change to the quota distribution. This is a ‘hard’ Brexit scenario.
Scenario 3 (No deal with EU, FTAs with ROW): A stated objective of the UK government is to have an independent trade policy so that trade agreements can be signed with non-EU countries. So in this experiment, we once again assume that there is no deal with the EU, but at the same time, the UK manages to sign free trade agreements with non-EU countries. We have modelled this in a maximal way by assuming that the UK manages to sign FTAs with all the non-EU and non-EEA countries. While this is clearly extremely unrealistic it gives an outer bound as to the extent to which such agreements might offset the increases in trade costs with the EU arising from no deal. So, while tariffs and non-tariff measures with the EU and the EEA countries go up, this is offset by tariffs and NTMs declining with all third countries. There is no change to quota distribution.
Scenario 4 (No deal with EU, zonal attachment quota allocation): With regard to tariffs and NTMs this scenario replicates the no deal Scenario 2, but we also allow for a change in the UK and EU quotas on the assumption that the principle of zonal attachment is applied for the distribution of quotas, rather than relative stability. We run two variants of this experiment: (4a) allows for the full application of the zonal attachment based quota changes; (4b) assumes that quotas change by 50% of the zonal attachment calculations.
Scenario 5 (No deal with EU, Unilateral Free Trade): It has also been suggested by some, such as the Economists for Free Trade, that in leaving the EU the UK could gain by pursuing a unilateral policy of trade liberalisation. In order to explore this, we assume, as before, that the UK leaves the EU with no deal, but then chooses to fully liberalise its tariffs with all countries in the world. There is no change to quota distribution.
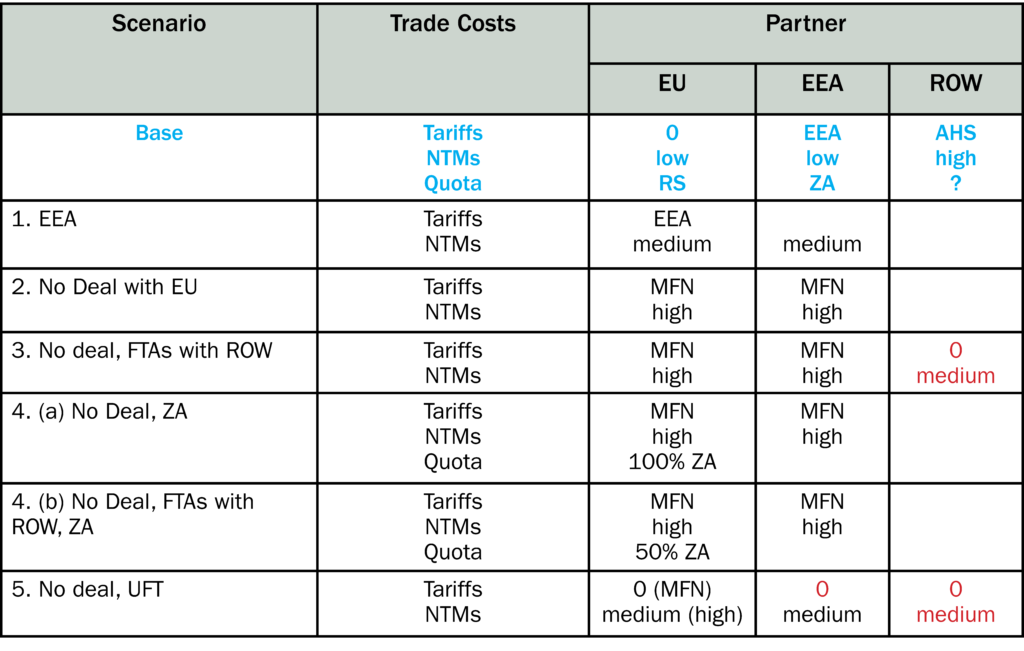
The assumptions made in the each of the scenarios are given in table 1. The way to read this table is the following. The top panel in bold and blue gives the situation in the base (i.e. before any simulation is run). Each of the subsequent panels only has an entry if there is any change from the base. So if you take the EEA panel we have a change in tariffs with the EU and a change in the level of NTMs with the EU and EEA, but no change in tariffs or NTMs with the rest of the world. Where there is an entry in red this indicates a reduction in trade costs; the entries in black indicate an increase in trade costs.
We turn now to the results. First, in graph 6 we give the aggregate results across all ten species, and we examine the impact on output, exports and imports. Consider the top panel which gives the changes in UK and EU output (landings or production) as a result of the changes in tariffs and non-tariff measures and quotas assumed across all the scenarios.
There are several key messages which emerge from these results.
It is this combination of the changes for the UK and the changes for the EU which would appear to make this scenario problematic, and consequently in our assessment unrealistic. It is unrealistic because the changes in quotas have a substantial impact on EU fishing – output, exports and imports. Even if the UK unilaterally forced the issue and demanded these changes, almost certainly the EU would retaliate or respond. That could either be within the same sector (fishing), or for example in negotiations with the UK demand compensation elsewhere. It is for this reason that we have also modelled a smaller change in the quotas which is based on shift to 50% of the zonal attachment allocations. Even this would be hard for the UK to achieve with the EU, as it leads to a more than 4% decline in EU outputs. These results highlight both the importance and the significance of the issue of quota allocations, and why UK fisherman are unhappy with the current system based on relative stability.
If we consider those experiments which focus just on the changes in tariff and non-tariff measures we find that:
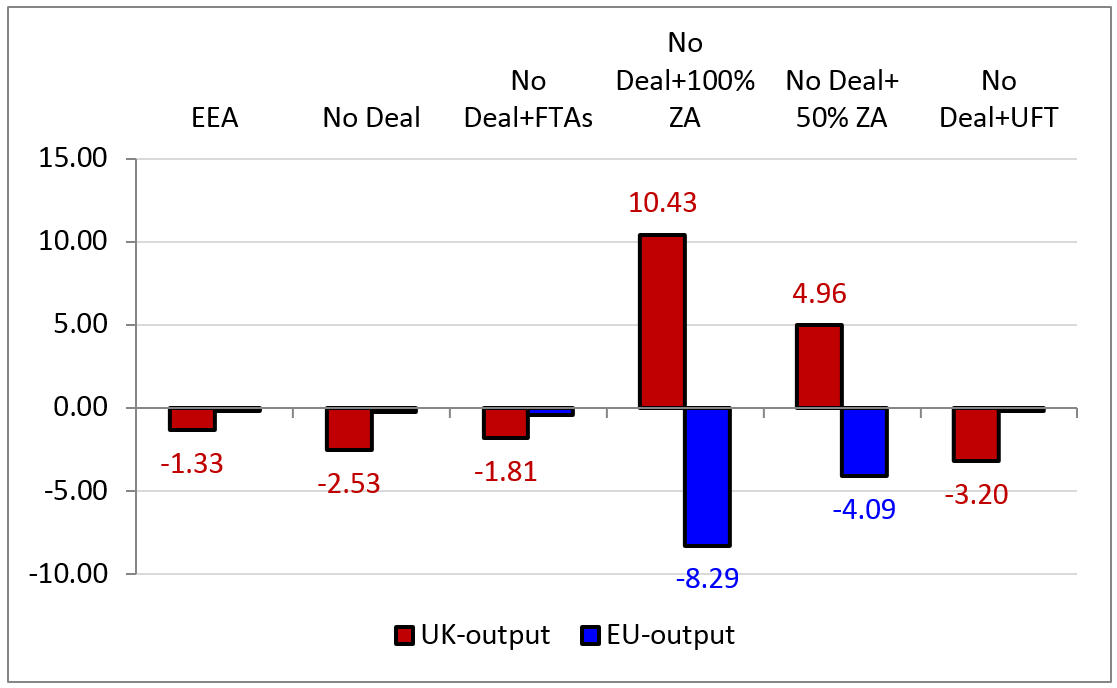
Table 2 gives the changes in output for the UK for each of the species. We give the results for the ‘no deal’ scenario, and also for the ‘no deal’ scenario but with a 50% shift towards zonal attachment. As well as giving the results for output and trade, we also give the results for prices in the UK.
From the table we see that there is a substantial variation in the results across the different fish species. Not surprisingly, prices rise for all species in the event of a ‘no-deal’ Brexit. These price rises range from a modest 0.25% for crab to 6.2% for haddock. Similarly, in all cases exports decline. The biggest decline is for hake (-15.8%) and the smallest for Nephrops (-3.3%). These changes are driven by the underlying structure of trade and by the size of the experiment (level of tariffs and NTMs applied). For example, we see that UK output declines for all species except haddock; haddock is extremely important for the UK market and almost all UK production is sold domestically rather than exported. Increasing tariffs on exports, therefore, does not impact on domestic production, whereas tariffs applied to imports protect the UK industry allowing it to expand. Salmon has the lowest tariff, and consequently, we see smaller changes in both exports and imports.
In the right-hand panel of the table, we give the results where we now add in the possibility of UK quotas based on zonal attachment as opposed to relative stability. Where we do not model any changes in the quota – for those species that are not managed through quotas – we do not report the results for that species (as they are identical to the ‘no deal’ scenario). As with the aggregate changes this has a substantial impact on the results and, most notably, on output, which now rises in all cases. This is closely linked to the size of the quota change – hence herring sees the biggest relative quota change, amongst the biggest increase in output and exports and a big decline in imports. Those species that are not managed through quota (shellfish species such as crab and scallop, and salmon which is predominantly produced through aquaculture) are subject to the increases in tariffs and NTMs without any benefit of increasing production through quota reallocation. Once again the variation across species in part is driven by the quota changes but in part by the underlying structure of trade and production. For example close to 100% of UK exports of saithe go to the EU, hence the impact of increased UK production on exports is greater.
Policy with regard to fishing and fish processing is complex. It is complex because in comparison to many other sectors it is politically sensitive. It is complex because some forms of quota allocations are necessary internationally, and then within the UK those quotas have to be allocated to the UK nations and thence to fishermen. It is complex because of foreign investment and EU labour in the sector. Some of these issues are beyond the remit of this Briefing Paper, where the aim was to outline the key parameters of the policy environment, and then to consider what might be the first order impacts on the UK seafood industry of different possible Brexit scenarios. Several clear messages emerge:
First, if there are no changes in the allocation of UK quotas all Brexit scenarios lead to declines in output and trade, as a result of increasing tariffs and non-tariff measures with the important EU market. In terms of UK output, the worst case scenario would be unilateral free trade, closely followed by a ‘no deal’ Brexit. With regard to UK exports, the ‘no deal’ Brexit leads to the biggest negative impacts.
Second, changes in quota allocation can go a long way to overturning some of these results. Not surprisingly if you increase (substantially) the amount of fish which UK boats are allowed to land, and decrease the amount that the EU can land, then this has a positive impact for the UK. This results in correspondingly large increases in UK exports and a large decline in UK imports.
Third, the potential benefits are not evenly distributed across the UK industry. Parts of the industry focused on species that are managed through quotas, where the UK stands to significantly increase its quota allocation through zonal attachment, stand to make significant gains. However, those parts of the industry that exploit species that are not managed through quotas (shellfish species such as crab and scallop, and aquaculture-produced species such as salmon), may suffer the impacts on trade of increased tariffs and NTMs, without the potential increase in production. The impact is greater for those species for which a large percentage of UK exports are destined for the EU, and the potential increase in the level of tariffs and NTMs.
Fourth, those changes in output, exports and imports for the UK, in particular where there are changes in quota allocations, have a potentially substantial negative impact for the EU – with declines in output, exports, and an increase in imports.
While the UK will indeed have the opportunity of taking back control of its waters, and has the potential for significant benefits from doing so, the way in which it does so will necessarily have consequential impacts on EU (and indeed EEA) fishing industries. If the UK chooses to act unilaterally, it would almost certainly lead to EU retaliation of some sort, either within fisheries or in other policy areas such as trade or market access. The potential gains for the UK are substantial, but there is a need to balance the gains and the potential impacts across the different parts of the industry and it will need to be mindful of the implications not just for fishing and fisheries, but also the UK’s broader relations with the EU.
[1] Source: The UK Fishing Industry (2017), House of Commons Library, Debate Pack no. CDP 2017/0256
[2] Source: UN Comtrade
[3] The EMFF’s objectives, inter-alia, are to assist in the transition to sustainable fishing, to support the diversification of coastal communities, to finance job creation projects along European coasts and to support sustainable aquaculture. Over the period 2014-2020 the total EMFF budget was €5.78 billion Euros, of which the UK received $243 million, which is 4.2% of the total.
[4] MMO (2017) Sea Fisheries Statistics 2016
[5] For example the London Fisheries Convention (1964): allows vessels from UK, France, Belgium, Germany, Ireland and Netherlands to fish within 6-12 nautical miles of each other’s coastlines. These rights were subsumed within the common fisheries policy.
[6] See UN Agreement on Straddling Fish Stocks and Highly Migratory Fish Stocks.
[8] May’s Mansion House speech on 2nd March 2018 spoke about achieving a ‘fairer allocation of fishing opportunities for the UK fishing industry’.
[9] MMO, 2017. UK Sea Fisheries Statistics, 2016.
[10] MMO, 2017. United Kingdom commercial sea fisheries landings by Exclusive Economic Zone of capture: 2012 – 2016.
[11] Seafish (2016). 2016 Seafood Processing Industry Report.
[12] MMO analysis (2013-2015) and Uni Highlands (NAFC, Ian Napier) (2011-2015).
[13] We exclude salmon because this is almost entirely Scottish aquaculture, and the value far exceeds those of the other species.
[14] We included all countries which accounted for at least 2.5% of the value of UK exports and of the value of UK imports of the HS2012 codes (on average over the period 2013–2015)
[15] See report for Marine Scotland for a full description of the process and the assumptions made.
[16] University of Aberdeen & SFF (2017). The Spatial Distribution of Commercial Fish Stocks of Interest to Scotland in UK Waters. A report prepared by the University of Aberdeen for the Scottish Fishermen’s Federation. January 2017
[17] Note that this is unilateral in the sense that for the species in question the EEA countries’ MFN tariffs are zero, hence the increase in tariffs is with regard to the UK levying tariffs on imports from the EEA countries.
This briefing paper was written by Michael Gasiorek, a senior lecturer in economics at the University of Sussex, and Suzannah Walmsley, fisheries and aquaculture business development manager at leading UK marine environmental consultancy ABPmer.
The authors are extremely grateful for the funding provided by Marine Scotland for the original project that developed the model on which this paper is based.