Global value chains and vertical fragmentation in services and manufacturing industries
UK engagement in value chains, specifically mode 5
Services value-added share and exports intensity
Services value-added share and foreign ownership in industries
Which services are used as inputs?
The importance of manufacturing and other sectors for service industries
What can we learn from using firm-level data?
The use of services by manufacturing firms
Impact of UK FTAs on services trade and Mode 5
This Briefing Paper aims to further understanding of the importance of trade in services for the UK economy. In particular, we aim to shed light on the relationship between services and manufacturing trade, including an increasingly significant form of services trade known as Mode 5. Mode 5 trade refers to exports and imports of services that are embodied (used) in the production of goods. Such links between services and manufacturing have grown, driven by increasing specialisation and the vertical fragmentation of production, by which services inputs are supplied to firms as opposed to being produced in-house.
In policy discussions, there is often a tendency to treat goods trade and services trade as independent elements of the trading environment. One of the aims of this Briefing Paper is to highlight the importance of the relationships between them. We do this by considering existing evidence on the links between services and manufacturing for the UK. However, measuring services trade is more difficult than measuring goods trade, and this is particularly the case with Mode 5 trade. We explore what can be learnt top-down from looking at input-output data, and alternatively bottom-up from looking at firm-level data.
We also consider the links between services and manufacturing in the context of the UK’s independent trade policy, including the EU-UK Trade and Cooperation Agreement (TCA) and how it will continue to take shape with the signing of new free trade agreements with non-EU countries (e.g. Australia).
In 2020, the UK’s total export of services amounted to £292 billion, which equalled 48.6% of total exports (goods plus services) that year. This share stood at 32.5% in 2000 and 41.5% in 2010; as such, services account for an ever-larger share of total UK exports. In contrast, the total imports of services represented 26.7%, or £159 billion, of total imports in 2020. Likewise, albeit at a much lower level, this share has increased over the last decade from 23.3% in 2000 to 24.9% in 2010.[1]
These shares – higher than in most major economies – demonstrate the importance of services trade for overall UK trade. However, the values themselves mainly encompass services trade on a Balance of Payment Basis (in WTO parlance what is referred to as Modes of Supply 1, 2 and 4), often via online transactions. These figures do not take into account trade in services via the establishment of a commercial presence and, as such, a considerable part of services trade is not reflected in these official statistics.[2]
Over the last 15-20 years there has been an increase in the vertical fragmentation of supply chains and services have been a key element of this process. On the one hand, servitisation (i.e., the way in which services are provided by manufacturing firms alongside products) has been a growth driver for firms. The bundling of goods and services may require organisational changes but it can provide stronger financial stability and higher customer retention rates. In manufacturing, such services may include periodic monitoring or continuous maintenance activities as opposed to one-off repairs.
On the other hand, the servicification of global value chains (GVCs), whether in manufacturing or other sectors, has given rise to Mode 5 trade. Conceptually, it describes that part of the value of goods sold abroad that consist of services inputs, which have either become part of the product or were part of the production process. Such service inputs may include design and marketing, finance, legal, and transportation services.
Thus, through servitisation and servicification, firms are changing how they organise themselves and their activities; and in the process are changing the nature of the activities. These phenomena matter economically and have implications for policymaking for at least four reasons:
The conventional approach to measuring Mode 5 services trade has been to make use of Input-Output tables such as the ‘WTO-OECD Trade in Value-added’ (TiVA) dataset,[3] or the World Input Output Database (WIOD).[4]
This approach allows one to calculate the share of domestic and foreign value-added in production and, by extension, in exports and imports. This can be done in aggregate or by sector. For example, one could compute the share of domestic and foreign financial services as an input to exports of pharmaceuticals. The ability to measure this form of backward linkage is the main strength of an approach based on input-output tables.
Nevertheless, the approach also presents certain limitations. Firstly, the databases work at a relatively aggregated level (36 sectors in TIVA, 56 sectors in WIOD). Secondly, the underlying input-output tables (IOTs) provide information on the input share of each sector to any other sector in production but do not distinguish between production for domestic sales or for exports. Hence, the trade-related indicators are largely based on various proportionality assumptions – in particular, the assumption that the value-added shares in production are the same as for exports.
An alternative approach could be to make use of firm-level data. The data provides considerably more detail as they can be disaggregated by product, sector, size, type of ownership and thus provide more granular insight into the different inputs used in production. Yet the principal disadvantage of this approach is that firm-level data does not allow for the attribution of different inputs to specific products, be they for domestic sale or destined for export
.
In the discussion below we provide estimates of the value-added share of services in production, and in turn assess the importance to the UK of Mode 5 exports by sector. As we are focussing on the UK, we base the discussion on UK IOTs. This enables us to identify more sectors (105) than would be possible with the inter-country input-output tables (ICIO) – as in the TiVA or WIOD data discussed earlier, and we regard the gain in sectoral detail as a crucial advantage for UK policymakers. A consequence of using the UK IOT is that we lose the comparability of services value-added shares with other countries.
Table 1 gives the share of services value-added in the output of five broad macro sectors per their Standard Industrial Classification (SIC): Agriculture, Forestry & Fishing (A), Mining & Quarrying (B), Manufacturing (C), Utilities (D-E), and Services (F-T).
Putting services aside (since service industries are comprised almost entirely of services inputs), the third column in the table shows that the average share of services in value-added across sectors A-E is 23.4%. This is also true for Manufacturing. The average services value-added share ranges between 18.2% for Utilities and 29.5% for Agri., Forestry & Fishing. The former also exhibits the greatest variation while the latter shows the least variation. The last column in the table indicates the number of industries within each sector. The Manufacturing sector is represented in the sample considerably more than the others, which explains its similarity to the average for non-services sectors.
| Broad sector | Description | mean | min | max | std. dev. | count |
| A | Agri., Forestry & Fishing | 29.5 | 27.0 | 32.7 | 2.9 | 3 |
| B | Mining & Quarrying | 26.6 | 19.8 | 35.2 | 6.5 | 4 |
| C | Manufacturing | 23.4 | 5.5 | 37.9 | 6.1 | 43 |
| D-E | Utilities | 18.2 | 7.1 | 27.8 | 7.2 | 6 |
| A-E | Non-services | 23.4 | 5.5 | 37.9 | 6.4 | 55 |
| F-T | Services | 85.2 | 52.8 | 100.0 | 7.6 | 47 |
Figure 1 depicts the services value-added share at a more disaggregated level within the broad categories A, B, and D-E. The figure shows that Fishing (A03), Mining support activities (B09) and Other waste (E39) have the highest shares of services in value-added. In contrast, Crop & animal (A01), Extraction (B06,07) and Sewerage (E37) are the industries with the lowest share of services in value-added within their respective sector. The shares vary from over 30% for Fishing and Mining support, to less than 10% for Sewerage. Not surprisingly, services inputs matter more for some industries than others.

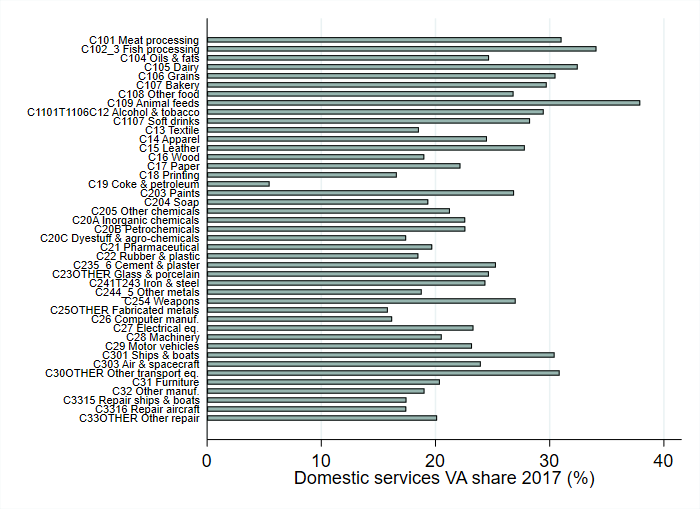
Figure 2 provides an even more disaggregated breakdown for the various constituent manufacturing industries (SIC C). In this instance, we find that Animal feeds (C109) is associated with the highest share at nearly 40%, while Coke and petroleum (C19) display the lowest share at around 5%. Once again, the figure depicts the considerable variation that exists within the manufacturing sector. It also underlines the importance of services as an input to UK manufacturing.
The preceding section showed the relative importance of services in the output of different sectors and industries but does not address the relationship between the use of services and international trade. Thus, in Figure 3 we explore whether and how the use of services as an input is related to the degree of export intensity. The figure plots the services value-added share against the ratio of goods exports over total gross output (i.e., the sum of total intermediate use and gross value-added) in each industry. The magnitude of the bubbles in figure 3 represent each industries’ total output. The figure is set up to uncover any potential pattern or correlation between the relative importance of exports to a sector and its use of services.
Figure 3 shows a weak negative correlation between services value-added share and goods exports intensity but the bottom line is that there is no clear pattern. The most export intensive industries are Motor vehicles (C29), Air and spacecraft (C303) and Other chemical products (C205). These industries display a services value-added share between 20% and 30%, which is right on the average value-added share for industries in this sector. The least export intensive industries are Wearing apparel (C14), Other basic metals and casting (C24.4-5) and Cement (C23.5-6).

There are two key points from Figure 3. The first is that the lack of a clear pattern is not surprising because the underlying industry characteristics and thus their use of services varies considerably. Hence, while the use of services by manufacturing firms will impact their competitiveness and changes in competitiveness over time, this does not mean that having a high services input share is an indicator of trade intensity or export competitiveness.
The second insight is that for a range of important UK export industries with a relatively high export intensity (Motor vehicles, Air & space craft, Pharmaceuticals) services are an important input. Hence, changes in policy that impact services competitiveness can be expected to have knock-on effects on manufacturing competitiveness.
It is widely acknowledged that foreign-owned businesses in the UK are on average larger, more productive and possibly more export-oriented, all of which is seen as a result of these firms having been able to overcome the fixed costs of establishing abroad. Against that backdrop, we consider in this section whether there is a correlation between the services value-added share in an industry and the presence of foreign firms in that industry. To measure foreign presence, we use data from Eurostat ‘Foreign Affiliates Trade Statistics’ (FATS) database on turnover and number of enterprises. As per the EU’s Statistical Classification of Economic Activities (NACE), we consider the industrial sectors NACE B-E and compute the share of foreign turnover/firms using data for 2017.[5] For sectors NACE C-E the data are available at the NACE 2-digit, and for mining and quarrying as an aggregate (NACE B). We collapse the services value-added share from the more detailed SIC industries to the 2-digit level using output-weighted averages. The NACE and SIC classifications are equivalent at the aggregate and at the 2-digit levels.
Industries’ services value-added share is weakly negatively correlated with foreign presence across industries. The correlation is -0.34 with a count share (number of firms) and -0.38 with a value share (turnover). Figure 4 shows scatter plots of services value-added share against foreign presence. The size of the bubbles represents the industry size. The foreign turnover share is much higher than the number of firms share, reflecting the regularity that foreign firms tend to be large. Looking closely, we can see that the negative correlation with foreign turnover share is driven by two sectors: Manufacture of coke and refined petroleum (C19) and Sewerage (E37). Removing these two industries reveals a small positive correlation (0.02).


Thus far, we have established the importance of the relationship between services and manufacturing. In the following two sections, we further decompose this relationship along two dimensions. First, we consider which kinds of services are used and in what proportions by other sectors. This therefore identifies the importance of different service sectors for Agriculture, Forestry & Fishing, for Mining, for Manufacturing and for Utilities. Second, we consider the importance of manufacturing as a downstream destination for services – in other words, how much of total services output is used by non-service sectors.The negative correlation should not be interpreted as evidence that foreign firms use less services inputs: rather, it shows that these industries engage less with the market for the purchase of services inputs. Given that foreign firms tend to be large, it is possible that they have the scale to internalise services tasks. This internalisation of services tasks may likely happen at the enterprise level (parent and subsidiaries).
Figure 5 decomposes the services value-added that goes into manufacturing exports and output by the contributing services input industry.[6]

a) Agriculture, Forestry & fishing

b) Mining

c) Manufacturing

d) Utilities
Consider the third graph, which identifies services use by the Manufacturing sector. This figure tells us that around 30% of all the services used by manufacturing are inputs from the Wholesale & retail industry. The next most significant services contributions to manufacturing are Professional services, and almost equally Transport services. These three sectors account for nearly 60% of services usage by Manufacturing. Given the highly tradeable nature of many manufactures, this analysis helps to identify the service sectors where changes in policy may matter most for UK competitiveness. The same three sectors are the top services input sectors for Agriculture, Forestry & Fishing. The pattern is slightly different for Mining and for Utilities.
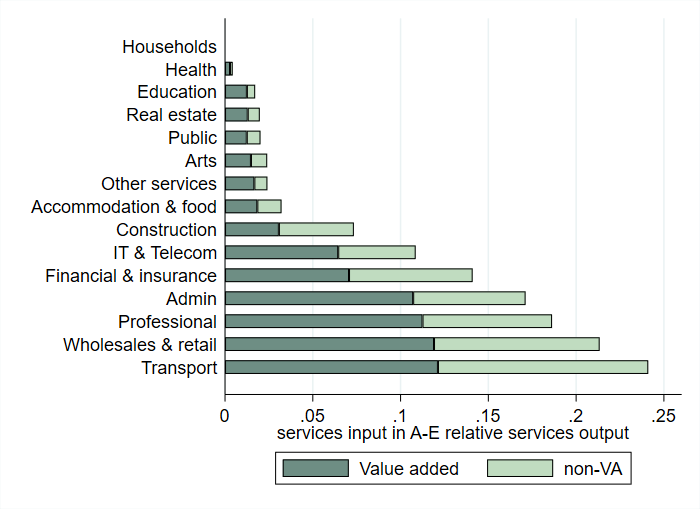
Because of the particular significance of manufacturing, in general, and for exports in particular, we now shed further light on the importance of supplying services to the broad industrial groupings (SIC A-E) for a given services sector. In so doing we compute two different measures: one based on the destination industry’s gross output and the other based on value-added. In Figure 6 the total length of the bar for each service sector represents the share of gross output of that services sector supplied to industries A-E. This gross output share is then divided into two components: the bar in dark green is the value-added component of the share whereas the light green bar is the non-value-added component (the rest).
For instance, nearly 25% of the transport services industry’s output is supplied to the agriculture, mining, manufacturing and utilities sectors. This shows that transport services are more reliant on other non-service sectors than is the case for the other services sectors. This is not to say that the remaining 75% of transport services are all sold to other service industries (F-T). The shares are computed out of total output and, as such, the denominator includes final demand, gross fixed capital formation, change in inventories, acquisitions, and exports that, together with supply to other industries, compose total output. With that caveat in mind, if one looked at sales to services sectors over total sales to other sectors (i.e., total supply of intermediates) then we find that the majority of transport sales do indeed go to other services industries.
We also see that the contribution of services value-added, relative to gross output, is relatively higher in those service activities that involve more highly skilled professionals who discharge tailored or differentiated services such as professional business services and administrative services, as opposed to transportation.
The preceding discussion was based on the use of (fairly aggregate) input-output data. An alternative source of information derives from firm-level data that is collected by the ONS across its various surveys, such as the Annual Business Inquiry (ABI), and by HMRC to the extent that a firm is trading internationally. In this case, each firm is required to report its exports and imports of every product. There are several indicators derived from this considerably more disaggregated information that are relevant for understanding the nature of UK firms’ involvement in trade and in global value chains, which in turn will impact their use and supply of services.
We saw earlier that in 2020 services accounted for 48.6% of exports and 26.7% of imports, and that these shares have risen over time. This trend in turn raises the question as to which firms are engaging in this trade and, in particular, the share of services trade undertaken by non-service firms.
Table 2 looks at the number of firms that are classified as goods producers (down the columns) and cross-tabulates these firms with their services trading status (along the rows). Hence if we consider those firms labelled as goods exporters, we find that just over 30% of them also engage in some form of services trade. Similarly, we see that 15.6% of firms that export and import goods, also export and import services. Thus, this table sheds light on the supply of services by goods producers (servicification) and also on the use of services by goods producers.
| Trade status in goods | |||||
| Trade status in services | Good non-trader | Goods exporter | Goods importer | Goods importer & exporter | Average share per services trade status |
| Service non-trader | 92.9% | 67.4% | 79.4% | 70.0% | 91.7% |
| Service exporter | 3.7% | 21.7% | 4.2% | 6.4% | 3.8% |
| Service importer | 1.1% | 3.5% | 12.6% | 7.9% | 1.7% |
| Service importer & exporter | 2.3% | 7.4% | 3.8% | 15.6% | 2.8% |
| Total | 100% | 100% | 100% | 100% | 100% |
Source: ONS ABS
Table 3 provides an estimate of the share of services trade undertaken, respectively, by services and manufacturing firms. There are several revealing insights from this table. First, as a rule of thumb, services trade by service sector firms is about ten times larger than services trade by manufacturing firms. For instance, in 2010, businesses with a manufacturing industry affiliation contributed 9.4% to that year’s total services trade, or £7.8 billion, whereas the value figure for services sector firms’ exports in the same year is £74.3 billion. The same relative contribution of the two broad sectors to services trade is also true on the import side with shares of 11.2% (manufacturing firms) and 86.4% in 2010 (services firms). Second, over time we see a difference between exports and imports of services. Whereas the share of manufacturing firms to services exports stays roughly at one-tenth, the share of manufacturing firms absorbing services imports rises from 11.2% to 17.3%, and the share of service sector firms falls by 10 percentage points over the period of six years depicted in Table 3. This development is consistent with an ever-deeper process of servicification of the UK economy.
| Year | Exports | Imports | ||||
| MNFG | SERV | Other | MNFG | SERV | Other | |
| 2010 | 9.4 | 89.1 | 1.5 | 11.2 | 86.4 | 2.4 |
| 2011 | 6.9 | 90.7 | 2.4 | 11.7 | 84.9 | 3.4 |
| 2012 | 8.3 | 89.7 | 2.1 | 15.4 | 81.6 | 3.0 |
| 2013 | 9.1 | 86.3 | 4.7 | 10.6 | 81.4 | 8.0 |
| 2014 | 13.8 | 81.7 | 4.6 | 16.2 | 76.3 | 7.5 |
| 2015 | 11.4 | 85.2 | 3.5 | 17.3 | 76.9 | 5.8 |
Source: Authors’ calculations based on data from ABS and ITIS. ‘MNFG’ denotes exports by firms with a manufacturing sector primary affiliation (by SIC), ‘SERV’ denotes exports by firms with a service sector primary affiliation, and ‘Other’ collates all other SIC codes.
What do we know about the services exported by manufacturing firms (as opposed to the services used by manufacturing firms)? Figure 7 gives the sectoral product shares for the top ten exported service products by manufacturing sector firms, alongside the corresponding shares of service sector firms in the same products. For instance, 23.6% of services exported by manufacturing firms are services between affiliated enterprises, while within service sectors firms the corresponding share is 8.7%. This figure highlights the importance of intra-firm services trade.
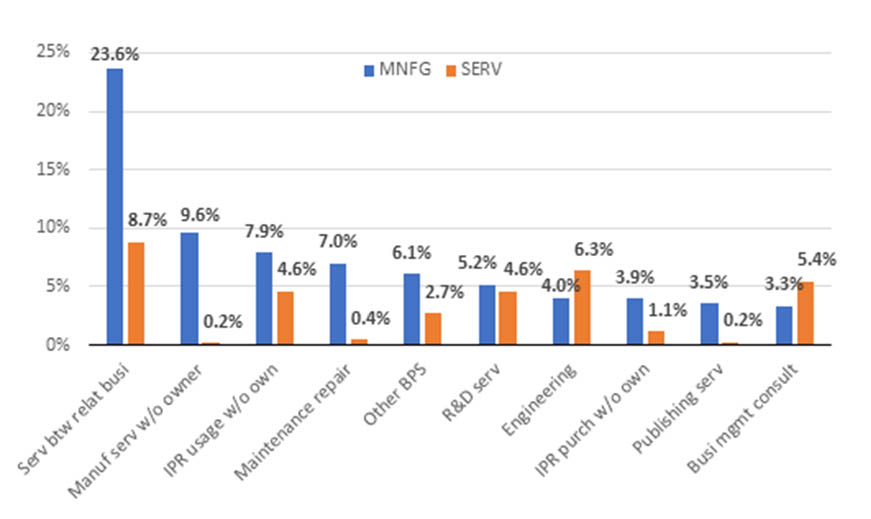
Figure 8 focuses on trade in goods from a different angle by distinguishing between producers and distributors. For example, a given product from the UK, such as shirts, could either be exported by a UK shirt producer, or by a distributor who buys the shirts from abroad and then goes on to export them. The use of services and the supply of services by producers of any given product (in this case, shirts) and distributors is likely to be considerably different – and thus the impact of changes in trade policy are likely to be considerably different.
Figure 8 identifies the average share of goods exports that is attributable to producers by broad product groupings. The figure reveals the heterogeneity that exists regarding the nature of goods exporters across the different manufacturing sectors. If we consider the highest share in the figure, we find that approximately 80% of goods exports categorised as advanced manufacturing & machinery are from firms considered producers. Conversely, only 30% of exports of textiles are undertaken producers.

Source: Authors’ calculations based on data from HMRC and ABS. The horizontal axis shows broad product groupings as discussed in the text.
Firm-level data can also be used to compute the share of goods inputs, services inputs and value-added in firms’ turnover. We compute this for each firm and then aggregate firm-level statistics to provide (weighted) averages for different manufacturing sectors. Whereas Figure 2 provided the contribution of services value-added in manufacturing output on the basis of aggregate UK IOTs, here we provide the share of services as an input into manufacturing turnover.
Figure 9 looks at the average share of good inputs, service inputs and value-added as a percentage of total turnover across 16 manufacturing sectors. With the exception of Mining & Quarrying, all sectors display a higher share of goods inputs relative to services inputs. Interestingly, the Motor vehicles sector, which displays the highest share of goods inputs and lowest services inputs, is associated with the smallest value-added share, which is indicative of the high degree of production fragmentation and value chain integration in this industry. On the other hand, Mining & Quarrying exhibits the highest share of services and also the highest share of value-added.

Following on from the above, Figure 10 shows how the shares depicted in the previous figure have changed over time. This figure shows the growing importance of services as an input across the different sectors and the declining importance of goods as an input in turnover (albeit with some variation). For instance, the share of goods inputs in turnover for manufacturing firms in the Basic Metals industry has decreased by almost 13% between the periods 2010-12 and 2013-15; whereas the share of services inputs in turnover has increased by 2%.

We now turn attention to the way in which Free Trade Agreements (FTAs) may impact services trade including Mode 5 trade. There are several ways in which this may happen. Typically, there are no chapters as such devoted to Mode 5 trade, so the discussion is conceptual and considers both the direct and indirect effects that different chapters in FTAs may have on Mode 5.
There are direct effects brought about by FTAs in light of changes in tariffs and non-tariff measures (NTMs) that may cause changes in merchandise goods and services trade. Chapters containing commitments on tariffs, rules of origin, standards and regulations will have an effect on how firms source their inputs and where these inputs are sourced from. Chapters on services liberalisation will impact directly on services trade.
On the services side, the extent of liberalisation achieved by any given FTA will impact whether firms source these services domestically or from abroad, and this in turn will depend on the nature of the services used. Similarly, labour mobility will also impact services trade. These would then bring about indirect effects as methods of production and supply chains both adjust to these changes.
To quantify the magnitude of (some of) these effects, we employ partial equilibrium (PE) methods. We link the changes in manufacturing output to derived changes in services output following the results of PE model simulations. These simulations are based on the UK’s exit from the EU Single Market, as per the TCA. The TCA is modelled as a change in both tariffs and non-tariff barriers, from which the impact on services, direct and derived, is obtained according to the following steps:[7]
Step 1: The following results are based on the PE simulation results for the UK-EU TCA experiment. The model has 132 agriculture and manufacturing sectors and 16 services sectors. The summary results of the impact of the TCA for agriculture, manufacturing and services are reported in Table 4. Because the conditions of trading with the EU under the TCA are generally less favourable as compared to Single Market conditions that had prevailed hitherto, the overall impact on trade in each of these is negative. For manufacturing sectors, the new trade frictions also entail that output would be lower by nearly 4% on average, and in services by 1.3%.
| Output change % | Exports change % | Imports change % | |
| Agriculture | 3.7 | -10.8 | -6.6 |
| Manufacturing | -3.9 | -12.0 | -4.6 |
| Services | -1.3 | -9.4 | -14.4 |
Step 2: The fact that the TCA leads to less trade and output implies that the derived demand for services inputs will also be lower, as detailed in Tables 5 and 6 below. As such, these figures are rather specific to the TCA and its unique circumstances. If other UK FTAs were instead forecast to lead to higher trade and production, then a correspondingly different set of results—more positive—could result with regard to services demand.
Table 5 then reports the derived output changes for the ten most affected service sectors by value of impact, out of the 47 services sectors in the UK input-output table. These are the changes as a result of the changes in output in the agriculture and manufacturing industries from the simulation of the TCA.
| SIC | Description | Change in services VA supplied to agriculture and manufacturing,
£M |
Change in services VA supplied to agriculture and manufacturing relative to services output (%) |
| G46 | Wholesale ex. Motors | -434 | -2.16 |
| K64 | Fin. Service (excl. Insurance) | -267 | -2.31 |
| G47 | Retail trade, ex. Motors | -164 | -1.73 |
| H52 | Warehousing & Support | -152 | -3.1 |
| J62 | Comp. Programming, Consultancy | -150 | -3.09 |
| M691 | Legal activities | -126 | -3.58 |
| M692 | Accounting | -101 | -2.95 |
| M71 | Architectural& Engineering | -86 | -3.48 |
| H53 | Postal And Courier | -80 | -2.99 |
| P85 | Education | -72 | -5.1 |
| Total | Total (47 service sectors) | -2349 | -2.0 |
Step 3: In the PE simulations and as discussed earlier it is not possible to model all 47 sectors, and we work both with a more aggregated set of services industries, and with some industries excluded. In Table 6 we provide details of the derived indirect impact of the TCA (as above), as well as the direct impact of the changes in non-tariff barriers between the UK and the EU on the 16 service industries of the PE model. The sectors are listed by order of the value of the derived impact in descending order.
| SIC | Description | Derived change in services output
£M |
Direct change in services output
£M |
% Change in services output supplied to manufacturing | Direct change in services output, % |
| G45 | Wholesale ex motors | -9.08 | -398 | -0.11 | -4.82 |
| M69 | Legal & accounting | -287 | -260 | -3.28 | -2.96 |
| K66 | Activities auxiliary to finance & insurance | -48.5 | -183 | -2.9 | -11 |
| N | Administrative | -144 | -146 | -2.74 | -2.79 |
| M71 | Architectural & engineering | -183 | -102 | -3.48 | -1.94 |
| J62 | Computer | -252 | -71.1 | -3.09 | -0.87 |
| H52 | Warehousing | -326 | -49.6 | -3.1 | -0.47 |
| J59J60 | Motion picture & broadcasting | -30.3 | -46.8 | -2.2 | -3.39 |
| J61 | Telecom | -80.2 | -23.6 | -1.85 | -0.54 |
| K65 | Insurance | -58.5 | -17.9 | -2 | -0.61 |
| H53 | Courier & postal | -127 | -7.8 | -2.99 | -0.18 |
| K64 | Finance | -534 | 21.75 | -2.31 | 0.09 |
| F | Construction | -143 | 24.9 | -1.71 | 0.3 |
| H50 | Water transport | -13.8 | 25.37 | -2.14 | 3.95 |
| H51 | Air transport | -34.9 | 85.93 | -2.97 | 7.31 |
| H49 | Land transport | -114 | 117.8 | -0.7 | 0.72 |
There are two implications from this table. First, we see that the ‘modelled’ impact on services shows that the indirect effect, which arises from the impact on the demand for services from the non-service sectors, may well be greater than the direct impact on services, arising from changes in NTMs. Of course, this will depend on the size of the changes in the trade costs in both manufacturing and services, and the associated changes in trade flows.
The key point here is that trade policy for goods needs to closely consider the derived impacts on services. Whilst different experiments will no doubt lead to different relative magnitudes, our simulations indicate a derived demand shock for services in the ballpark of £2.3 billion. By comparison, this figure corresponds to about 1.4% of total services value-added and, as such, is far from negligible.
Second, we see that there is considerable variation in the impact on different service sectors, both with regard to the direct and indirect impacts, which of course depends on the size of the changes in trade costs and the extent of Mode 5 linkages between goods and services. Hence SIC 45 (Wholesale excluding motors) experiences the largest negative direct and indirect impact. However, whereas financial services is the second most affected sector in terms of the direct impacts, it is much lower down the list when it comes to indirect impacts, and where the derived impact is positive.
This Briefing Paper sets out what the data tells us about the interconnections between services trade and goods trade. It is generally well known that services comprise a significant fraction (c. 80%) of UK GDP, but the role of services trade for the UK economy is probably less well understood, in particular, those interconnections between services and goods trade. In part, this is because the evidence is patchy and tends to be only available at quite an aggregated level. Our review of the evidence, however, is that existing data reveals the importance not just of services trade in its own right, but also services embodied in the trade of other sectors, as well as services trade undertaken by non-services sector firms.
This clearly matters – or should matter – for the ongoing development of UK trade policy and for what the UK negotiates in its trade agreements with third countries. Our stylised modelling suggests that the indirect impact on services could be greater than the direct effects. Here it is important to note that even though we are working at a considerably more disaggregated level than the standard model the UK government uses for its scoping assessments and evaluations of signed trade agreements, the analysis presented here is still somewhat aggregated. Still, the evidence in this Briefing Paper highlights the importance of wholesale and retail services, professional services, transport services, finance and insurance, and administrative services. For policy purposes, the nature of how these services interact with goods trade and the policy / market access barriers and their implications for goods and services trade need to be understood in much greater detail. There is thus an urgent need to undertake much more granular firm-level analysis of the way in which firms engage in domestic and international supply chains with other firms and with their own affiliates.
This work contains statistical data from HM Revenue & Customs (HMRC) which is Crown Copyright. The research datasets used may not exactly reproduce HMRC aggregates. The use of HMRC statistical data in this work does not imply the endorsement of HMRC in relation to the interpretation or analysis of the information.
HM Revenue & Customs agrees that the figures and descriptions of results in the attached document may be published. This does not imply HMRC’s acceptance of the validity of the methods used to obtain these figures, or of any analysis of the results.
This work was produced using statistical data from ONS. The use of the ONS statistical data in this work does not imply the endorsement of the ONS in relation to the interpretation or analysis of the statistical data. This work uses research datasets which may not exactly reproduce National Statistics aggregates.
[1] Source: ONS Pink Book 2020.
[2] The General Agreement on Trade in Services (GATS) created by the WTO defines four modes of services trade. Mode 1 refers to cross-border supply; Mode 2 to consumption abroad; Mode 3 to sales through establishment of commercial presence abroad; Mode 4 to the presence of natural persons as services suppliers abroad. See: https://www.wto.org/english/tratop_e/serv_e/gatsqa_e.htm
[3] The Trade in Value-added (TiVA) database is a collection of measures that can provide insights into global production networks and supply chains beyond what is possible in conventional trade statistics. The TiVA database contains a selection of principle indicators that track the origins of value-added in exports, imports and final demand for the years 2005-2015; http://stats.oecd.org/Index.aspx?DataSetCode=TIVA_2018_C1
[4] See: The World Input-Output Database (WIOD): Contents, Sources and Methods for further guidance; http://www.wiod.org/publications/source_docs/WIOD_sources.pdf
[5] For two sectors data for 2017 are suppressed because of confidentiality, so we use the average 2010-16.
[6] Note that the underlying services value-added share in manufacturing in the data is the same for exports and output. The difference between the two bars (light and dark colour) shown in Figure 5is driven by aggregation.
[7] A more detailed technical explanation can be provided on request. The model used is based on an underlying imperfectly competitive framework, and the experiments are set to model only the direct impacts on trade and production from the changes in tariffs and non tariff barriers. In this variant of the model we do not consider the secondary effects of changes in intermediate input costs.
[8] In total the 16 sectors in the PE model cover 20 of the IOT sectors. The 20 IOT sectors covered accunt for 47% of Total Use of services sectors in the IOT, and 79% of the exports of services in the IOT.
Antimiani, Alessandro and Lucian Cernat (2018), “Liberalizing Global Trade in Mode 5 Services: How Much Is It Worth?” Journal of World Trade 52(1), pp. 65–83.
Cernat, L. & Sousa, N. 2015, “The Trade and Jobs Nexus in Europe: How Important Are Mode 5 Services Exports?”, CESifo Forum, vol. 16, no. 4, pp. 65-67.
Cernat, L. & Kutlina-Dimitrova, Z. 2014, “Thinking in a Box: A ‘Mode 5’ Approach to Service Trade”, Journal of World Trade, vol. 48, no. 6, pp. 1109-1126.
Rueda-Cantuche, J., Cernat, L. & Sousa, N. 2019, “Trade and Jobs in Europe: The Role of Mode 5 Service Exports”, International Labour Review, vol. 158, no. 1, pp. 117-136.
UKTPO Briefing Papers 14 & 22.