Total Trade: Exports and Imports
Trade by Sectors and Industrial Categories
Rules of Origin and Preference Utilization Rates
The United Kingdom formally left the European Union on 31 January 2020. However, an agreed transition period ensured that the UK and EU continued to trade on the same terms as when the UK was an EU member until 1 January 2021. Since then, the UK’s trading relationship with the EU, its biggest and closest trading partner, has been governed by the Trade and Cooperation Agreement (TCA)[1] and with non-EU partners by other independent trade agreements.[2]
The TCA eliminates all tariffs and quotas on goods traded between the UK and the EU, provided that firms’ exports satisfy rules of origin requirements. These rules are complex and product-specific. Whilst some documentation and customs declarations have not yet kicked in,[3] these requirements and procedures increase the cost of trade with the EU. Furthermore, as the TCA does not include any simplifications for border formalities, imports and exports of goods are subject to customs declarations and inspections for standards and regulations and veterinary inspection. The EU chose to apply these checks for goods moving into the EU and Northern Ireland starting from 1st Jan 2021, while the UK chose to delay the checks.[4] On the other hand, UK imports originating outside the EU that are not subject to preferential treatment must pay the external tariff rate as specified in the UK Global Tariff schedule.[5]
With every new release of data on UK bilateral trade flows, analysts have been swift to investigate the effect that trading under the new regulations has had on trade with both EU and non-EU countries.[6] However, caution must be taken in the interpretation of these data as separating the TCA effect from disruptions to trade caused by the Covid-19 pandemic and other events pose conceptual and practical challenges. To assess the TCA effect, we need an estimate of a counterfactual that tells us how much UK-EU trade would have been in the absence of the TCA. By definition, the counterfactual is not observed and therefore needs to be estimated. In this Briefing Paper we use different methodologies to estimate this counterfactual, and we show that the various methods provide similar answers.
While our results appear robust to different methodologies, we are cautious in their interpretation. First, monthly trade data are volatile and can be subject to revisions or changes in the way they are collected. In addition, since January 2021, the HMRC changed the method of trade data collection to the EU from intrastate statistical survey to customs export and import declaration. [7] Finally, a proper assessment of the TCA effect on UK-EU trade will have to wait for more data in the post-TCA period as the first few months of data might just show a transition to a new equilibrium.
In this Briefing Paper, we first present how UK merchandise trade has changed in the first quarter of 2021 with the EU and non-EU countries via descriptive and econometric tools. Secondly, we complement the analysis by assessing the changes by broad product and industrial groupings. Thirdly, we consider the impact that rules of origin may already be having on UK firms exporting to the EU by looking at data available on preference utilization rates (PURs).
There are different ways in which we can estimate a counterfactual, and some are more credible than others. These counterfactuals differ in the information on which they are based and the method used to construct them.
A simple counterfactual for UK-EU trade in 2021 is offered by UK-EU trade in previous periods. In our descriptive analysis, we compare trade in January-March 2021 with the average January-March of the three preceding years.[8] In this case, the counterfactual is average trade in January-March 2018-20 and it includes only information about UK-EU trade in 2018-20. While such a counterfactual is simple and intuitive it has a major pitfall. If UK’s exports in 2021 were different from the 2018-20 average for reasons independent of the TCA (for example because of Covid-19), our estimate of the TCA effect would be a mix of the true TCA effect and the other factor(s) that affected UK trade in 2021.
However, we can adjust the counterfactual for such UK-specific confounding factors by using a suitable control group. This can be done comparing the evolution of UK-EU trade to UK’s trade with other countries that can be considered similar to the EU. For instance, if the vaccine roll-out increased UK’s exports to all destinations in 2021, but UK exports to EU increased by less than to non-EU countries, we conclude that the difference in changes between EU and non-EU may be due to the TCA. This approach is called ‘difference-in-differences’ (DD).
Other confounding factors can arise from the partner-side. As there can be UK-specific factors, there can be EU-specific factors affecting trade in 2021. If in 2021 EU countries imported less from all exporters and not only from the UK, our estimate of the TCA effect based on the DD method will be biased because we would fail to account for such EU-specific drop in imports. To control for this, we should include information on EU imports from other exporters. The method that we use to account for both UK-specific and EU-specific confounders is called ‘triple difference’ (DDD). In this case, we include information on UK trade with EU and non-EU as well as EU trade with other partners.
Finally, there remains some uncertainty about the ability of the control group to be a good counterfactual for UK-EU trade. In our difference-in-differences as control group we use the UK’s trade with OECD and BRICS countries, and in the triple-difference we include also intra-EU trade and EU trade with OECD and BRICS. While these countries may be a good control group for UK-EU trade, it is possible that not all of them are equally good. In our last exercise, we use the ‘Synthetic Control Method’ (SCM) to deal specifically with this issue. The SCM selects from all countries in the control group only those that can best mimic UK-EU trade in the pre-TCA period, and then uses only these ‘good-quality’ control units to construct the counterfactual.
At an initial stage, we consider how UK goods exports and imports have changed in the first quarter of 2021. We use publicly available data from HM Revenue and Customs (HMRC) on the monthly bilateral values of UK goods exports and imports between 2017 and 2021. The data are measured on a customs basis with goods classified by the Harmonised System (HS) at the most disaggregated level.[9]
The analysis we present compares the quarterly values in UK exports and imports in 2021 relative to the average values of the same quarter in the preceding three years. The reason for this is to provide a reasonable basis for comparison. As UK trade may have been affected by ongoing Brexit uncertainties over the preceding years, as well as by the on-going Covid-19 pandemic, we take a three-year average as opposed to simply considering trade one year earlier.
It is important to bear in mind that the month-on-month changes observed using the same methodology had already shown considerable disruption: UK exports and imports to and from the EU in January were 49% and 31% lower, respectively. The data for February and March showed signs of recovery from the January slump but UK exports to the EU remained at lower levels as did imports from the EU. This pattern is also observed for exports and imports to and from the rest of the world, though the differences are less pronounced.
Table 1 shows that in the first quarter of 2021, UK total exports (to the world) were £5 billion, or equivalently 6.4%, lower than the first quarter average of the previous three years. Total exports to the EU were 22% lower, while exports to non-EU countries were 9% higher. These differences amounted to -£9.6 billion and +£4.1 billion, respectively. In comparison, UK imports experienced relatively larger changes. Total imports from the world were almost £26 billion lower (-19%), while imports from EU countries and non-EU countries were down by 23% and 1.6%, respectively. These differences also equate to larger negative monetary changes: UK imports from the EU were £15.4 billion lower while imports from non-EU countries were £1.1 billion lower.
| EXPORTS | £ million | |||
| Partner | Average Q1 2018-2020 | Q1 2021 | Difference | Change (%) |
| EU | 43,765 | 34,104 | -9,661 | -22.1 |
| Non-EU | 45,041 | 49,105 | 4,064 | 9.0 |
| World | 88,805 | 83,170 | -5,635 | -6.4 |
| IMPORTS | £ million | |||
| Partner | Average Q1 2018-2020 | Q1 2021 | Difference | Change (%) |
| EU | 66,862 | 51,493 | -15,369 | -23.0 |
| Non-EU | 61,902 | 60,759 | -1,144 | -1.6 |
| World | 137,979 | 112,384 | -25,595 | -18.55 |
Looking at the UK’s top trading partners[10], we find that exports were between 7% and 34% lower. The largest declines in trade occurred with EU member states, most notably Poland (-34%), France (-33%) and Spain (-33%). On the other hand, UK imports were, with the exception of China, between 10% and 45% lower.[11] Similarly, imports from EU members experienced the largest falls, namely France (-45%), the Netherlands (-44%) and Germany (-35%).
All in all, the quarterly figures show prima facie that the UK’s trade in goods, with the exception of UK exports to non-EU countries, were considerably lower in the first quarter of 2021 than the 2018-2020 average first quarter values. The adverse trade differences are substantially higher for EU than non-EU countries, which appear to show the first signs of a TCA effect.
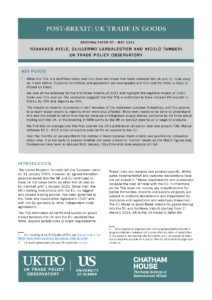
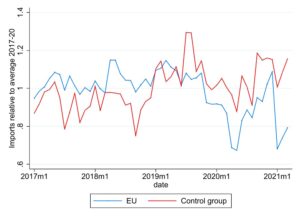
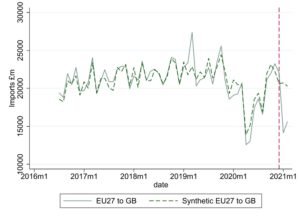
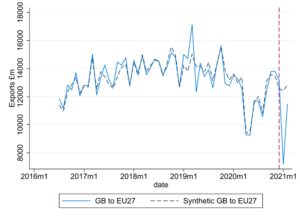
In this exercise, we estimate the TCA impact with what is formally called a ‘difference-in-differences’ estimation technique that compares UK trade with the EU and with a control group composed of non-EU OECD BRICS countries.[12] Arguably, the Brexit referendum may have already changed the way in which the UK trades with the EU and so to avoid any structural break in the series we focus our analysis on the post-referendum period. Figure 1 shows UK trade with the EU27 and the control group over 2017-2021 relative to the monthly average of the pre-treatment period. Hence, UK exports to the EU in Jan21 are divided by the average of exports to the EU in Jan17, Jan18, Jan19 and Jan20. The two panels show that UK trade with the EU and non-EU behaved in a reasonably similar fashion prior to 2021. We then see a substantial drop in exports to the EU in 2021, while UK exports to ROW rose substantially in February and March 2021 (panel a). The picture is slightly different for imports, as differences between trade with the EU and the control group were also present prior to 2021 (panel b), nevertheless we see a more substantial divergence in 2021.
| a) Exports | b) Imports |
| Source: authors’ elaboration of HMRC data. The figure show trade in a given month divided by the average of the same month over the years 2017-20. The control group is composed by non-EU OECD countries and BRICS. | |
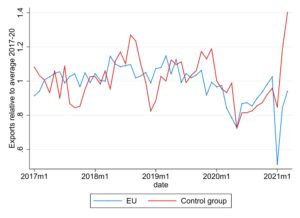
A simple inspection of Figure 1 suggests that UK exports to the EU have been strongly affected relative to UK trade with the control group of countries (ROW). However, when we dig into the details, we find that the UK’s surge in exports to the control group in February-March 2021 is almost entirely driven by gold exports to Switzerland. Gold exports to Switzerland were £0.8 billion in January, £2.7 billion in February and £5.2 billion in March. On the other hand, we do not find any such behaviour for UK imports from Switzerland. We therefore ask, how does the comparison EU vs control group look like when we exclude Switzerland? The answer is: very different. In Figure 2 we now see a big drop in January 2021, but very little difference in February or March 2021.
In light of these considerations, we drop Switzerland from the control group for exports as it does not represent a good comparison for UK’s exports to the EU27. We do not remove it from the control group for imports, as UK’s imports from Switzerland are not so concentrated on gold and they do appear to follow a different path than the UK’s imports from other OECD/BRICS countries.
All in all, the results from the difference-in-differences estimation tells us that over January-March 2021 UK’s exports to and imports from the EU were down by 15% and 32%, respectively. In contrast to the descriptive analysis, the use of a control group accounts for UK-specific confounders shows that imports have been more affected than exports. For interested readers, details of the difference-in-differences estimation are reported in the online appendix to this Briefing Paper.[13]
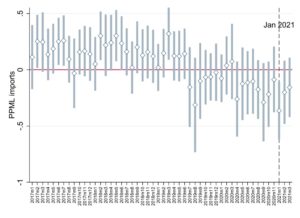
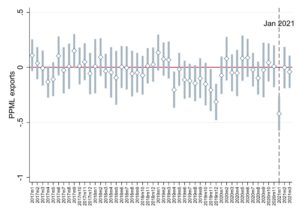
We then extend this approach to look at whether the estimated effect is constant across the three months of 2021 using an ‘event study’ approach. Figure 3 shows the coefficient estimates with the 95% confidence interval. The central values (the dots) represent the difference between UK trade with the EU and the control group in each month relative to December 2020, the reference period. The bars around the central values measure uncertainty about this estimated difference: the larger the bar, the more uncertainty. If the uncertainty bars touch the zero (the horizontal line) then we cannot consider the estimated EU/non-EU difference to be different from zero. This graph allows us to see whether there are substantial differences between UK-EU trade and UK trade with the control group prior to 2021. If we do not find substantial differences or trends before 2021, we can be more confident about the estimation of the TCA effect in 2021: because EU and control group behaved similarly prior to 2021, we can attribute the 2021 difference to the TCA. For both exports and imports we find a strong negative effect in January 2021, but we cannot reject the hypothesis of no effect in February and March 2021. That is, the difference between EU and control group in Feb-Mar 2021 is not far away from what we observed prior to 2021. This suggests that the TCA affected UK-EU trade in January 2021, but not very much in February and March.
| a) Exports | b) Imports | |
| The graphs show the coefficient estimates and 95% C.I. from a PPML regression where we interacted a dummy for the EU with dummies for each period. The period considered is all months from January 2017 to March 2021. The reference period is December 2020. The control group is OECD+BRICS, excluding Switzerland for exports. Details are reported in the appendix. | ||
We now expand the dataset to include the partner countries information. The expanded dataset now includes information on EU trade with itself and with OECD and BRICS countries, as well as UK trade with EU, OECD and BRICS. This methodology allows us to account for any EU-specific factor that affected EU trade in 2021, and is an even more credible method than the DD to assess the TCA effect. However, at the moment, this comes at some cost: not all EU members have reported trade figures for March 2021, so the analysis is confined to the first two months of 2021.
With this expanded dataset we run a triple-difference estimation for exports and imports separately, where we compare the UK’s trade with the EU vs the control group (first difference) before and after 2021 (second difference) vs EU trade with EU vs control before and after 2021 (third difference). Importantly, the triple difference estimation allows us to control for any factor which is specific to a particular exporter or importer and how it varies over time. This means that we are able to control for things such as the evolution of the pandemic in different countries. For instance, if the wave of Covid-19 cases that affected European countries in 2021 led the EU to import less from all sources and not only the UK in 2021, we can factor in this EU-specific effect and clean our counterfactual from this effect.
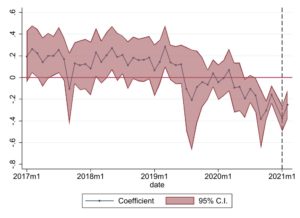
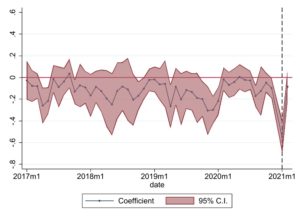
As with the earlier difference-in-differences results, full details of the estimation are confined to the appendix. The results show that the impact of the TCA on UK exports to the EU was to reduce those exports by 18.6%, while imports are 34.6% lower than what they could have been had the UK not changed its trade arrangements with the EU. These estimated TCA effects are very similar to those of a DD run using data up to February 2021. For exports, we find that the TCA effect is confined in January 2021. On the other hand, for imports we find evidence of an effect in February as well, but this appears to be the result of a trend started prior to 2021 and possibly stockpiling in December 2020. The results of the event analysis using the triple difference are reported in Figure 4, with the blue line representing the estimated effect of each month relative to December 2020 and the area in red the degree of uncertainty.
| a) Exports | b) Imports |
| The figure plots the coefficient estimates of the triple difference estimated with the PPML estimator where the interaction between the UK and EU dummies is interacted with dummies for each period over Jan2017-Feb2021. The reference period is December 2020 and confidence interval is based on robust standard errors clustered at the pair level. Details are reported in the appendix. | |
Our ability of estimating the ‘TCA-effect’ in the previous sections strongly depends on the quality of the control group that we chose for our comparison. Because some countries can be better control units than others, we use the Synthetic Control Method (SCM) to look for the set of control units that best represents UK-EU trade prior to 2021. While the DD and the triple difference methods were agnostic about the quality of each country in the control group as comparison units for UK-EU trade, the SCM is not, and it will give more importance to those countries which are better comparison units.
Take for example, UK exports to Germany, our potential set of comparison units is given by the UK’s exports to non-EU OECD and BRICS countries, as well as Germany’s imports from OECD (including EU) and BRICS. We then let the algorithm choose the combination of country-pairs that best resembles UK’s exports to Germany over the period July 2016-December 2020. That combination of countries, then gives us our synthetic control, a ‘synthetic’ level of UK-Germany trade: our counterfactual. Finally, we compare the actual UK-Germany data with the ones predicted by the synthetic UK-Germany to measure the TCA effect. We do so for each EU member country and then aggregate the results to get a picture for the UK’s trade with the EU27. As before, because not all EU countries reported trade for March 2021, we run the SCM up to February 2021 for the EU27, and we then run it up to March for the nine EU countries that reported March trade figures. The set of nine EU countries is composed of Czech Republic, Germany, Estonia, France, Greece, Ireland, Lithuania, Portugal and Spain. Together, these countries accounted for 57% of UK’s exports to the EU and 52% of imports from the EU over the period 2017-19, and can therefore be informative on what happened in March for the whole EU27.
The SCM results for the EU27 up to February 2021 are reported in Figure 5. The series shows a significant effect both in January and February 2021 for both exports and imports. Because of the selection mechanism of the control units, we do not see different trends in UK imports from the EU relative to the control group as we found in the triple difference (see Figure 4). That is, we specifically chose control units that do not yield such different pre-2021 trends. According to the SCM, exports have been down by 42% in January and by 10% in February, while imports were down by 32% in January and 23% in February.
| a) Exports | b) Imports |
When we run the SCM on the nine EU countries that reported trade for March 2021 we find similar results for January and February 2021, so we can have a sense of the effect in March for the whole EU27 by looking at the results for the nine-members group. For these countries, which account for over half of UK trade with the EU, we do not find evidence that UK’s trade with the EU in March 2021 has been lower than expected.
Table 2 summarises the results obtained with the different methodologies for both exports and imports. For each flow type and method, we report the estimated TCA effect in percentage terms for the whole of 2021 and for individual months. The figures in bold are those that are significantly different from zero.[14] Note that for the DD with HMRC data and the SCM with nine EU countries we have data for January-March 2021, while for the triple difference and the SCM on the EU27 we have data only up to February 2021. We consider the triple difference and the SCM approaches better than the DD estimation for the estimation of the TCA effect, and these two methods yield very similar results for both exports and imports. While we do not have figures for the EU27 in March 2021, given the similarity of the SCM results for the EU27 and nine EU countries in January and February, we can expect the EU27 results for March to be similar to those of the nine EU countries. Overall, the results point to a reduction of exports by -42% in January 2021 and -10% in February and, at the moment, no effect in March. For imports, the TCA effect appears more distributed across months, with a -32% in January and -23% in February. Also, for imports, it appears that the TCA effect may not have been present in March, but results for March should be interpreted with caution.
| Flow | Method | Total | January | February | March |
| Exports | DD | -14.9 | -34.3 | -0.10 | -4.0 |
| Imports | DD | -31.5 | -30.5 | -18.2 | -15.0 |
| Exports | DDD | -18.6 | -42.3 | -8.1 | |
| Imports | DDD | -34.6 | -31.4 | -22.2 | |
| Exports | SCM EU27 | -26.3 | -42.3 | -10.3 | |
| Imports | SCM EU27 | -27.3 | -31.6 | -23.0 | |
| Exports | SCM nine EU countries | -21.9 | -42.6 | -16.1 | -0.07 |
| Imports | SCM nine EU countries | -23.3 | -29.6 | -23.3 | -0.17 |
| Note: the number in bolds are those statistically different from zero. For the SCM results, p-values are based on the premutation tests hence not directly comparable to the regression p-values. The column total reports the effect over all months of 2021. For the DD estimation and the SCM with nine EU countries this includes Jan-Mar 2021, while for other estimations it includes Jan-Feb 2021. | |||||
The results so far indicate that UK exports and imports to and from the EU were hit hard in January but may have quickly rebounded in February and March 2021. The initial falls may have been somewhat expected given that the uncertainty of a deal in the last quarter of 2020 led firms to stockpile. In addition, as new procedures and formalities are introduced, firms inevitably go through a learning and adaptation period. This may be the arguments of those who said that the Brexit hit was exaggerated and trade is back to ‘normal’ – or it could be a reverse rebound effect with firms recovering from the dramatic fall in January, or it could simply reflect the vagaries of short-term data.
The fall in imports which appears at least of the same order of magnitude as the fall in exports is also interesting – especially as the UK delayed the imposition of customs formalities. We do not have an answer to this and so for now can only speculate. Possible factors driving this might be the engagement of UK firms in EU value chains hence falls in exports are connected to and correlated with falls in imports; or that EU firms have simply chosen to focus their exporting activity on other markets because of concerns regarding Brexit effects and the uncertainties associated with exporting to the UK; or it could be related to the UK’s introduction of its Global Tariff which reduced tariffs on imports from non-EU countries on a wide range of goods which may have increased non-EU exports to the UK.
Assessing total trade levels hides the heterogeneous impact that the new post-Brexit trading arrangement has had on different sectors. We first show the number of product categories that experienced a decline in exports and imports in the first quarter of 2021 relative to the average 2018-20 Q1 values. We do this at different levels of disaggregation of the product classification, namely the HS 2-digit and HS 4-digit levels. There are a total of 97 categories at the HS-2 level and 1221 categories at the HS-4 level. At both levels, the number of categories that saw declines in exports and imports during the first quarter of 2021 is higher for the EU than non-EU. Specifically, at the HS4-digit level, 877 groups saw declines in exports to the EU while 737 groups saw declines in exports to non-EU countries. The corresponding numbers for imports are 976 and 660 industries to EU and non-EU countries, respectively.
| Flow | HS4(#) | HS2(#) | |
|
EU |
Exports | 877 | 86 |
| Imports | 976 | 85 | |
|
Non-EU |
Exports | 737 | 58 |
| Imports | 660 | 44 | |
|
World |
Exports | 891 | 86 |
| Imports | 866 | 71 |
To see whether the TCA affected products or industries differently, we consider seven broad product groups: Advanced Manufacturing & Machinery, Agrifood, Automotive, Chemicals, Manufacturing & Electronics, Materials and Textile. For each product group we run the difference-in-differences regressions described earlier using HMRC data only, with the control group defined as OECD+BRICS countries. In order to include data up to March 2021, we use only the difference-in-differences method for the analysis by product groups. Table 4 reports the trade values with the EU in 2017 for each product group together with the estimated TCA effects. The TCA effects in bold represent those that are statistically significant.
We find that Textile (-63%) is the most severely affected product group for exports, followed by Agrifood (-36%) and Automotive (-20%). Materials shows a change equal to -57% when we include Switzerland, but an effect not statistically different from zero when we exclude it. Chemicals, Manufacturing & Electronics and Advanced Manufacturing do not appear to be affected. Textile, the most affected product group for exports, is a sector in which a large part of trade is carried out by distributors, which do not do any further processing on products and have been concerned with rules of origins issues. Agrifood products on the other hand have to deal with SPS measures. The press covered various episodes in which border delays due to the imposition of customs checks have negatively affected UK’s food exporters to the EU.
For imports we find negative and significant effects across all sectors but Advanced Manufacturing. The most affected sectors are Chemicals (-58%), Manufacturing & Electronics (-46%) and Automotive (-41%). In the case of imports, we find a more homogeneous effect across the various sectors. This is consistent with the results on total trade.[15]
| Product group | Exports | Imports | |||||
| value £m | share | TCA effect (%) | value £m | share | TCA effect (%) | ||
| Adv. Manufacturing & Machinery | 22,660 | 0.15 | 4.5 | 23,806 | 0.10 | 3.3 | |
| Agrifood | 13,790 | 0.09 | -35.6 | 32,627 | 0.14 | -25.7 | |
| Automotive | 20,429 | 0.13 | -19.8 | 48,603 | 0.20 | -40.8 | |
| Chemicals | 32,754 | 0.21 | -17.3 | 46,609 | 0.20 | -58.1 | |
| Manufacturing & Electronics | 21,716 | 0.14 | 6.7 | 40,312 | 0.17 | -46.2 | |
| Materials | 35,196 | 0.23 | -11.9 | 36,225 | 0.15 | -33.2 | |
| Textiles | 9,005 | 0.06 | -62.6 | 11,225 | 0.05 | -40.0 | |
| Total | 156,000 | 1 | -14.3 | 239,000 | 1 | -37.9 | |
| The TCA effects are those from the PPML regressions reported in the appendix. In bolds statistically significant effects. For Materials the regression excludes UK exports to Switzerland. The total effects are computed as a weighted average across product groups. | |||||||
A prominent section of the TCA which, understandably, has received much attention is the Rules of Origin protocol.[16] It is important to bear in mind that while trade with the EU under the TCA is, in principle, tariff-free this is conditional on goods satisfying rules of origin. Typically a set of criteria is used to determine the origin of a product and complying with them presents additional costs to firms, which can create trade distortions.[17] It may be too early to see the impact of rules of origin on imports and exports given that firms are not expected to provide proof of origin under an agreed grace period.[18] Nevertheless, firms are likely to be aware that while they may not need to provide the documentation now, they may be asked subsequently to provide it retrospectively. Hence, the requirement to have that proof at some point in the future may well be impacting on trade despite the grace period.
A way of capturing the extent to which UK firms are complying with rules of origin is to assess early data on tariff preference utilization rates—the extent by which tariff preferences provided in trade agreements is utilized – of the UK export to the EU for the first three months.[19] The utilization rate is calculated as the ratio of imports eligible for the preferential zero-rate to imports granted the preference zero rate and the MFN non-zero rate. The tariff-free trade is calculated as the ratio of MFN-zero import and preference zero imports to total trade. The result is reported in Table 5. For the first quarter of 2021, the value of trade which is still paying tariffs is between €2.5 billion and €3.5 billion depending on the processing regimes. There is some uncertainty here because trade under inward and outward processing trade that falls under the MFN non-zero category may end up paying MFN zero depending on what ends up happening to the goods. The monthly figures show that the tariff utilization rates increase from 60% in January to 65% in February and 78% in March.
| Period | MFN Zero | MFN Non-Zero | Preference Zero | Unknown | Utilization rate | Tariff free trade | |
| Q1 2021 | Normal Imports | 7345.2 | 2599.4 | 6942.4 | 1951.2 | 73% | 76% |
| Inward Processing | 135.5 | 877.6 | 8.4 | 0.5 | 1% | 14% | |
| Outward Processing | 34.5 | 7.3 | 0.8 | 0.0 | 10% | 83% | |
| not recorded from customs declaration | 694.6 | 17.7 | 0.2 | 0.0 | 1% | 98% | |
| Monthly | Jan | 2616.3 | 1189.5 | 1754.0 | 740.9 | 60% | 69% |
| Feb | 4104.7 | 1837.3 | 3480.5 | 773.0 | 65% | 74% | |
| March | 1488.7 | 475.2 | 1717.4 | 437.8 | 78% | 78% |
Table 6 shows the preference utilization rates by broad sectors. In the first column of the table we also give the most prevalent rule of origin that is applied in that sectors and in brackets the share of tariff lines for which that rule applied. Hence for Advanced Manufacturing and Machinery, the dominant rule is a choice of either the CTC rule or a minimum domestic value added rule, and this applied to 95% of the tariff line.[20] From this table we see that the textile sector appears have the lowest utilization rate while agrifood has the highest in the first quarter. Once again we have to be very cautious in attributing causality, but the dominant rules of origin requirement for textile sector under TCA is the specific production processes rules, for example requiring both spinning and weaving to have occurred, and such conditions may be difficult for the firms to fulfil.
| sector | Rule of Origin | MFN Zero | MFN Non-Zero | Preference Zero | Unknown | Utilization rate | Tariff free trade |
| Adv.Manufacturing & Machinery | CTC or VA (95%) | 31.5 | 37.5 | 27.0 | 4.0 | 0.42 | 0.58 |
| Agrifood | WO (54%) | 16.8 | 7.3 | 52.9 | 23.1 | 0.88 | 0.70 |
| Automotive | CTC or VA (43%) | 5.8 | 24.4 | 66.0 | 3.7 | 0.73 | 0.72 |
| Chemicals | Comb. of 3 or more (82%) | 33.2 | 12.1 | 42.6 | 12.1 | 0.78 | 0.76 |
| Manufacturing and Electronics | CTC or VA (93%) | 59.2 | 18.5 | 15.7 | 6.6 | 0.46 | 0.75 |
| Materials | CTC or VA (45%) | 68.8 | 6.4 | 19.8 | 5.0 | 0.76 | 0.89 |
| Textiles | Specific processing rule (SP) (66%) | 2.3 | 48.7 | 33.2 | 15.7 | 0.40 | 0.36 |
The first quarter of the TCA has seen as sharp reduction in UK-EU trade. Over the quarter, the TCA is estimated to have reduced UK exports to the EU by 15% and imports by 32% relative to a scenario in which the UK did not leave the EU. The effect has been mainly concentrated in January 2021 with a rebound in the subsequent two months. This is particularly true for exports, while there is some evidence that for imports the impact was more distributed across months. Looking across product groups, we find a negative impact on UK exports of Agrifood, Automotive and Textile, while for imports almost all product groups have been negatively affected.
What can be driving these results? While we do not have the means of testing a particular hypothesis about the mechanism behind the observed changes in aggregate trade, we might have some ideas of where the action is coming from. The abrupt fall of exports in January 2021 and the quick rebound in the following months might be due to an uncertainty shock: new formalities, procedures and border inspections might have led British firms to defer their exports in January to see how things would shape, and then adjust in the following months. On the other hand, the fall in imports is less likely to be related to increased border costs because of the temporary easements applied by British authorities. Re-orientation of supply chain or trade diversion in anticipation of future costs at the UK border might explain the change in imports from the EU. However, with three months of data and considering the vagaries of monthly data, it is still early to provide a comprehensive assessment of the TCA effect. Our exercise provided a formal assessment of what happened in the first two-three months of the TCA. As to why, we will have to wait a bit longer.
PLEASE NOTE: A downloadable version of this paper with higher-quality graphs will be published next week (w/c 31 May).
Read the Appendix to this Briefing Paper
[1] For a briefing of the TCA by the UKTPO, see Taking Stock of the UK-EU Trade and Cooperation Agreement: Trade in Goods.
[2] UK trade agreements with non-EU countries: Gov.uk.
[3] TCA requires an importer who claims preferential treatment to keep records for a minimum of 3 years after the date of importation of the product. An exporter who has made out a statement of origin has to keep the records for 4 years after the statement of origin was made out
[4] Until 31 December 2021, firms may delay declarations to the HMRC for up to 175 days. See: https://www.gov.uk/guidance/delaying-declarations-for-eu-goods-brought-into-great-britain
[5] The UK Global Tariff (UKGT) is the external tariff schedule the UK applies to all imports from countries with which it does not have a preferential trade agreement. For a brief explanation see: New tariff on the block: What is in the UK’s Global Tariff?
[6] See, for example, UK Trade Policy Observatory blog entries for January and February; analysis by Centre for European Reform; or UK in a Changing Europe
[7] Impact of the coronavirus and EU exit on the collection and compilation of UK trade statistics: ons.gov.uk.
[8] Note the ONS typically only compares with the preceding year, eg. comparing January 2021 with January 2020. In our view taking a three year average provides a more robust points of comparison as it minuses the fluctuations which may occur for any given comparator month-year.
[9] The HMRC and ONS trade data for goods provides slightly different figures. ONS collects trade based on Balance of Payments (BOP) basis while HMRC collects on customs declaration basis. The BOP approach records trade when there is change of ownership, thus if trade moves between borders but remains in the same ownership, ONS does not count it but HMRC does.
[10] Based on total trade, these are: China, France, Germany, Ireland, Italy, the Netherlands, Poland, Spain, Sweden and the USA.
[11] Imports from China were approximately 50% higher in the first quarter of 2021.
[12] The countries are Australia, Brazil, Switzerland, Chile, China, Colombia, Israel, India, Iceland, South Korea, Mexico, Norway, New Zealand, Russia, Turkey, the US and South Africa.
[13] The results reported in the text are those of the DD estimated with the PPML estimator. The pre-TCA periods considered are the months of Jan-Mar 2017-20 while the post-TCA period is Jan-Mar 2021. See the appendix for details.
[14] For the SCM, ‘significance’ is based on p-values from permutation tests and therefore not directly comparable to the regression p-values.
[15] It is reassuring to find that the total effects computed as weighted average across groups are very close to the results obtained for total trade.
[16] ANNEX ORIG-2: PRODUCT SPECIFIC RULES OF ORIGIN in EU-UK TCA;
[17] For detailed information about the rules of origin under TCA, see https://blogs.sussex.ac.uk/uktpo/publications/taking-stock-of-the-uk-eu-trade-and-cooperation-agreement-trade-in-goods/
[18] Currently only 3.9% of firms are using the rules of origin for lower tariff rate. https://www.ons.gov.uk/businessindustryandtrade/internationaltrade/articles/theimpactsofeuexitandthecoronavirusonuktradeingoods/2021-05-25
[19] The import preference utilization rate for March is only from 8 countries—Czech Republic, Estonia, Spain, France, Germany, Ireland, Lithuania, and Portugal
[20] For an explanation, see UKTPO Briefing Paper 52: https://blogs.sussex.ac.uk/uktpo/files/2021/01/Briefing-paper-52.pdf