Introduction: Brexit and ACP countries
Do ACP countries’ incomes depend significantly on UK-EU trade?
Cocoa, Brexit and Rules of Origin
Scholars have long argued that Brexit will have implications for the African, Caribbean and Pacific (ACP) countries (Razzaque et al. 2016; Kennan, 2016).[1] This Briefing Paper asks how much they have to fear from the expected shallowness, or even total absence of, a UK-EU Free Trade Agreement (FTA) from 1st January 2021. They obviously face a loss of sales in the UK if the consequences of Brexit for UK incomes are even half as bad as predicted by commentators, including the UK Government in November 2018 (HM Government, 2018). However, there are also potentially indirect effects as increased trade frictions between the UK and the EU may disrupt value chains of which the ACP are part. This in turn depends in part on the rules of origin that may govern UK-EU trade, which forms part of our analysis.
UK-ACP trade relations are currently governed by the Economic Partnership Agreements (EPAs) – the reciprocal regional FTAs – negotiated by the EU. These are organised into seven regional groups of countries and grant ACP countries duty-free and quota-free (DFQF) market access into the EU for all goods except arms and ammunition.[2] The UK is seeking to replicate this market access to post-Brexit Britain, although to date the task has not yet been completed.[3] Table 1 describes the Economic Partnership Agreements and the UK’s progress in replicating them.
Even where they have signed so-called Continuity Trade Agreements with the UK, the ACP countries will face additional competition in the UK market because the Government has reduced UK tariffs on other countries (Winters et al., 2020). They will also face additional barriers on UK-EU trade: either, ‘No deal’ will mean that the UK and EU levy tariffs on goods from each other, or a UK-EU FTA will keep tariffs at zero but have rules of origin that govern access to the zero rate. In addition, of course, there will be added documentary compliance and border delays (Byrne and Rice, 2018).
| Region | EU Status/UK Replicationa | ACP Parties |
| The CARIFORUM – EU EPA was signed in October 2008 and approved by the European Parliament in March 2009.
UK replicated |
CARIFORUM member states are: Antigua and Barbuda, The Bahamas, Barbados, Belize, Cuba, Dominica, Dominican Republic, Grenada, Guyana, Haiti, Jamaica, St. Kitts and Nevis, Saint Lucia, St. Vincent and the Grenadines, Suriname and Trinidad and Tobago. | |
| Pacific Islands | Provisional implementation of Interim Partnership Agreement by Papua New Guinea and Fiji. Samoa acceded to the EPA in December 2018 and Solomon Islands in May 2020.
UK replicated |
Cook Islands, Fiji, Kiribati, the Marshall Islands, Micronesia, Nauru, Niue, Palau, Papua New Guinea, Samoa, the Solomon Islands, Tonga, Tuvalu and Vanuatu |
| West Africa | Signing process underway; EPAs with Côte d’Ivoire and Ghana provisionally applied.
UK Not replicated |
Economic Community of West African States (ECOWAS) member states (i.e. Benin, Burkina Faso, Cape Verde, Côte d’Ivoire, The Gambia, Ghana, Guinea, Guinea Bissau, Liberia, Mali, Niger, Nigeria, Senegal, Sierra Leone and Togo) and Mauritania |
| Central Africa | Provisional application by Cameroon; ongoing negotiations with the other parties
UK replicated for Cameroon |
Cameroon, Central African Republic, Chad, Congo, Democratic Republic of Congo, Equatorial Guinea, Gabon, São Tomé and Príncipe |
| Eastern and Southern Africa (ESA) | Provisional implementation by Madagascar, Mauritius, Seychelles, Zimbabwe; ongoing negotiations with the other parties
UK replicated |
Comoros, Djibouti, Eritrea, Ethiopia, Madagascar, Malawi, Mauritius, Seychelles, Sudan, Zambia and Zimbabwe |
| East African Community (EAC) | Kenya and Rwanda signed the EPA in September 2016, and Kenya has ratified it. For the EPA to enter into force, the remaining EAC members need to sign and ratify the agreement.
UK not replicated |
Burundi, Kenya, Rwanda, Tanzania, Uganda and South Sudan. |
| Southern African Development Community (SADC) | Ratified by all SACU members; provisional implementation for SACU; provisional application for Mozambique
UK replicated |
Southern African Customs Union (SACU) member states (i.e. Botswana, Lesotho, Namibia, South Africa, Swaziland) and Mozambique. Angola has an option to join the agreement in the future |
| a/ Trading conditions largely, if not precisely, rolled over.
Source: Authors’ summary (December 2019) |
||
Rules of origin for a UK-EU FTA are not yet agreed, of course. The UK has proposed that any inputs purchased from developing countries should be eligible for cumulation (i.e. be treated as if they were from the UK in determining that a final good has UK origin),[4] whereas the EU has remained silent on rules of origin in its proposed draft treaty. Moreover, even if ACP countries do receive cumulation, there is still no guarantee that any UK export that they are supplying inputs for will meet all the other conditions for duty-free access to the EU.
This Briefing Paper considers two aspects of the impact of UK-EU trade relations on the ACP countries. Part 2 asks how much of the ACP countries’ GDP is generated by exports to the UK and how much of this is then traded with the EU. Part 3 considers whether rules of origin will disrupt trade in one specific sector that has been of concern to scholars – chocolate. It turns out that neither presents a major problem.
Whether the additional frictions on UK-EU trade matter significantly to ACP countries depends ultimately on the economic importance of the ACP value added embedded in UK exports to the EU and EU exports to the UK. Value-added is the value that is added to purchased inputs to create a product of value – e.g. processing, manufacturing, branding, etc. It is what creates incomes for the factors of production – labour, capital – that provide it. GDP is the sum of the domestic value added across the whole economy. In this section we use linked Input-Output Tables for 55 countries[5] to identify the ACP value-added in UK exports to the EU and EU exports to the UK, and thus provide a first assessment of such “indirect” costs of Brexit on ACP economies.
Our results show that the economic damage that ACP countries might suffer from Brexit as a disrupter of their indirect trade with the EU is tiny. Although the ACPs’ domestic content embedded in UK exports to the EU is never zero and there is some degree of heterogeneity across countries and industries, there is little effect in aggregate. A straightforward implication is that it is not worth spending much time or effort on preserving or protecting the ACP countries’ indirect links to the EU.
A caveat to this preliminary analysis is related to the high degree of aggregation of the EORA sectors. Thus while the overall effect on the proportion of ACP exports being impacted by Brexit will be small, there could be significant and disproportionate consequences for specific sectors that are heavily reliant on the UK market (Mendez-Parra et al., 2016) or on exports to the EU via the UK. Unfortunately, value added trade data are not broadly available at higher levels of disaggregation, so short of specific case studies – like that in Part 3 – we cannot offer more detail.
The recent availability of Multi-Region Input-Output (MRIO) tables combined with bilateral trade statistics allows us to allocate the value-added embedded in trade flows to the countries and sectors of origin and destination. Specifically, we use here the EORA database[6] that provides a balanced global MRIO for 186 countries and 25 harmonized sectors in the period 1990-2015 (Lenzen et al., 2012; 2013).[7] We focus our analysis on the primary and secondary sectors, leaving services aside because of their inherently different nature and because of doubts about some of the data.
We use a method devised by Borin and Mancini (2016, 2019) to decompose ACP countries’ gross exports into domestic and foreign components. The domestic content (DC) of exports is the sum of the domestic value-added (value added in the ACP country that is then exported in final or intermediate goods); the foreign content (FC) the sum of the foreign value-added (value-added embedded in intermediate inputs the ACP country imports from abroad and then exported in the form of final or intermediate goods).[8]
Borin and Mancini’s approach allows us to decompose ACP gross exports, disentangling the share of domestic content embedded in exports directly absorbed by the UK (or EU) from that which is embedded in exports that are then exported to third or final markets (see Figure 1).[9]
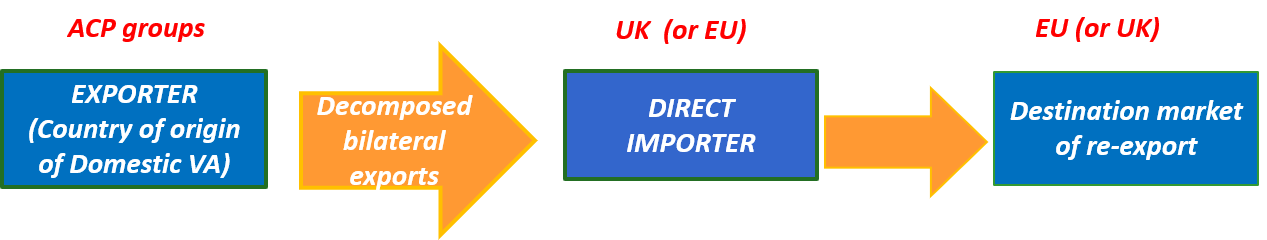
Table 2 shows that the UK market is important for ACP countries, whereas this is not the case vice versa. Although there is a significant variation across regional groups, according to the most recently available data (2015), the UK takes about 9% of the East Africa Community’s total exports and about 8% for the Eastern and South Africa Group’s. Conversely, the ACP groups’ shares of total UK imports are always less than 1%. Table 2 also shows that the value-added embodied in ACP gross exports to the UK is primarily domestic: the share is generally above 80% and above 90% in the case of West and Central Africa. Trade flows to the UK are important in economic terms for the Southern African Development Community (SADC) (1.24% of its overall GDP) and for Eastern and Southern Africa (1.85%); much less so for Central Africa (0.12%) and the Caribbean (0.15%).
| ACP GROUPS | GROSS EXPORTS TO THE UK | DOMESTIC CONTENT | |||
| (millions $) | (% of total exports) | (% of UK total imports) | (% of gross exports to the UK) | (% of ACP groups GDP) | |
| SADC | 8252.00 | 6.31 | 0.99 | 85.28 | 1.24 |
| West Africa | 1206.18 | 2.28 | 0.25 | 92.34 | 0.22 |
| Central Africa | 150.70 | 0.91 | 0.06 | 90.83 | 0.12 |
| ESA (*) | 981.09 | 7.71 | 0.08 | 68.72 | 1.85 |
| EAC | 639.60 | 9.06 | 0.08 | 87.70 | 0.63 |
| Carribean | 663.25 | 2.22 | 0.09 | 79.28 | 0.15 |
| Pacific | 242.48 | 3.46 | 0.03 | 86.63 | 0.86 |
Source: Authors’ elaboration on EORA data
* Ethiopia, Sudan and Zimbabwe are not included due to some inconsistencies in the EORA data.
As usual, regional figures hide a good deal of heterogeneity. For example, 0.05% of Angola’s exports go to the UK, while 9.4% of Kenya’s do (although strictly the latter is not an EPA member). However, except for Lesotho, the percentage of the domestic content embedded in the exports directed to the UK market is never below 75% for all ACP countries. Moreover, in some cases, the domestic value-added exported to the UK is quite important in economic terms (about 1% of the overall GDP in Malawi and Kenya and 0.5% for Madagascar).
Table A1 in the Appendix[10] reports the domestic content of ACP exports to the UK by sector. It ranges from a minimum of 37% (“Other Manufacturing” in ESA) to a maximum of 97% (“Agriculture” in West Africa). On average, the largest domestic content (over 86%) is registered in West Africa and the smallest in East and South Africa (60%). And the range is even larger at the country level. This heterogeneity is likely attributable to structural differences in the geographical characteristics of these economies. The high domestic content embedded in exports towards the UK is a further sign of the likely exposure of ACP incomes to the forecast decline of the UK GDP induced by Brexit.
As stated above, ACP countries are also vulnerable to Brexit impacts via the so-called indirect effects, namely ACP exports that use the UK as a platform to access the EU market (and the EU as a platform to access the UK market). To assess this, we examine the trade in value added data to track the ACP domestic content embedded in the bilateral trade flows between the UK and the EU. This provides information about where the value-added of the UK-EU trade originates and thus the possibility that third countries (including ACPs) could pay, indirectly, some of the cost of Brexit.
Table 3 shows – for each EPA group of ACP countries – the domestic content embedded in their exports towards the UK that is then further re-exported to the EU market, expressed as a percentage of the ACP sectoral gross exports to the UK. These percentages are of course low in comparison with those of the ACP domestic content exported to the UK (see Table A1), though they are not trifling. However, the fact that they are never higher than 23% shows that the bulk of the ACP-UK trade is primarily oriented towards the UK market rather than using it as a platform to reach the larger EU market. As usual, we should acknowledge the presence of some degree of heterogeneity by sector and EPA group. The highest percentages of domestic content entering indirectly to the EU market via the UK are for raw materials such as: “Metal products”, “Mining and Quarrying”, “Petroleum, Chemicals and Mineral Products” followed by “Wood and Paper”. The percentage of domestic content entering the EU via the UK ranges from 0.96% for textiles and wearing apparel from East and South Africa to 23.35% of metal products from the Carribean.
| Sector | SADC | West Africa | Central Africa | East and South Africa | East African Community | Carribean | Pacific |
| Agriculture | 11.21 | 11.04 | 15.20 | 10.72 | 10.47 | 10.65 | 11.30 |
| Fishing | 11.24 | 13.14 | 12.90 | 12.78 | 13.43 | 13.73 | 13.89 |
| Mining and Quarrying | 13.51 | 17.97 | 14.58 | 14.57 | 17.24 | 13.95 | 13.64 |
| Food & Beverages | 4.07 | 4.55 | 13.95 | 9.44 | 3.83 | 8.73 | 11.77 |
| Textiles and Wearing Apparel | 9.09 | 8.24 | 13.56 | 0.96 | 18.53 | 4.02 | 4.92 |
| Wood and Paper | 12.61 | 12.44 | 12.41 | – | 11.92 | 12.61 | 12.87 |
| Petroleum, Chemical and Non-Metallic Mineral Products | 15.06 | 21.55 | 15.00 | – | 8.70 | 11.44 | 14.29 |
| Metal Products | 23.02 | 19.85 | 21.67 | – | 12.77 | 23.35 | 11.11 |
| Electrical and Machinery | 9.03 | 10.28 | 10.66 | – | 9.65 | 16.38 | 12.82 |
| Transport Equipment | 8.00 | 14.08 | 15.15 | – | 11.28 | 8.58 | 12.50 |
| Other Manufacturing | 2.44 | 4.30 | 9.26 | – | 1.90 | 5.22 | 0.00 |
| Average | 10.84 | 12.49 | 14.03 | 9.69 | 10.89 | 11.69 | 10.83 |
Source: Authors’ elaboration on EORA data
We can derive a more granular picture by looking at the same figures for our selected countries. Table A2 in the Appendix shows the domestic content exported to the UK and finally absorbed by the EU. Specifically, it reports, for each country, its monetary value (in millions $ and expressed as a percentage of exports to the UK and as a percentage of GDP). This allows us to provide a first assessment of the economic importance of these flows for the ACP partners. Although the ACP domestic content embedded in UK exports to the EU market is never zero, the reported percentages in terms of each country’s GDPs confirm that these “indirect costs” of Brexit are indeed very low (the highest share is 0.06% of GDP in the case of agriculture in Kenya).
Further information can be derived looking at the second indirect channel, that is the EU as a platform for supplying the UK market. Table A3 reports these figures by sector showing that the UK final absorption of the ACP’s domestic content through the EU market is low as well: for instance, the highest contribution of ACP countries to EU-UK bilateral trade flows is 7% of the ACP group’s gross exports to the EU in the case of Agriculture from the East African Community and the average contribution is below 4%.
Table 4 summarizes the exposure of each ACP group to the indirect costs of Brexit by computing the sum of the domestic content embedded in the bilateral export flows to the UK and the EU further re-exported to them as a percentage of their sectoral value added. The final row (Average) shows that only between 0.002% and 0.008% of GDP in the ACP groups is generated by the flows of goods between the UK and the EU. Even it were all lost to Brexit – which is unlikely – these “indirect costs” appear to be distinctly bearable.
| Sector | SADC | West Africa | Central Africa | East and South Africa | East African Community | Carribean | Pacific |
| Agriculture | 0.007 | 0.015 | 0.009 | 0.014 | 0.008 | 0.005 | 0.011 |
| Fishing | 0.008 | 0.002 | 0.000 | 0.002 | 0.001 | 0.000 | 0.000 |
| Mining and Quarrying | 0.015 | 0.021 | 0.017 | 0.002 | 0.001 | 0.000 | 0.007 |
| Food & Beverages | 0.003 | 0.008 | 0.002 | 0.027 | 0.007 | 0.005 | 0.017 |
| Textiles and Wearing Apparel | 0.003 | 0.003 | 0.000 | 0.010 | 0.003 | 0.000 | 0.001 |
| Wood and Paper | 0.004 | 0.009 | 0.020 | – | 0.001 | 0.001 | 0.001 |
| Petroleum, Chemical and Non-Metallic Mineral Products | 0.008 | 0.002 | 0.000 | – | 0.000 | 0.001 | 0.000 |
| Metal Products | 0.029 | 0.001 | 0.003 | – | 0.001 | 0.005 | 0.000 |
| Electrical and Machinery | 0.003 | 0.001 | 0.000 | – | 0.001 | 0.001 | 0.001 |
| Transport Equipment | 0.003 | 0.001 | 0.000 | – | 0.001 | 0.000 | 0.000 |
| Other Manufacturing | 0.002 | 0.000 | 0.000 | – | 0.000 | 0.000 | 0.000 |
| Average | 0.008 | 0.006 | 0.005 | – | 0.002 | 0.002 | 0.004 |
Source: Authors’ elaboration on EORA data
This section focusses on rules of origin (RoOs). If the UK and the EU do reach a ‘deal’ for January 2021 onwards, it will involve preferential trade and, therefore, rules of origin. As noted above, the rules of origin discussion has not started, let alone concluded, but one fear expressed has been that some of the products into which ACP countries have significant input may not meet rules of origin sufficiently to permit the continuation of the current duty-free trade between the UK and the EU. One such product is chocolate, or more specifically the cocoa trade between developing countries, the UK and the EU, and the role that rules of origin might play in disrupting it.[11]
The cocoa market represents a good case study because of its trade structure. The major exporters of cocoa beans to the EU (and to the world) are Cote d’Ivoire and Ghana. As producers of the raw material, these two countries will always be part of the cocoa trade. The EU is currently a large market for cocoa, and if intra-EU trade is substantial, post-Brexit rules of origin could create serious impediments and thus have an adverse effect on the exporters of the raw material.
Because future EU-UK rules of origin are unknown, we consider those from the Pan-Euro-Mediterranean (PEM) conventions, the ones used most frequently in the EU’s trade agreements with countries in the European neighbourhood.[12] The EU developed the PEM system to harmonise RoOs across these partners, so, given the rush to complete a UK-EU agreement this year, it seems plausible, and the UKTPO recommends, that a EU-UK FTA should adopt them.[13]
The RoOs from the Pan-Euro-Mediterranean (PEM) convention for HS chapter 18 (Cocoa and cocoa preparations) state that, in order to qualify as originating, the working and processing carried out on non-originating material would confer originating status in case of:
“manufacture
Hence, working and processing must lead to a change in product heading after manufacturing and non-originating sugar (Chapter 17) must not exceed 30% of the ex-works price. We consider each of there conditions in turn.
The provision states that a manufactured product must result in a different heading from the original one to be considered originating. For instance, if a country imports non-originating cocoa beans (HS 1801) and processes them into cocoa butter (HS 1804) the resulting cocoa butter obtains origination and can be exported duty-free, if it is included in the FTA. On the other hand, if the imported cocoa beans are re-exported without any change in their heading they will be subject to tariffs even within the FTA.[14] Table 5 below reports the HS headings for cocoa and the EU MFN tariff and UK Global Tariff rates.
| HS code | Description | EU MFN | UK Global Tariff |
| 1801 | Cocoa beans, whole or broken, raw or roasted | 0.0 | 0.0 |
| 1802 | Cocoa shells, husks, skins and other cocoa waste | 0.0 | 0.0 |
| 1803 | Cocoa paste, whether or not defatted | 9.6 | 8.0 |
| 1804 | Cocoa butter, fat and oil | 7.7 | 6.0 |
| 1805 | Cocoa powder, not containing added sugar or other sweetening matter | 8.0 | 0.0 |
| 1806 | Chocolate and other food preparations containing cocoa | 23.3 | 11.1 |
| Tariff data source: UKTPO calculation based on DIT data. | |||
Therefore, rules of origin will matter in a post-Brexit scenario if intra-EU re-exports of cocoa are substantial. Using trade data from COMTRADE[15], Table 6 shows exports of HS Chapter 18 by Cote d’Ivoire and Ghana (the two main exporters) to the EU and to the UK by heading. Their exports are strongly concentrated in cocoa beans (1801), the raw product, followed by 1803 (cocoa paste) and 1804 (cocoa butter, fat and oil).[16] Exports of HS 1806 (chocolate and other food preparations containing cocoa), the most finished product, are almost zero.
| Product | Cote d’Ivoire | Ghana | |||||||||
| EU | UK | EU | UK | ||||||||
| US$m | % of HS 18 | US$m | % of HS 18 | US$m | % of HS18 | US$m | % of HS 18 | ||||
| 1801 | 2,124 | 64 | 113 | 51 | 876 | 73 | 57 | 72 | |||
| 1802 | 120 | 4 | 0 | 3 | 0 | 0 | |||||
| 1803 | 526 | 16 | 14 | 6 | 137 | 11 | 11 | 14 | |||
| 1804 | 402 | 12 | 96 | 43 | 147 | 12 | 11 | 14 | |||
| 1805 | 46 | 1 | 0 | 27 | 2 | 0 | 0 | ||||
| 1806 | 106 | 3 | 0 | 10 | 1 | 0 | 0 | ||||
| Data source: UN COMTRADE and authors’ calculation. | |||||||||||
The next question, then, is what HS 18 headings does the UK trade with the EU? The answer is HS 1806: for both UK exports and imports, 89% of HS 18 trade with the EU occurs in this heading, followed by HS 1804, which accounts for 6% of imports and 8% of exports.
From this initial screening it appears that the way cocoa trade works in the EU is to import raw materials from developing countries, manufacture at home and then export chocolate and other finished products to other EU countries, with little trade in intermediates. Re-export does not seem to be large within the EU, so post-Brexit RoO-compliance should not be a major issue.
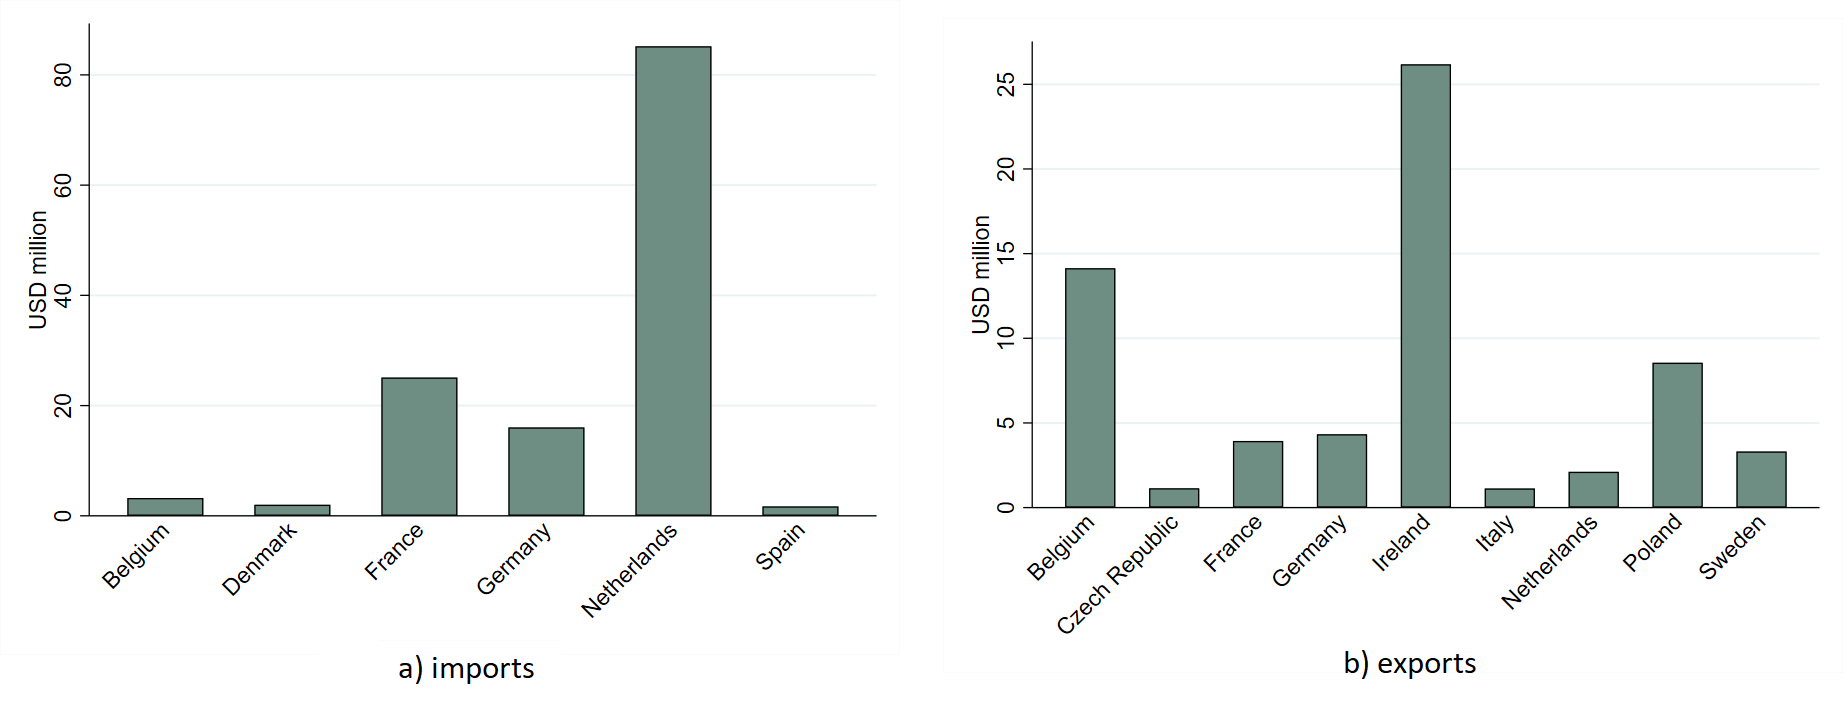
To see this in more detail, consider UK trade in HS 1804, which is small but not zero. Figure 2 shows flows of UK imports and exports with EU countries exceeding $1 million. Imports are concentrated on a few countries, of which the Netherlands is the largest, followed by France and Germany. Exports, on the other hand, are largely directed towards Ireland, Belgium and Poland.
To have a rough idea of whether the Netherlands is just re-exporting cocoa butter (HS 1804) to the UK, we can look at its trade flows of this product. Recall that re-export cannot exceed the minimum of imports and exports of that product. (If a country imports 100 and exports 20, at most it re-exports 20. Similarly, if it imports 20 and exports 100, the maximum possible re-export is 20). Over 2012-18, the Netherlands exported to the UK $158m on average, while total imports were about $444m. Hence, if all Netherlands’ exports to the UK were re-exports, this is at most $158m.[17] For the UK, total imports over the same period are $270m, while exports to the EU are $1,600m, meaning that at most re-exports to the EU from UK are $270m. Although these figures are not very large, a substantial share of imports of HS 1804 – both for the UK and for the Netherlands – come from Cote d’Ivoire and Ghana (40% for UK and 55% for the Netherlands), suggesting that some re-exports of products originating in these countries might occur.
Data source: UN COMTRADE
We should also consider whether there are re-exports of raw cocoa beans – HS 1801- because this is where the main trade lies, and according to the CBI, the Netherlands has the largest cocoa port in the world (Amsterdam). [18] The same source, however, reports that the Netherlands also has a large cocoa-processing industry. To have a rough idea of how many of the cocoa beans imported by the Netherlands are re-exported, we can approximate domestic absorption using data on grinding done in the Netherlands. Our data on grinding are very approximate, but they show that the Netherlands grinds slightly more than 500 thousand tonnes of cocoa beans per year. Using this estimate, the volume of cocoa beans re-exported by the Netherlands can be approximated as imports less grindings and the UK share of this by the UK’s share in the Netherlands’ total exports.[19] To do the calculation, we consider average values 2012-14 in order to match the grinding data. This results in an estimate of 560 tonnes of coffee beans re-exported to the UK. To convert this to value terms we use the average value per tonne of the Netherland’s total exports of HS 1801 – $3/tonne over 2012-15 – which implies a monetary value of re-exports to UK of $1,680.
Using other estimates of grinding volumes (also from the CBI, but from a different original source), the Netherlands ground about 430 thousand tonnes of cocoa beans in 2014. Redoing the calculation without changing other data we get an estimated re-export of cocoa beans to UK of $2,520.
After looking at trade flows and considering the rough estimates of re-exports of cocoa beans within the EU, it appears that RoOs for cocoa will not represent an issue in the post-Brexit trade between the UK, the EU and the ACP countries. Most of the ACP-EU trade is in cocoa beans. These are then processed, and intra-EU trade occurs mainly in final products, which are deemed originating. Thus, the damage that Brexit-related disruptions to UK-EU trade in cocoa products could do to ACP countries’ cocoa producers appears to be small.
Identifying whether sugar content will be an issue or not for RoOs is more difficult. If we look at chocolate sold in the UK, sugar content varies greatly. For instance, Montezuma’s Absolute Black 100% has less than 5% of sugar content (by weight), while a Cadbury Wispa chocolate bar is more than 50% sugar.
Trade data from Eurostat at CN8 provides some disaggregation of chocolate trade (1806) indicating the sugar content, but it may not be comprehensive. For instance, for cocoa powder (1806 10) we have:
| 1806 10 15 | Containing no sucrose or containing less than 5 % by weight of sucrose (including invert sugar expressed as sucrose) or isoglucose expressed as sucrose |
| 1806 10 20 | Containing 5 % or more but less than 65 % by weight of sucrose (including invert sugar expressed as sucrose) or isoglucose expressed as sucrose |
| 1806 10 30 | Containing 65 % or more but less than 80 % by weight of sucrose (including invert sugar expressed as sucrose) or isoglucose expressed as sucros |
| 1806 10 90 | Containing 80 % or more by weight of sucrose (including invert sugar expressed as sucrose) or isoglucose expressed as sucrose |
Unfortunately, however, we do not have a disaggregation of other products by sugar content. Thus, for example, chocolate bars filled with cereal, fruits or nuts (1806 32 10) might well contain sugar above 30% of its value.
The Food and Drink Federation (FDF) reports that the average sugar content in chocolate confectionary weighted by sales volumes is 54.6%.[20] We reviewed 32 UK-produced chocolate products which are sold in Tesco and Sainsbury’s through Google shopping and found an average content of sugar of 40.7% – not weighted by sales volume. The two numbers are not too far apart, and probably reflect the fact that more expensive chocolate has lower sugar content than cheap chocolate and is sold in lower volumes.
We also browsed the sugar commodity price[21] and found an average of $0.15/pound from 2014 to date, equivalent to $0.33/kg, equivalent to £0.23/kg at the average exchange rate of the period. Using information on chocolate prices and sugar content that we gathered online we estimated the value of the sugar content in finished chocolate products. On average, UK-produced chocolate has 40.7g/100g of sugar, worth £0.0093 representing 0.8% of the chocolate’s value.
However, here we are not considering the retailer mark-up, and the fact that the producer will probably face a price higher than the commodity price. Browsing the web again, the price of a kilo of sugar in supermarkets is about £1/kg. Assuming a 50% mark-up of retailers on both chocolate and sugar, we have the price of chocolate at £0.55/100g and £0.05/100g for sugar. Then, the value of sugar in 100g of chocolate is 47g * 0.0005 £/g = £0.0235 which is 4.3% of the chocolate price. Hence, rough though this calculation is, we estimate that we are thus very far from the 30% value threshold.
As reported by CAOBISCO, the Association of Chocolate, Biscuit and Confectionery Industries of Europe, the EU is changing its rules of origin with respect to sugar content in its new trade agreements.[22]
The EU is changing the sugar content from a value basis to a weight basis for the non-originating content of sugar in chocolate. As the cost of sugar is very low, chocolate products are well below the 30% threshold on a value basis, but on a weight basis they are well above. Thus this proposed change has substantial implications for the chocolate trade, as the industry’s concerns show. CAOBISCO reports that 80% of its members’ production (HS 1704 – sugar confectionary including white chocolate – and 1806) has more than 40% of sugar by weight.
The EU-Canada trade agreement partly applies the weight principle. For HS 1806, the agreement requires either that the net weight of non-originating sugar to not exceed 40%, or that the value of non-originating sugar does not exceed the 30% of the ex-work price. Hence, in this case producers are left with the freedom to choose the criterion they want to apply. However, note that in this agreement there is also a requirement that non-originating dairy products (HS Ch. 4) cannot exceed 20% of net weight.
On the other hand, the EU-Singapore FTA is more stringent: here the limit is defined exclusively in terms of weight, and the threshold is 20% for sugar and diary products individually, and, in an apparent redundancy, a maximum of 40% combined.
Note that these thresholds are defined not on total sugar content, but only on non-originating sugar. With respect to the UK, AB Sugar[23], a sugar businesses association, reports that 50% of British sugar demand in aggregate is satisfied from domestic beet sugar and that 25% is imported from the EU, which suggests that the remaining non-originating 25% would lie within the acceptable bounds. However, the industry’s concerns suggest that, in contrast with AB Sugar’s numbers, the content of non-originating sugar in confectionary might be high, and that switching to originating sugar would be expensive. Furthermore, confectionery producers seem to use a blend of beet and cane sugar. The latter is not produced in the EU,[24] and so might represent an issue in terms of origination.[25] Moreover, as Politico.eu, an online newspaper, reports, a major cost of complying with such new regulations would be keeping track of the origin of the various sugars used in production, with the associated bureaucracy.[26]
This section suggests that the rules of origin are not likely to create problems, post-Brexit, for the use of ACP inputs in EU and UK cocoa products. However, our analysis is fairly aggregated and approximate and a complete assessment must depend on precise information that only the industry itself can provide.
Exports from developing countries in general and from the ACP countries in particular will be hit by Brexit as the UK economy fails to generate the growth in demand that only a few years ago seemed a reasonable expectation. However, through two quite independent exercises – one using aggregate data on international trade and inter-industry flows and the other on a detailed analysis of one sector – suggest that they will not suffer seriously from an “indirect” loss of trade. That is, the disruption of trade between the EU and the UK which will follow either a ‘No Deal’ exit or a simple FTA will cause only the smallest disruption to the use of inputs from ACP countries in the UK and the EU. And in the event of an FTA, the rules of origin which determine the right of UK-EU trade flows to take advantage of zero tariffs will not disrupt trade in cocoa products.
No losses for developing countries are desirable, but at least in these two cases they are light enough to be bearable, and developing country negotiators and UK policymakers should devote their attention to other matters, at least until very specific cases of potential harm are brought to their attention.
Please see the Appendix and References for this paper.
[1] References for this paper available at: http://blogs.sussex.ac.uk/uktpo/files/2020/09/BP48-REFERENCES.pdf
[2] The same treatment is offered by the EU to Least-Developed Countries (LDCs) through the Everything-but-Arms (EBA) scheme.
[3] https://www.gov.uk/guidance/uk-trade-agreements-with-non-eu-countries#trade-agreements-from-1-january-2021
[4] Section 2 of the UK’s draft negotiating document, although there are some conditions, see Holmes et al (2020).
[5] These come from the EORA dataset (https://worldmrio.com/) and cover South Africa, Angola, Namibia, Lesotho, Botswana, Swaziland, Mozambique, Sierra leone, Gambia, Ghana, Nigeria, Senegal, Benin, Ivory Coast, Togo, Guinea, Cape verde, Mali, Mauritaina, Niger, Burkina Faso, Liberia, Congo, Gabon, Cameroon, Democratic Republic of the Congo, Central Africa Republic, Ciad, Sao Tome and Principe, Seychelles, Malawi, Mauritius, Eritrea, Djibouti, Madagascar, Kenya, Tanzania, Uganda, Burundi, Ruwanda, Guyana, Barbados, Trinidad and Tobago, Antigua and Barbuda, Belize, Jamaica, Suriname, Dominican Reublic, Haiti, Bahamas, Paupa New Guinea, Fiji, Vanuatu, Samoa.
[6] The use of EORA database is the only option to look at the issue for a comprehensive set of ACP countries so far. None of the other similar sources such as the Asian IO tables (IDE‑Jetro), the GTAP project, the OECD-WTO TiVA initiative and the WIOD project has the same extension in terms of country coverage and the same level of detail for end-use categories for our investigated countries.
[7] Because of the presence of some inconsistencies in the Eora data (such as negative value added components of total trade) Ethiopia, Sudan and Zimbabwe are not included in the analysis.
[8] In addition, there also is a small amount of so-called ‘double counted’ value added in each block where a good is exported as an intermediate, processed abroad, re-imported and then exported again in another good.
[9] To this end, we used the icio STATA code (Belotti et al., 2020).
[10] Available online at http://blogs.sussex.ac.uk/uktpo/files/2020/09/BP48APPENDIX.pdf
[11] See: https://epamonitoring.net/potential-brexit-related-chocolate-trade-disruptions-highlighted-in-industry-submission-to-parliament/ and http://data.parliament.uk/writtenevidence/committeeevidence.svc/evidencedocument/business-energy-and-industrial-strategy-committee/leaving-the-eu-implications-for-the-processed-food-and-drink-industry/written/72831.pdf
[12] https://eur-lex.europa.eu/legal-content/EN/TXT/?uri=LEGISSUM%3Arx0014
[13] Briefing Paper 45: https://blogs.sussex.ac.uk/uktpo/publications/were-going-to-make-them-an-offer-they-can-refuse-rules-of-origin-and-the-uk-eu-free-trade-agreement/
[14] Note that here re-export means that good is imported by a first country into its customs territory and then exported to another, without undergoing sufficient working and processing to change its tariff heading.
[15] Data refer to Gross Exports, including Re-Exports. COMTRADE records a good as re-exported if it did not acquire origination through processing. Values for these measures are small: the UK re-exported $64m and re-imported $16m, the majority of which in HS 1806, that does not come from developing countries. The main destinations for British re-exports are Canada ($14m) and the US ($11m). Definition of re-exports: https://unstats.un.org/unsd/tradekb/Knowledgebase/Reexports-and-Reimports.
[16] The reason why UK imports of 1804 are high is probably related to the cosmetics sector, which uses cocoa butter as an intermediate.
[17] COMTRADE data have large discrepancies between imports and exports. Data show UK imports from NHL of HS 1804 to be $85m, while NHL exports to UK for the same product are almost double at $158m.
[18] https://www.cbi.eu/sites/default/files/market_information/researches/trade-statistics-europe-cocoa-2016.pdf
[19] More precisely, the Netherlands re-exports to the UK are calculated as (IM_(NHL,WLD)-Gr_NHL )*X_(NHL,UK)/X_(NHL,WLD), where Netherlands imports (IM_(NHL,WLD)-Gr_NHL) minus grinding represents the excess of imports over national absorption, and this is multiplied by the share of Netherlands exports (X) to UK of total Netherlands exports.
[20] See https://www.fdf.org.uk/corporate_pubs/Sugars-Reduction-in-Chocolate-Confectionery.pdf
[21] Source https://www.macrotrends.net/2537/sugar-prices-historical-chart-data Data are the same in Nasdaq but I could not download them.
[22] http://caobisco.eu/caobisco-chocolate-biscuits-confectionery-europe-page-68-Rules-of-origin-in-Free-Trade-Agreements.html#.XQDZ7YhKiUk and
[23] https://www.absugar.com/sugar-markets/uk-sugar-sector
[24] https://www.cbi.eu/market-information/honey-sweeteners/raw-cane-sugar
[25] Tate & Lyle Sugar’s written evidence to the House of Commons BEIS 7th report of session 2017-19 argues that cane sugar content might be problematic for establishing origination. See http://data.parliament.uk/writtenevidence/committeeevidence.svc/evidencedocument/business-energy-and-industrial-strategy-committee/leaving-the-eu-implications-for-the-processed-food-and-drink-industry/written/72831.pdf
[26] https://www.politico.eu/article/choc-horror-eu-candy-makers-say-japan-deal-not-so-sweet/