The problem of carbon transfers and leakage in the UK context
Focus, assumptions & policy scenarios
The UK’s own ETS after Brexit – how does it work?
Identifying UK industries at risk of carbon leakage
Potential implications of a UK BCA and the EU’s CBAM
In this Briefing Paper, we seek to address the possible implications of a ‘border carbon adjustment’ (BCA) mechanism for the UK. The idea of introducing a BCA has been raised by various countries and major trading partners of the UK, most notably the EU, with its Carbon Border Adjustment Mechanism[1] under which it is committed to introducing a CBAM in 2023.[2] Here we assess the potential risks of what is referred to as ‘carbon leakage’ – the outsourcing of emissions by incentivizing CO2 intensive activities in other countries – which could arise from the UK’s carbon pricing through its Emissions Trading Scheme (ETS). We also examine the likely impact of the introduction of a unilateral UK BCA on specific industries and consider implications of cooperation with the EU on ETS schemes and BCAs. Finally, we seek to address the pros and cons to the UK of applying such a new type of policy tool and for the triple goals of maintaining trade, investment and job stability in the UK, and with trading partners, and the extent to which it might counter the problem of carbon leakage. In the UKTPO Briefing Paper 56[3], we examined issues of BCA design and WTO compatibility, which are not discussed further here.
The national accounting of CO2 emissions is normally based on territorial production and does not include the emissions embedded in the total consumption of a country. But this focus on production emissions, which is set out in both the Paris Agreement and the UK’s flagship Climate Change Act (2008, 2019), tends to underestimate the overall emissions associated with a given country as these will depend both on emissions in production but also by the emissions resulting from a country’s consumption patterns. Focusing on production does not take into account the fact that many countries import more carbon-intensive products than they export (Ritchie[4] defines this as carbon transfers).
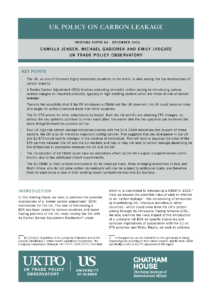
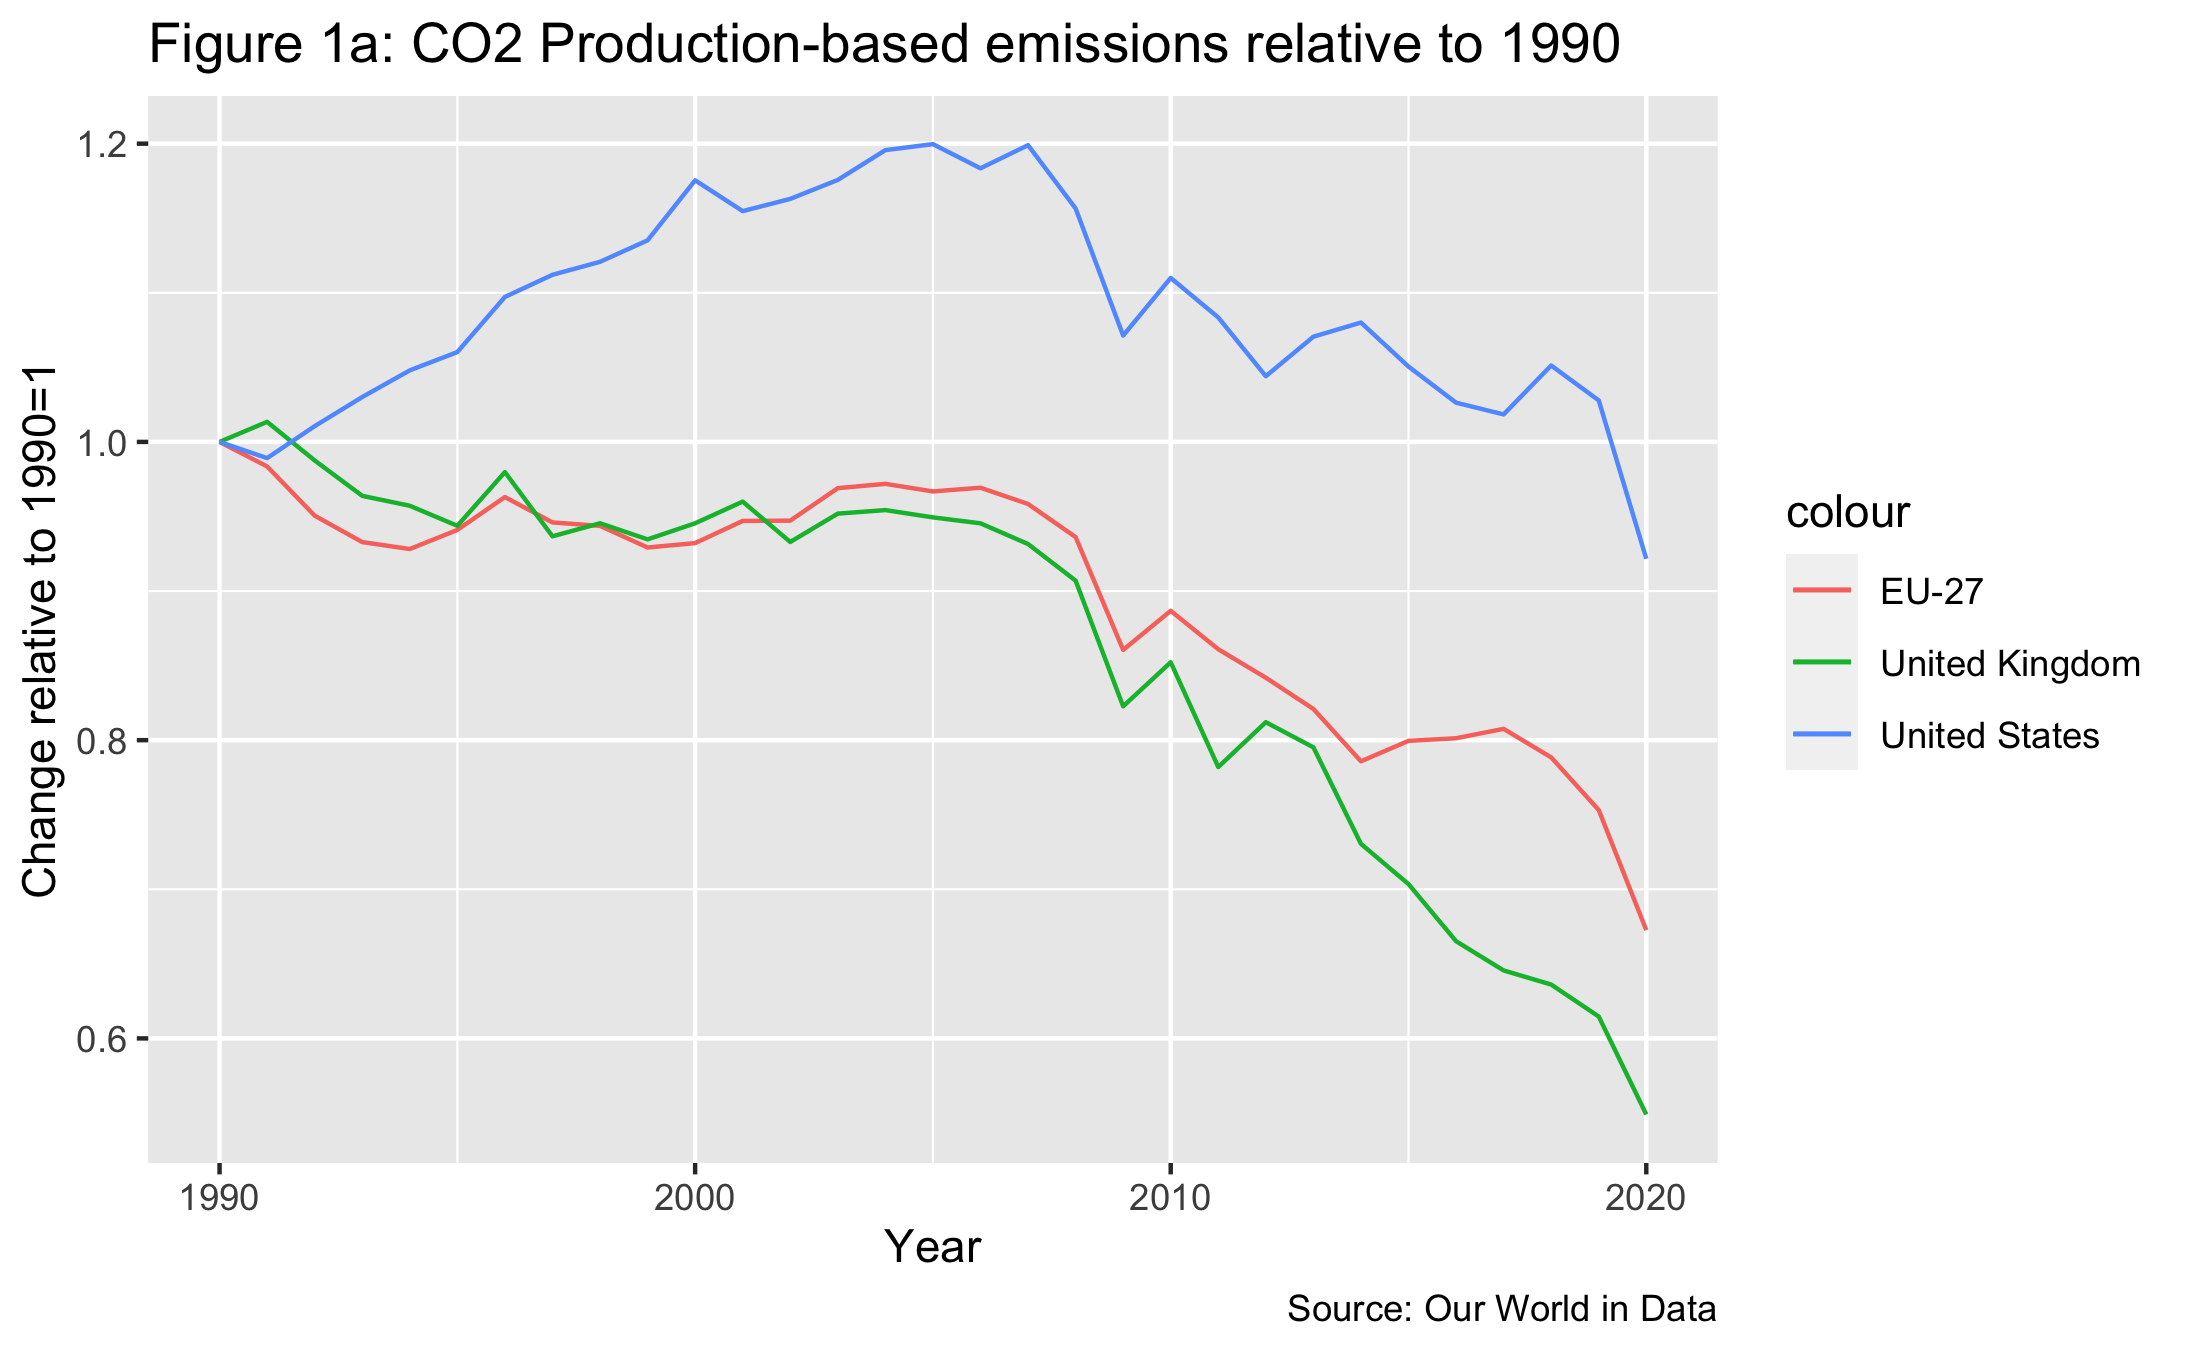
Consider the first graph – Figure 1a. It depicts the changes in the carbon emissions in production over time for the UK, the US and the EU. This shows a decline in all three cases and with a more pronounced decline for the UK. Over this time period (not shown), there has also been a decline in the UK’s consumption emissions[5] (and thus carbon transfers), but these have fallen at a slower rate. This can be seen in the second graph – Figure 1b – which shows that the share of consumption emissions relative to production emissions shows a rise over time. In comparison this has not been the case, at least since 2006 for the EU or the US. Note too, that the level of consumption emissions to production emissions is lower for China and the US than for the UK and the EU. In good part this is to be expected because both the US and China are significantly less open economies, as measured by the share of trade in GDP (at 35% and 26% respectively) than the UK (63%) or the EU.[6]
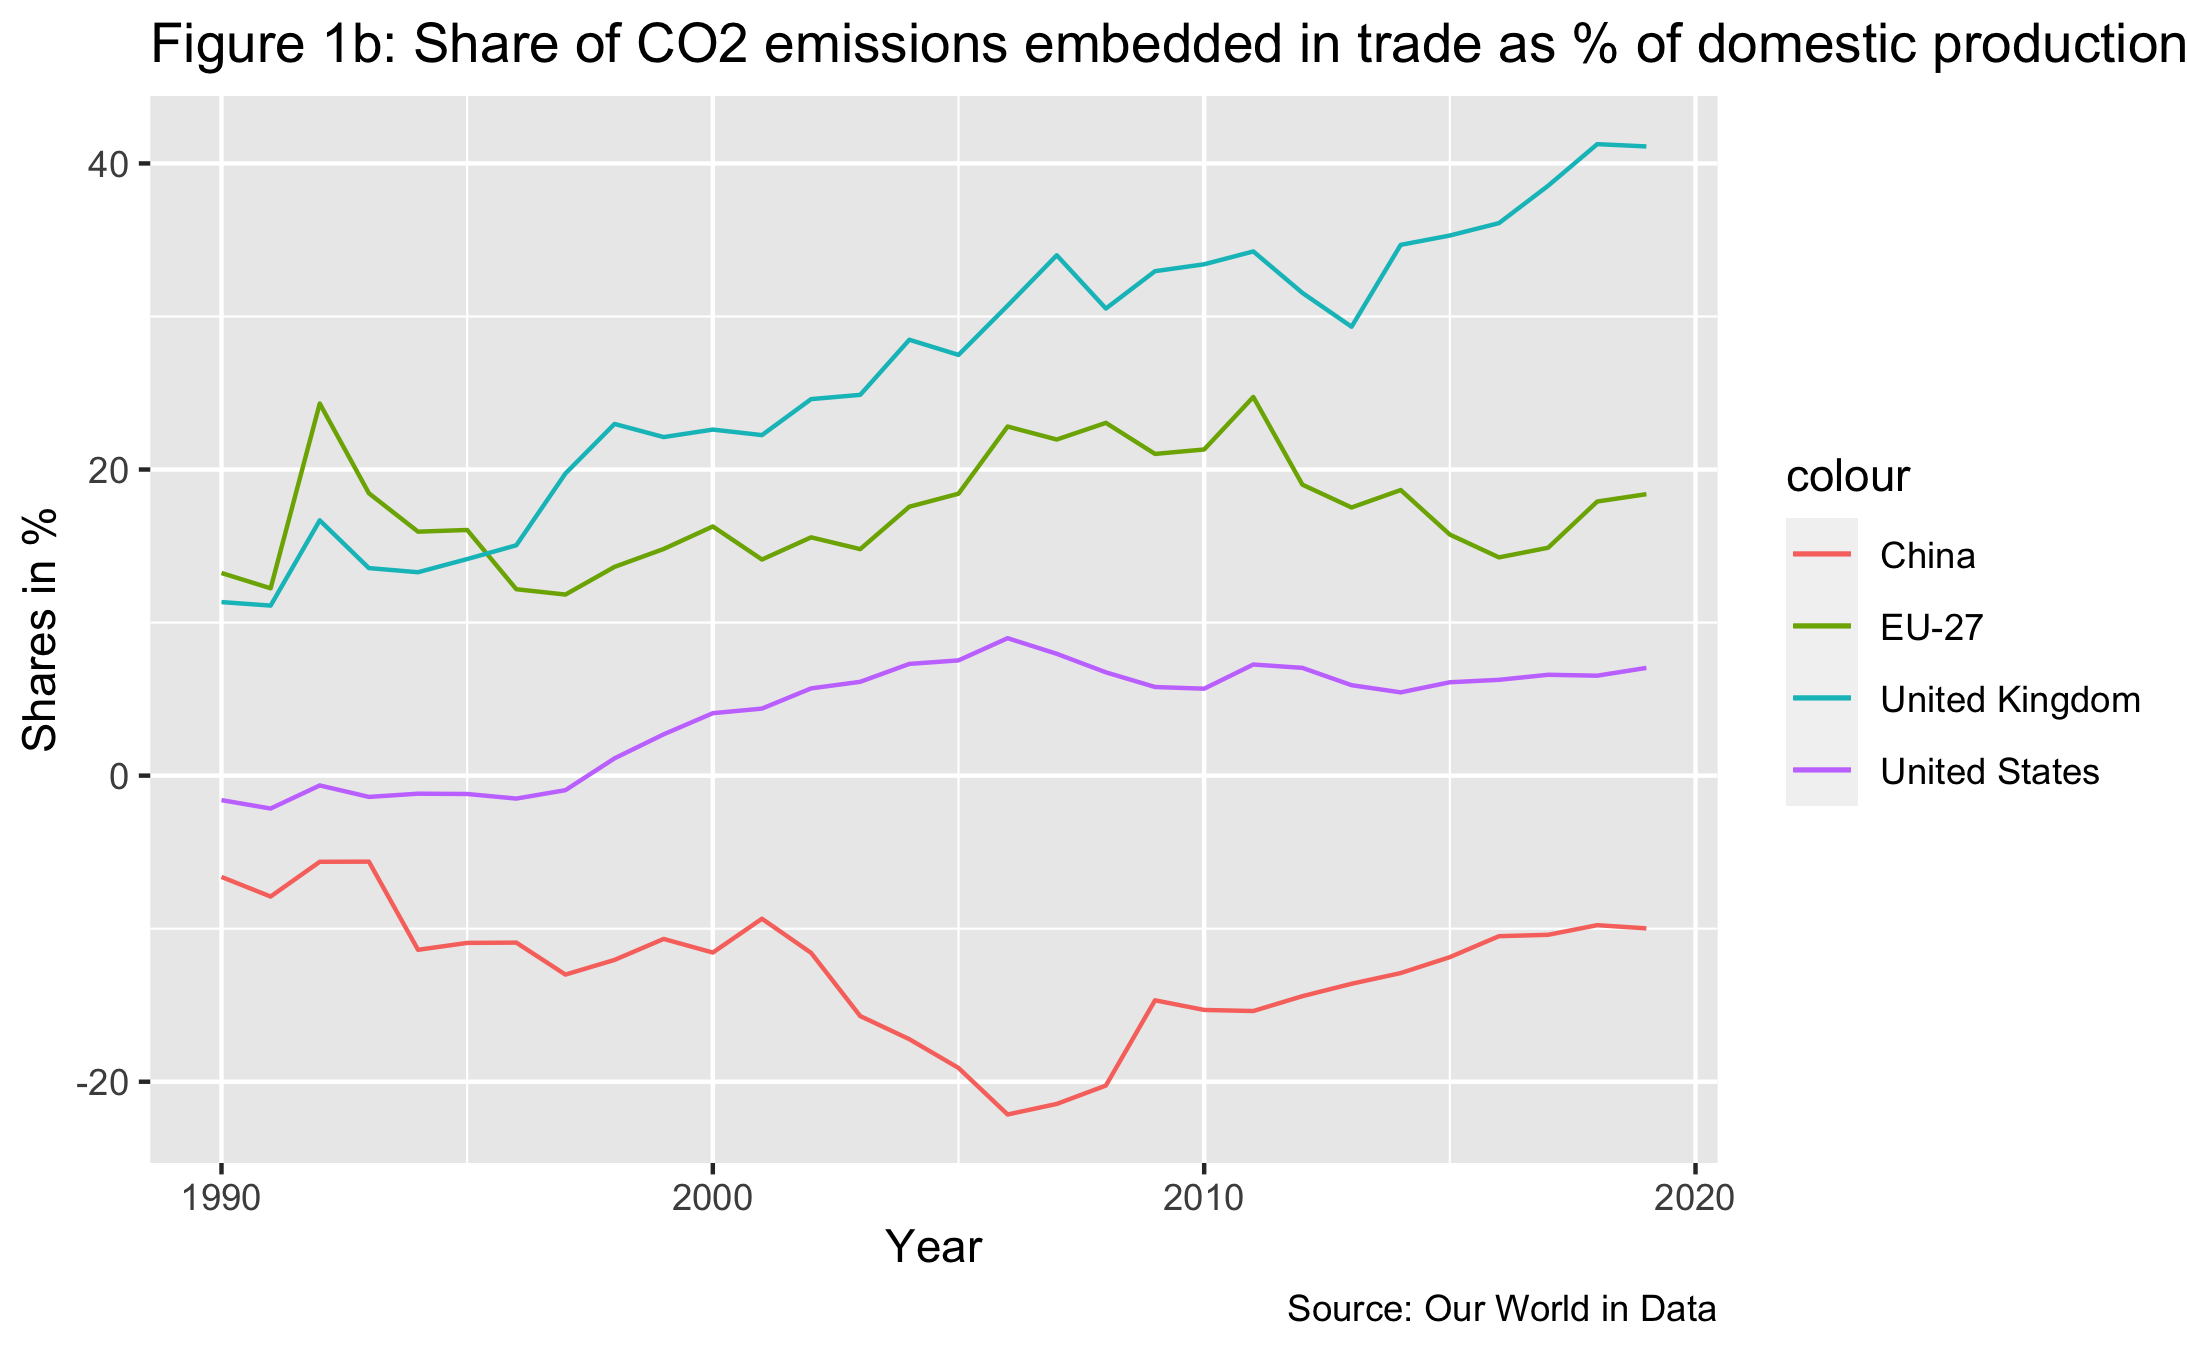
Indeed, the UK is one of the top destinations of net carbon imports as a share of domestic production emissions. Together with several other countries in Northern Europe, the UK is classified in the red zone[7] with emissions transfers (net-imports) standing at 42.1% imported as a percentage of total domestic production emissions, only exceeded by a few other countries in the world such as Sweden, Tanzania and Uruguay – all three topping the ranking with carbon transfers at or above 60% (see also Figure 1c taken from the Our World in Data open data project). Relatedly the Office for National Statistics[8] concluded that the UK has the biggest carbon footprint per capita in the G7.
The changes in net imports of CO2 emissions over time are closely associated with carbon leakage. As the UK, along with other highly developed countries introduce higher carbon prices, this may result in carbon-intensive production switching to countries that do not tax carbon emissions. In turn, this may result in the UK importing those more carbon-intensive products leading to an increase in emissions and carbon transfers. Such transfers shift production to other countries without reducing the actual CO2 intensity of consumption patterns inside the UK economy.
A Border Carbon Adjustment involves extending domestic carbon pricing by introducing carbon-related charges on imported products, typically in high emitting sectors which then become those at risk of carbon leakage. A BCA reduces the incentives for leakage, while also raising revenue which could be used to support the transition to a more sustainable economy. BCAs can help to raise funds to compensate the losers from the green transition, such as those employed in the traditional fossil fuel-intensive industries, and incentivise innovations towards greener production in countries exporting to the UK. Many countries oppose BCAs as protectionist policies possibly in breach of WTO rules.[9]
In the EU and the UK, domestic carbon pricing is largely undertaken via an emissions trading scheme (ETS), which we discuss in more detail below by examining:
This analysis is based on the assumption that the CBAM as proposed by the EU in its most recent implementation plan for the Green Deal – the ‘Fit for 55’ document and the Commission’s proposed legal text [10],[11] – will be introduced. Given that the UK has also introduced carbon pricing via an ETS scheme, we suggest that it is unlikely the UK would become a pollution or emissions haven[12]. However, there is the possibility that if the EU introduces a CBAM and the UK does not, that the UK could become a target of carbon-intensive trade from third countries as trade is diverted away from the EU and into other markets, including that of the UK. The possibility of such trade diversion could introduce an additional incentive for the UK to introduce a BCA in the same sectors as the EU if it wants to prevent any CBAM induced leakage into the UK.
The UK ETS came into place on January 1, 2021, effectively replacing the UK’s participation in the EU ETS.[13] Not surprisingly, the policy aims to reduce emissions, and it is worth a brief explanation of the principle behind the ETS.
To reduce emissions efficiently suggests that the policy should incentivise those firms that can reduce emissions at the lowest cost to do so. Under a ‘cap and trade’ system (eg. the ETS) the amount of emissions in any given industry is limited (this is the cap). Firms are given an initial allocation of permits which gives them the right to pollute up to the amount of the permits. In order to reduce overall emissions, these permits need to be set at a level that is lower than firms’ current emissions levels. Firms can buy additional permits either from other firms or via an auction where additional permits can be bought.
Firms are thus required either to reduce (abate) their emissions or to purchase additional permits from other firms or via auction, which then allows them to continue emitting. A firm where the costs of abatement are high will be more likely to want to buy permits (so long as the cost of the permit is less than the cost of abatement). A firm where the costs of abatement are low will be more likely to want to sell their permits (so long as the value of the permit is greater than their costs of abatement). Hence the firm that is less efficient at reducing emissions, buys permits from firms that are more efficient at abatement. Thus, emissions are reduced by the firms that are most efficient at abatement. This is the idea behind the ETS and indirectly helps to signal the correct price on CO2 emissions at any particular point in time (i.e. on the margin – how costly is it really for the ‘last’ polluter to clean up?).
The UK ETS covers energy-intensive industries. These are defined as those with a thermal input exceeding 20MW annually, which could thus cover a wide range of industries, as well as the power generating sector and the aviation industry (only currently involving flights within Europe)[14]. The ETS aims at regulating the amount of emissions by industries located and producing within the UK, and also to regulate how emissions develop over time.
ETS permit prices rise or fall based on both demand-side and supply-side factors. On the demand-side, as businesses become more effective and less CO2 intensive over time, the price of the tradeable permits will tend to fall. Alternatively, prices may fall due to reduced demand to emit; for example, the EU ETS price collapsed following the economic contraction of the Great Recession in 2008. To counterbalance these demand-side factors, governments can ‘tighten’ the cap by reducing the number of tradeable allowances in market circulation. The reduction in free credits will drive up the price because it will increase the demand in the tradeable parts of the permits market.
The ETS is based both on elements of volition (because as firms improve their energy efficiency over time free allocations will be reduced) and economic incentives, such as taxing emissions and thereby setting a price on carbon through the tradeable parts of the permit market. When setting the cap (i.e. the amount of tradeable permits issued for trading in the market for CO2 permits), the EU (and now) the UK both allocate ‘free’[15] emissions permits to industries which are seen to be the highest emitters. This was done during the initial phases (I-IV) of the EU ETS system, but with the consequential risk of carbon leakage. This is the problem that the imposition of the CBAM aims to address. In the absence of the CBAM there is more risk that there will continue to be too many free allocations which prevent the carbon price from increasing sufficiently to make it reflect the real socical cost of carbon emissions. With the introduction of taxing CO2-intensive products on the EU border, free allocations can be removed without incurring the potential danger of carbon leakage arising from the ETS. In turn, this, therefore, implies that the industries with the most free allocations are the industries that are also at highest risk of carbon leakage. In fact, the latter criteria (high risk of carbon leakage) was the basis for awarding them in the first place.
ETS market dynamics have been well tested in the EU, which corrected the overallocation of free allowances in the early phases of the ETS[16] through the introduction of a market stability reserve and the steady reduction of free allocations over time[17], now resulting in record-high EU ETS prices. In the UK, price dynamics are more uncertain as the scheme is so new.
The UK’s decision to leave the EU did not necessarily mean that the UK had to depart from the EU ETS scheme. The EU ETS allows for other schemes to be linked, such that permits from both systems can be bought for compliance purposes, as long as compatibility criteria are met[18]. The UK’s ETS takes the EU ETS as its starting point, and thus clearly meets these conditions. However, given the UK’s desire for regulatory autonomy from the EU, perhaps combined with its historical leadership in carbon markets and its role as one of the main architects behind the EU ETS, it is perhaps not surprising that the UK has formulated a near-identical, but its own national version of the ETS.[19]
ETS cooperation will no doubt form part of an ongoing dialogue between the EU and UK. Indeed, the EU-UK Trade and Cooperation Agreement (TCA) states that the Parties ‘shall give serious consideration to linking their respective carbon pricing systems…’ (EU-UK TCA, Title IX, Article 392(6)), and the relationship between these systems is subject to negotiation through the joint Trade Specialised Committee on the Level Playing Field. Both the UK and EU are planning future ETS changes, so unless the two systems continue to mirror each other, the earlier that the two systems can be linked the more straightforward the process will be.
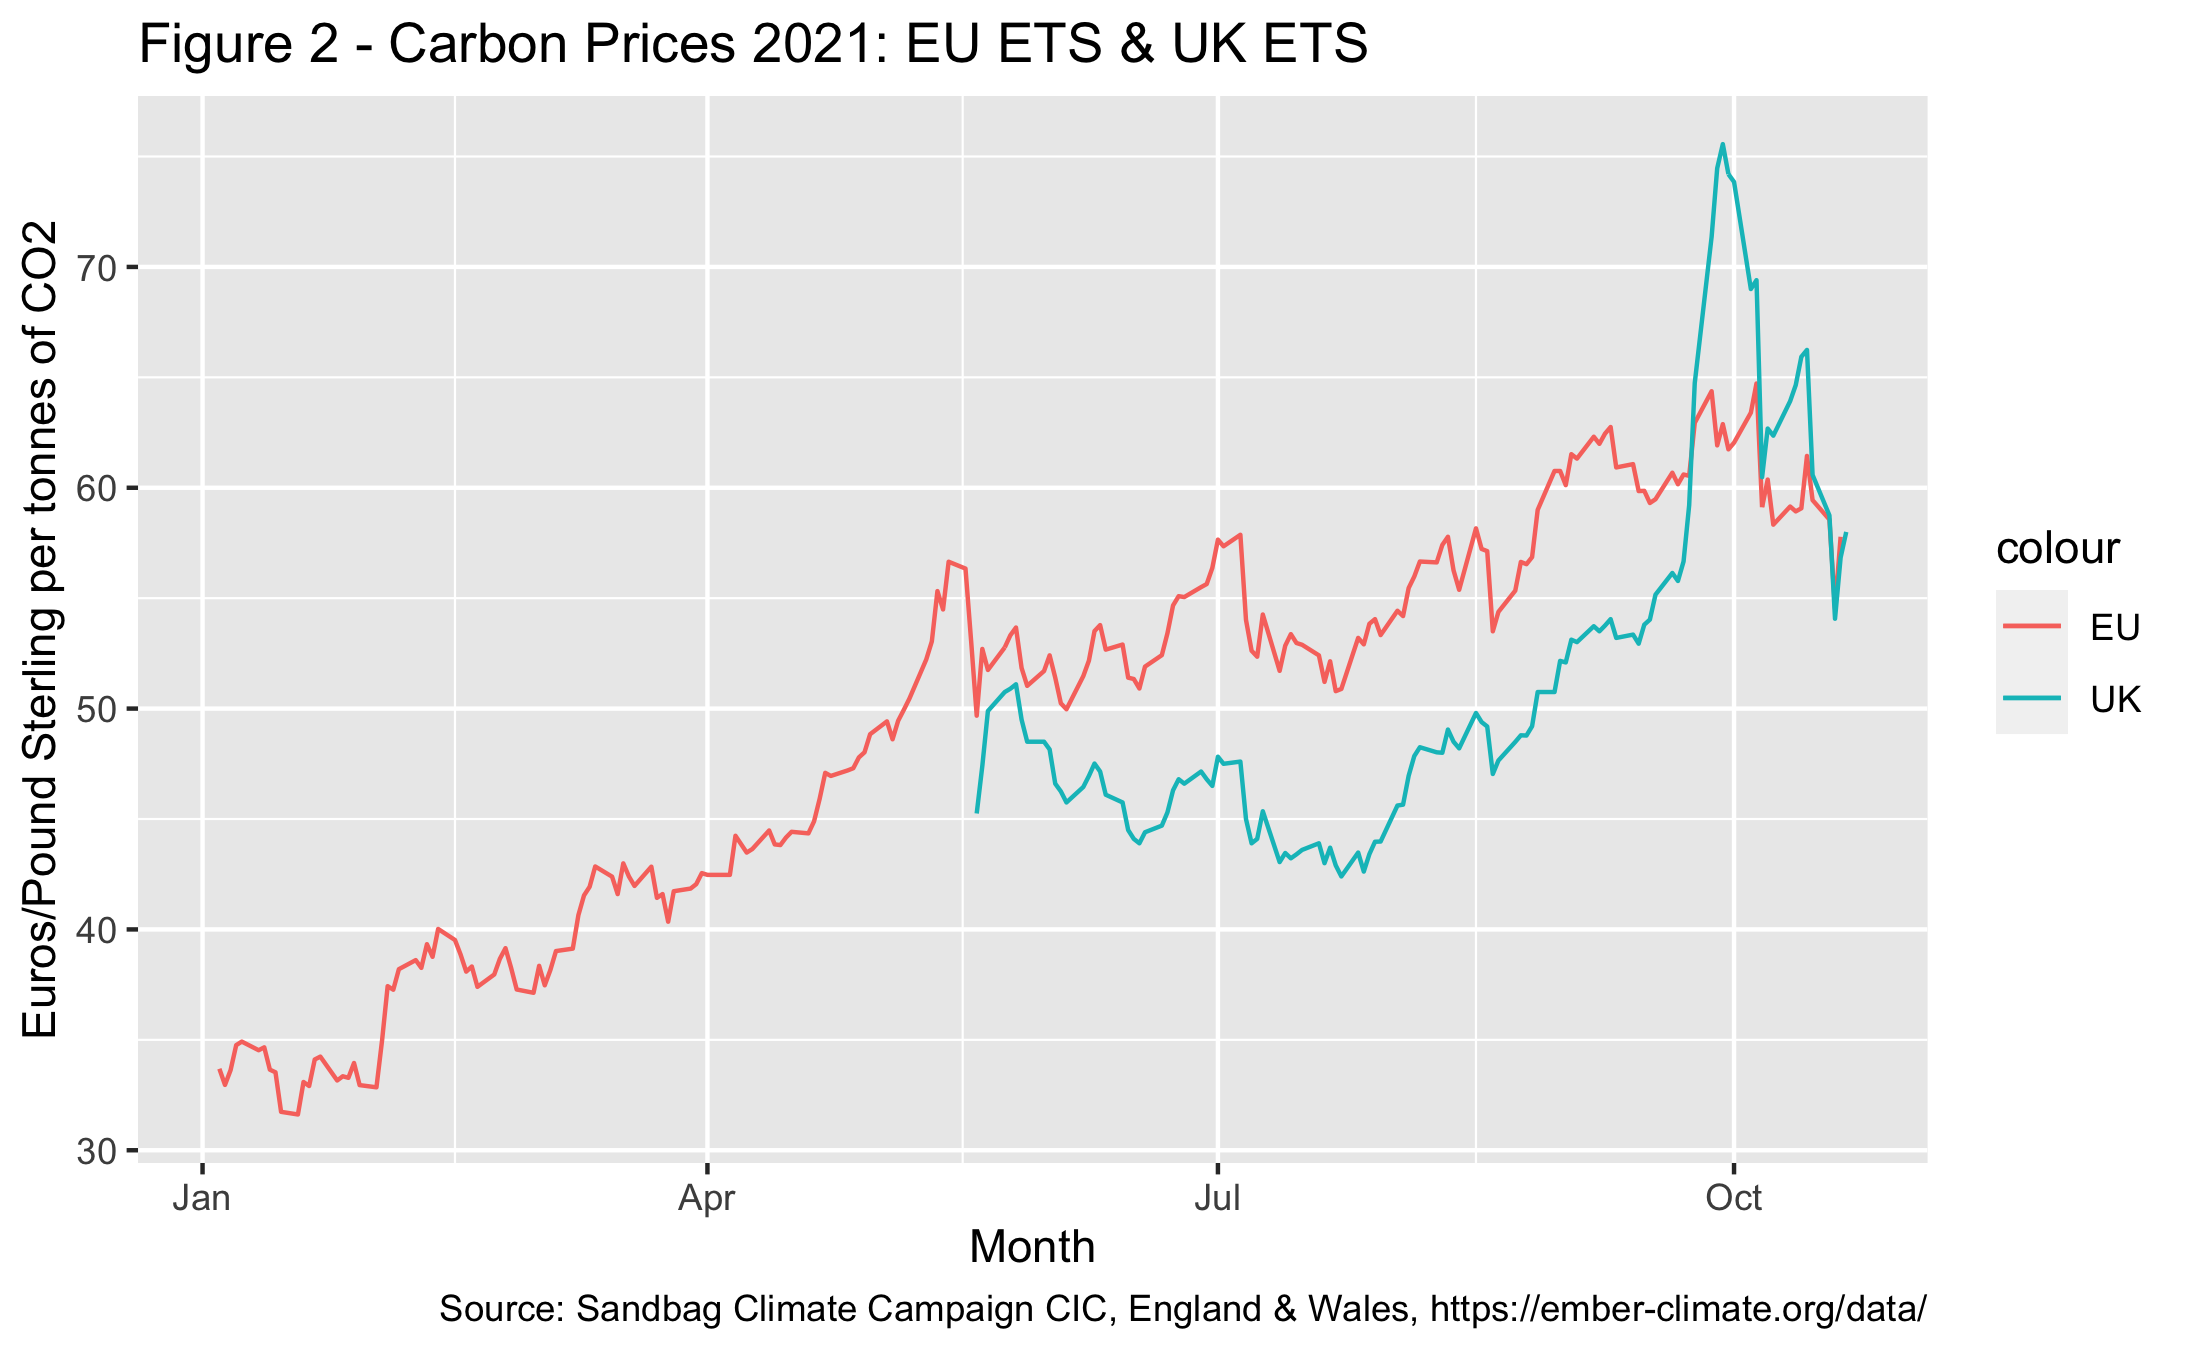
Figure 2 shows (albeit on the basis of a short trading history starting only on May 19th, 2021), that the two carbon markets appear to be integrated. For example, the CO2 prices in Euros and Pound Sterling follow a similar trend over time. This may be because many of the firms that participate in the ETS and are therefore involved through their trading activities in determining the prices in these two carbon market may typically be present in both trading environments as they are often multinational firms. For example, UK plants on the EU side of their operations would be able to buy permits in the UK and transfer those emissions permits either directly or indirectly (i.e. by shifting the carbon intensive production activities) to apply to their operations in the EU or vice versa.
Discussion on a formal ETS linkage between the EU and UK is important for another reason. The Commission’s current proposal states that only countries with linked ETS schemes can be exempt from the CBAM on a country basis [20]. Given that ETS prices are more or less the same at the moment, it is likely that the most significant element of linking the ETS schemes would be that UK firms exporting to the EU would be exempt from the technical requirements for compliance, which is significant. Otherwise, firms exporting products to which the EU’s CBAM applies, require pre-approval to export, by calculating their embedded emissions utilising the EU’s approved methodology, and these calculations are also to be subjected to third-party verification. If carbon prices diverge, and EU prices are higher, UK exporters will also need to make up the difference by buying and surrendering shadow ETS permits[21]. Thus, even though UK firms may in practice not be subject to the CBAM (because of the UK’s ETS scheme), they will nevertheless have to provide all the necessary documentation to be exempt from paying the additional price on carbon due to the CBAM. The administrative burden and related cost on UK businesses may become very significant.
In principle, any industry could become part of the UK’s ETS (if it has a thermal input exceeding 20 MW annually). Some industries are more likely to be at risk of carbon leakage than others, because of the way they are regulated under the ETS. We assume that the industries at risk of carbon leakage are best identified by focusing on the parts of the UK market covered by the ETS sector and currently in receipt of free emissions allocations. Were the UK to increase its CO2 prices it would in part need to be through the gradual removal of these free allocations, thereby placing the holders of those allocations at the largest risk of being incentivised to transfer their activities to less regulated countries with lower carbon prices.
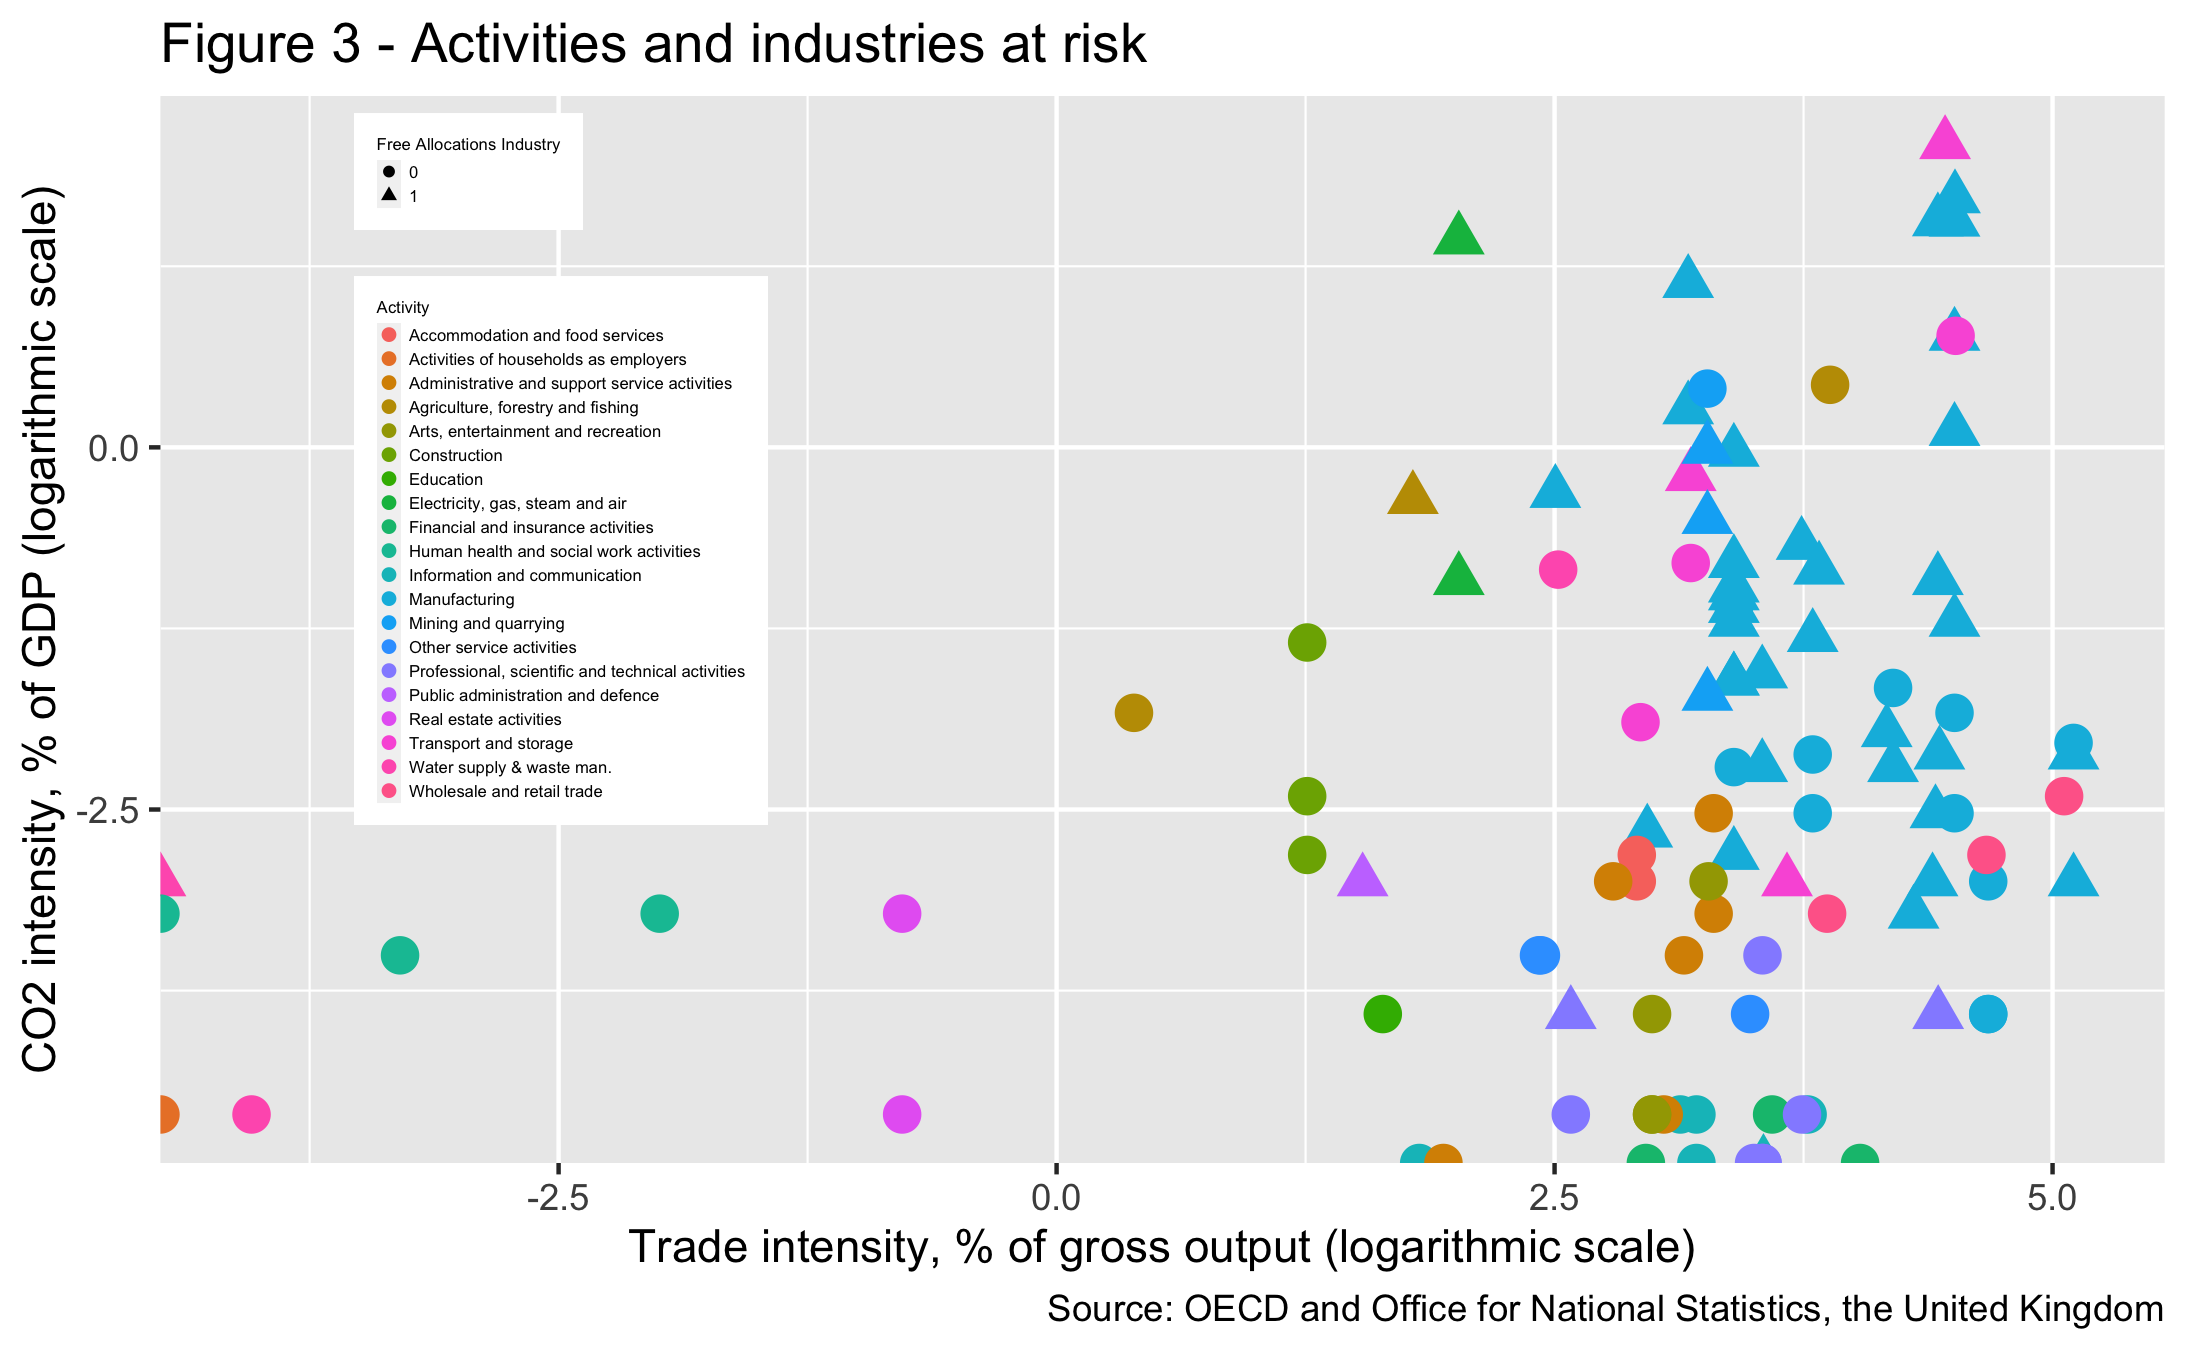
In order to identify the UK industries at highest risk of carbon leakage, we have used the UK list of 462 installations (i.e. plants) that have been given free allocations to emit CO2 under the current UK ETS Scheme (Figure 3)[22]. For each of these firms we have identified the industry they are in via their SIC code.[23] This list shows that the list of industries impacted by the UK’s ETS scheme is quite broad, however, and as seen in Figure 3, most of the industries under the UK ETS are in manufacturing as well as energy production.
As well as identifying the industries with free allocations, it is more likely that carbon leakage will occur in more tradeable industries by definition of the concept itself (i.e. trade is the vehicle of the leakage). Hence, out of the industries with free allocations, we chose the minimum threshold of a potential leakage problem where imports as a share of output are greater than 5% (or in logarithms at the 1.5 cut-off point on the x-axis in Figure 3).
Based on this longer list, Table 1 gives the top 10 industries in the UK in terms of the amount of free allocations handed out to each industry (Column 7 in Table 1). Several of these overlap with the EU’s list of industries at risk of carbon leakage.[24] The ones that overlap on our list and the EU’s are: Steel, Cement, Ammonia, and Paper. Other industries on the EU list include Aluminum and Carbon Black. . These are also some of the industries for which the EU has announced that the CBAM will be applied during the initial phasing-in of the proposed mechanism.[25]
Table 1: Activities and industries at highest risk of leakage in the UK[26]
| SIC | Activity | Industry | Employment | CO2 int. | Trade int. | Free Allocations in 2021 | Plants | ||||
| Units of measurement: | No. of jobs | Kg per GBP | X+M/
Output |
Tonnes CO2 | No. of | ||||||
| 24.1-3 | Manufacturing | Iron & Steel | 33,500 | 4.8 | 83.4 | 10,316,589 | 15 | ||||
| 19 | Manufacturing | Coke and ref. petroleum | 9,000 | 5.6 | 90.9 | 6,530,367 | 7 | ||||
| 23.5-6 | Manufacturing | Cement, lime, plaster a.o. | 27,750 | 3.1 | 23.8 | 6,306,045 | 25 | ||||
| 6 | Mining and quarrying | Crude petroleum and natural gas | 13,000 | 1.0 | 26.2 | 5,053,322 | 82 | ||||
| 20.11+20.13+20.15 | Manufacturing | Industrial gases, inorganics and fertilisers | 9,250 | 4.8 | 90.7 | 3,073,113 | 14 | ||||
| 20.14+20.16+20.17+20.6 | Manufacturing | Petrochemicals | 18,050 | 2.2 | 90.7 | 1,732,640 | 16 | ||||
| 23.1-4 & 23.7-9 | Manufacturing | Glass, porcelain a.o. | 52,500 | 1.3 | 23.8 | 1,338,952 | 42 | ||||
| 17 | Manufacturing | Paper and paper products | 53,000 | 0.5 | 42.1 | 771,498 | 20 | ||||
| 10.8 | Manufacturing | Other food products | 98,000 | 0.2 | 30.0 | 528,916 | 18 | ||||
| 35.2-3 | Electricity, gas, steam and air | Gas; distri-bution of gaseous fuels through mains and steam, air cond. supply | 39,400 | 0.4 | 7.5 | 472,742 | 18 | ||||
| TOTAL | 353,450 | – | – | 36,124,184 | 257 | ||||||
The preceding analysis above helps to identify the sectors in which carbon leakage may be most likely as a result of the UK’s ETS scheme, in particular, if the scheme is tightened over time. Note the UK ETS is de facto a continuation of the EU’s ETS scheme, so any carbon leakage is already largely in the data.
In the first column of Table 1, we give the total level of employment in that industry. This number will be greater than the employment levels in the firms with the free allocations. Therefore this is an upper bound on the number of jobs that may be affected. Taking into account all free allocations (note that we only show a subset of the top 10 from the total number of 47 affected industries in Table 1) it does indicate, that overall, the industries at risk of carbon are estimated to involve up to 1 million jobs in the UK – or in manufacturing an estimated total of between 20-25% of all of the 2.7 million manufacturing jobs in the UK. Those on the high-risk list alone involve 353,450 jobs (re. Table 1) and those on the very high-risk list involve approximately a quarter of these jobs (we estimate these to be less than 100,000 based on Table 1).
As discussed earlier, carbon leakage is more likely in more traded industries and this can be seen from the third column of the table which gives the trade intensity for each industry. Trade intensity here is defined as (export+imports)/production. Here we see that the most trade intensive industries are coke and refined petroleum products, fertilisers and chemicals, and petro-chemicals, while trade intensity is low for energy production, food products, cement lime and plaster, and paper products.
The second set of issues concerns the possible impact for the UK of a UK BCA, and the possible impact of the EU’s CBAM, where of course these impacts are likely to be interrelated. In considering these impacts it is helpful to have some data on the shares of trade (both imports and exports) with key partners, and this is provided in Table 2. For each of the four high-risk industries which overlap with the EU’s CBAM industries, the table gives the top 10 countries the UK imports from, and their shares in UK imports; and we also give the corresponding export shares. The countries are listed alphabetically except for the EU which is the dominant trading partner and appears in the first row.
There are two features of this table worth pointing out. First, in each of these sectors, the EU is by far the most important trading partner and supplies between 65% to 87% of UK imports. Equally, the EU is an important destination for UK exports in these sectors ranging from 53% to over 95%. This suggests that any divergence in the UK and EU ETS could lead to changes in the location of production. This will tend to equalize the price of the ETS permits between the UK and the EU markets and may or may not lead to carbon leakage depending on the differences in emissions between the UK and the EU. Secondly, while there is a wide range of other non-European countries which supply to the UK, the key supplier countries here are China, Turkey, the United States and India re. our calculations in Table 2.
Table 2: Share in UK trade for top 10 import suppliers (2019)[27]
| Iron & Steel | Cement, stone | Ammonia | Paper | ||||||||||
| Imp Share | Exp Share | Imp Share | Exp Share | Imp Share | Exp Share | Imp Share | Exp Share | ||||||
| EU27 | 72.35% | 53.05% | 65.46% | 61.47% | 87.98% | 96.41% | 71.10% | 69.60% | |||||
| Australia | 0.00% | 0.00% | |||||||||||
| Algeria | 3.42% | 0.00% | |||||||||||
| Belarus | 0.97% | 0.00% | 2.95% | 0.00% | |||||||||
| Brazil | 0.91% | 0.66% | 0.91% | 0.30% | |||||||||
| Canada | 1.37% | 0.77% | |||||||||||
| China | 2.05% | 1.45% | 13.53% | 4.11% | 0.01% | 0.04% | 10.16% | 1.10% | |||||
| Egypt | 0.41% | 0.14% | 0.68% | 0.58% | |||||||||
| Hong Kong | 0.00% | 0.01% | |||||||||||
| India | 1.64% | 5.44% | 4.14% | 1.03% | 1.08% | 0.58% | |||||||
| Indonesia | 1.41% | 0.34% | |||||||||||
| Japan | 0.94% | 2.59% | 0.01% | 0.02% | |||||||||
| Norway | 1.99% | 0.39% | |||||||||||
| Other Asia | 2.09% | 0.92% | |||||||||||
| Korea | 3.94% | 0.65% | 0.39% | 0.78% | |||||||||
| Russia | 1.51% | 0.12% | 1.46% | 0.01% | |||||||||
| Trin. & Tob. | 3.89% | 0.00% | |||||||||||
| Turkey | 4.43% | 11.10% | 1.37% | 1.46% | 3.10% | 1.58% | |||||||
| Ukraine | 3.81% | 0.01% | |||||||||||
| Vietnam | 0.75% | 0.41% | |||||||||||
| USA | 1.71% | 4.28% | 8.86% | 11.21% | 0.27% | 0.37% | 4.81% | 9.84% | |||||
Consider first the possible impact of the EU’s CBAM, as this is a policy that is already due to be implemented. The high share of UK exports going to the EU (re. the first row in Table 2) suggests that firms in these industries may well be negatively affected by the CBAM, even if it turns out that no additional duty needs to be paid, but simply because of the administrative requirements. The total amount of UK trade with the EU is $10.9bn in these four industries alone, where on average the exposure to EU export markets is between 53% (Iron & Steel) and 96% (Ammonia) for these four sectors.
This reveals that the concern is not solely about UK ETS pricing placing pressure on UK industries in terms of risk of outsourcing production and causing carbon leakage. The imminent introduction of the EU CBAM could have an immediate effect on the UK’s export competitiveness within the EU, due to the additional import requirements, as described above. In addition, the CBAM could have a longer run impact on UK firms’ competitiveness if it leads to changes in investment with a longer run relocation of production to the EU.
All of the preceding are important considerations in assessing the pros and cons of the UK formally linking its ETS scheme to that of the EU. In turn, the impact on UK firms’ competitiveness may also be a disincentive for the UK to reduce free allowances and raise carbon prices, and this would diminish UK efforts to deal with CO2 emissions.
The EU CBAM is likely to have implications for its trade partners. Many emerging economies in Asia and North Africa, who do not price carbon domestically will now be subject to additional costs, and therefore likely to experience a loss in their existing export competitiveness into EU markets[28]. This would also be a consequence of the UK’s policy but to a significantly lesser extent because of the much smaller importance of the UK market for most of the least developed countries.
Second, we consider the possible implications of the UK introducing its own BCA scheme. Given the high share of imports from the EU, in the first instance, the countries and firms most likely to be affected are those in the EU. Once again, even if it turns out there is no BCA to be imposed (given the EU’s ETS scheme), there may be onerous documentation and administrative requirements. This close linkage between EU and UK industries in these sectors strongly points to the advisability of having linked policies – otherwise, producers in both the UK and the EU will be negatively affected. Given too that the relative importance of the UK market for the EU, is considerably less than the significance of the EU for the UK, this is particularly important for the UK. Countries that could be negatively affected by the UK adopting its own version of the CBAM are mainly the key suppliers to the UK from outside of Europe as mentioned above: China, Turkey, the US and India including other countries on the European periphery such as Algeria and Belarus.
The policy implications are complex because they concern the operation and interaction of two domestic carbon pricing schemes – the UK and the EU ETS schemes, and then how these may interact with either or both parties introducing a border carbon adjustment.
First on the ETS schemes: It is hard to imagine that even if not formally linked there will not be considerable correlation and interface between the two schemes. A formal linking of the two systems would imply that the prices are the same at all times because arbitrage would ensure that any gains from trade will be exhausted quite instantly. However, even without any official linking, the two systems are likely to converge (see also Figure 2), but perhaps with a time lag across the two systems. It, therefore, also seems to be the inevitable result that the carbon price in the UK will continue to follow closely the development in the carbon price in the EU.
The potential for close interaction between the markets has implications for the UK’s ETS policy. Suppose the EU introduces a policy to reduce free allocations. Since carbon prices will be aligned in the short- or medium-term in every case (and independent of the concern over carbon leakage), the reduction of free allocations in the EU without a corresponding response in the UK is likely to raise the carbon price in the UK, which in turn impacts on emissions even though the UK has not changed its cap.
This might at first not seem to be a problem and might be seen as a way to solve potential concerns over leakage, but it could jeopardise the intention behind carbon pricing which is to reduce emissions in the first place. Hence, in the UK, despite high carbon pricing, a larger amount of carbon emissions could continue – especially in those industries that are perhaps most in need of restructuring and restoration. It may remove the incentive for the currently high-risk industries to introduce innovations that will bring their emissions levels down over time and maintain export competitiveness. Thus the UK could end up with higher pricing and symmetric policies as in the EU but without the intended impact on the industries at risk.
Turning to BCAs: The introduction of BCAs ensures that there will be greater alignment between internal and external carbon pricing, i.e. by not putting national producers in the EU, the remaining EEA countries and the UK – or in particular in the import-competing industries – at a disadvantage vis-a-vis producers in third countries. However, the EU’s introduction of the CBAM is likely to impact on UK producers and make them less competitive in the EU market. This will be to the advantage of EU producers in the first instance.
This raises the question of whether or not the UK should also introduce a BCA. The answer to this question should not be based on whether retaliation to the EU’s CBAM is a good idea – if nothing else, this would not be a ‘trade-war’ where the UK is likely to be on the winning side. The answer should be based on the extent to which a BCA is an appropriate means of dealing with the problem of carbon leakage, and on the extent to which UK domestic carbon pricing is likely to lead or has led to significant carbon leakage.
On the one hand, given the high dependence of the UK on the EU market for many of the key high emitting industries, this might suggest a degree of caution is advisable because the scope for carbon leakage is correspondingly lower. Nevertheless, on the other hand, there is also a case to be made for introducing a carefully focused BCA mechanism. For example, we see that around 15% of UK imports in the paper industry come from high emitting countries, and similarly nearly 20% in articles of stone, plaster and cement. These are clearly industries where leakage could occur, and thus a BCA might help to offset this.
There is another important dimension to this discussion. Much of the mood music around COP26 was about the need for international cooperation around climate change, and rightly how the problem is a global issue that needs addressing by countries working together. A BCA mechanism potentially takes a very different approach, one that says ‘what can a given country do to penalize and thus incentivize others to change their methods of production?’. Framed in this way BCAs risk becoming a non-cooperative approach to dealing with carbon emissions. Note also, that there was much discussion before and during COP26 about the responsibilities of rich nations to assist poorer countries both to mitigate the effects of climate change, and to transition to greener production techniques. There is nothing inherent in a BCA mechanism to address this issue. Though of course the policy can be framed in a way to provide assistance to poorer countries both with dealing with the reporting obligations of the policy but also with respect to issues of transition. This would be one way of making the policy more cooperative.
The close linkage between the production structures and carbon pricing policies of the UK and the EU also suggests that a cooperative coordinated approach would be a better way of dealing with the challenges of carbon emissions. Indeed we would recommend that the UK works in appropriate international fora such as the G7 (or G20 where it has just been agreed to adopt a common corporate tax floor at 15%) to try and build greater consensus towards a ‘climate club’. The aim would be for countries with ambitious climate targets to work together by agreeing on how to determine equivalence in domestic carbon charges, such as linking emissions trading schemes, while levying a CBA on those countries with less ambitious targets, and providing appropriate support for the poorer nations.
In the introduction to this Briefing Paper, we highlighted that if the objective of the policy is to reduce a given country’s contribution to carbon emissions, then it is important to focus not just on the emissions in production but also the emissions in consumption. An appropriately targeted BCA or carbon club could go a long way to addressing this issue, by raising the domestic price of emissions-intensive industries and thus reducing demand.
In turn, this also suggests that arguably the Nationally Determined Contributions (NDCs) under the Paris Agreement, and recently updated at COP26 perhaps ought to be calculated from both the production and consumption side: clearly showing the trend in the CO2 trade balance over time for each country. While that is extremely unlikely to happen, it is important to continually document and flag this as an issue.
With the introduction of CBAM by the EU, and active consideration of similar policies by other countries CBAs are likely to be part of the trade-related solution to climate change, but there are other, complementary policies also to be considered including the liberalisation of tariffs in environmental goods and services, coordination/agreement on eco-labelling and policies to reduce fossil-fuel subsidies Increasingly these are areas of policy which should be considered by countries both in international fora and in the next generation of free trade agreements.
[1] EC (2021a): Regulation of the European Parliament and of the Council establishing a carbon border adjustment mechanism. The European Commission. Brussels 14.7.2021. COM (2021), 564 final.
[2] In this paper we use the term BCA to refer generically to taxing imported goods according to their carbon content, and the term CBAM specifically to refer to the EU’s proposals in this regard.
[3] Lydgate, E. (2021). The Carbon Border Adjustment trilemma. Briefing Paper 56. UK Trade Policy Observatory:
[4] Ritchie, H. (2019). How do CO2 emissions compare when we adjust for trade? Our World in Data. https://ourworldindata.org/consumption-based-co2
[5] Consumption emissions = production emissions minus the emissions in exports plus the emissions in imports.
[6] Data on openness from the World Bank, World Development Indicators databank.
[7] Ritchie, H. (2019). How do CO2 emissions compare when we adjust for trade? Our World in Data. https://ourworldindata.org/consumption-based-co2
[8] ONS (2019). The decoupling of economic growth from carbon emissions: UK evidence. Last updated 21 October, 2019: https://www.ons.gov.uk/economy/nationalaccounts/uksectoraccounts/compendium/economicreview/october2019/thedecouplingofeconomicgrowthfromcarbonemissionsukevidence
[9] Hufbauer, G.C., J. Kim and J.J. Schott (2021). Can EU Carbon Border Adjustment Measures Propel WTO Climate Talkes?.PIIE Policy Brief. November 2021. Peterson Institute for International Economics, Washington D.C. See also Holmes, Peter, Tom Reilly & Jim Rollo (2011). Border carbon adjustments and the potential for protectionism, Climate Policy, 11:2, 883-900, DOI: 10.3763/cpol.2009.0071.
[10] EC (2021a): Regulation of the European Parliament and of the Council establishing a carbon border adjustment mechanism. The European Commission. Brussels 14.7.2021. COM (2021), 564 final.
[11] EC (2021b). ‘Fit for 55’: delivering the EU’s 2030 Climate Target on the way to climate neutrality. The European Commission. Brussels 14.7.2021.
[12] See also WB (2021). State and Trends of Carbon Pricing 2021. The World Bank, Washington D.C. (https://openknowledge.worldbank.org/handle/10986/35620
[13] UKGOV (2021). Brexit: business guidance. Participating in the UK Emissions Trading Scheme. Last updated 10 November, 2021. https://www.gov.uk/government/publications/participating-in-the-uk-ets/participating-in-the-uk-ets
[14] UKGOV (2021). Brexit: business guidance. Participating in the UK Emissions Trading Scheme. Last updated 10 November, 2021. https://www.gov.uk/government/publications/participating-in-the-uk-ets/participating-in-the-uk-ets
[15] A free emissions permit exempts the firms that would otherwise normally have had to buy tradeable (and therefore very costly) permits under the ETS from incurring this additional production cost. See also Martin, R., Muûls, M., De Preux, L. B., & Wagner, U. J. (2014). Industry compensation under relocation risk: A firm-level analysis of the EU emissions trading scheme. American Economic Review, 104(8), 2482-2508.
[16] Vivid (2013). Carbon leakage prospects under Phase III of the EU ETS, report prepared for DECC by Vivid Economics wiht Ecofys, December 2013. https://assets.publishing.service.gov.uk/government/uploads/system/uploads/attachment_data/file/318893/carbon_leakage_prospects_under_phase_III_eu_ets_beyond.pdf
[17] EC (2021d): Emissions Trading Scheme. Available at: https://ec.europa.eu/clima/eu-action/eu-emissions-trading-system-eu-ets_en
[18] EC (2021c): International Carbon Markets. Available at: https://ec.europa.eu/clima/eu-action/eu-emissions-trading-system-eu-ets/international-carbon-market_en
[19] Reuters (2021). Britain’s carbon market begins trading at higher prices than EU. Reuters, Sustainable Business Sections, Correpsondent Susanna Twidale, May 19, 2021. https://www.reuters.com/business/sustainable-business/britains-carbon-market-begins-trading-higher-than-eu-prices-2021-05-19/
[20] EC (2021a, Annex 2): Regulation of the European Parliament and of the Council establishing a carbon border adjustment mechanism. The European Commission. Brussels 14.7.2021. COM (2021), 564 final.
[21] EC (2021a, Annex 2): Regulation of the European Parliament and of the Council establishing a carbon border adjustment mechanism. The European Commission. Brussels 14.7.2021. COM (2021), 564 final.
[22] See also UKGOV (2021). Brexit: business guidance. Participating in the UK Emissions Trading Scheme. Last updated 10 November, 2021. https://www.gov.uk/government/publications/participating-in-the-uk-ets/participating-in-the-uk-ets
[23] In many cases this is straightforward, in other cases it is more complex, as the primary SIC code of a given firm may be quite different to the SIC code and industry of the installation itself. In each case we have tried to match the SIC code to the installation.
[24] Leonard, M., Pisani-Ferry, J., Shapiro, J., Tagliapietra, S., & Wolff, G. B. (2021). The geopolitics of the European green deal. Bruegel.
[25] See also EC (2021a): Regulation of the European Parliament and of the Council establishing a carbon border adjustment mechanism. The European Commission. Brussels 14.7.2021. COM (2021), 564 final.
[26] Source: ONS, OECD and UKGOV (2021). Brexit: business guidance. Participating in the UK Emissions Trading Scheme. Last updated 10 November, 2021. https://www.gov.uk/government/publications/participating-in-the-uk-ets/participating-in-the-uk-ets
[27] Source: UN Comtrade Database
[28] See for example Leonard, M., Pisani-Ferry, J., Shapiro, J., Tagliapietra, S., & Wolff, G. B. (2021). The geopolitics of the European green deal. Bruegel. and IEEP (2021). What can least developed countries and other climate vulnerable countries expect from the EU Carbon Border Adjustment Mechanism (CBAM)? Institute for European Environmental Policy, Brussels and London.