The Spatial Distribution of Services Exports Across the UK
Trade Relationship with the EU
Growth of Cross-Border Services Exports over Time
This Briefing Paper describes the rich pattern of UK regional services exports. The aim is to provide a “heat map” for understanding better how Brexit might affect the services export prospects of UK regions.
Unless Brexit involved maintaining Single Market levels of access for services, the exit from the European Union (EU) will likely have significant ramifications for services trade because the Single Market has been particularly salient for facilitating the international exchange of services. Yet the discussion of potential effects on the British economy of Brexit has largely been confined to manufacturing sectors at the national level. Less attention has been paid to services sectors, even though the UK economy is particularly strong in exporting services. To date, hardly any attention has been given to the spatial dimension of Brexit, i.e. the differential impact on UK regions because of the geographical specialisation of regions in certain services sectors.
To address this void, we describe the rich pattern by which UK regions are exporting different kinds of services. In particular, we trace the extent to which UK regions export services relatively intensively to EU countries relative to other destinations outside the EU. If Brexit resulted in a deterioration of market access for services to the EU, our results illustrate the extent to which this change may be felt differently across UK regions, because of regional differences in both service sector specialisation and direction of services exports, respectively. The importance of considering services exports is further underpinned by the fact that more than half of all UK businesses that traded internationally in 2016 (156,500) are from the non-financial services sector.[1]
Based upon newly released data from the Office for National Statistics (ONS), we compile a dataset of detailed services exports by 11 broad UK regions, by principal services sectors and, when possible, by destination so as to disentangle exports to the EU vs non-EU destinations.[2] We also exploit regional export statistics of manufacturing goods from HMRC to augment the analysis of cross-border services trade with information about services indirectly exported as inputs into manufacturing exports. The combined information creates a “heat map” that shows which UK regions are particularly exposed to trade with the EU in which services products, and thus which parts of the UK are most vulnerable to potential changes in trading conditions post-Brexit.[3] Because of the method used by ONS to attribute national services exports to regions in proportion to firm-level employment shares, our results are also indicative—albeit indirectly—of “jobs at risk” by changes in the trading environment.
The analysis of regional UK services exports at hand should be read with two principal caveats in mind. It should first be noted that this Briefing Paper does not consider services trade via foreign direct investment or through the international movement of service professionals, respectively. Both kinds of transactions often facilitate and complement cross-border services trade and indirect services exports. Brexit-related changes to conditions for investment or service professionals may have knock-on effects on services trade that have not been considered in this Briefing Paper.
Second, successful export of services may be contingent on services imports through one or more modes of supply, but this aspect too has been omitted as data on regional services imports are not available at the same level of granularity as the services export data that are underpinning this Briefing Paper.
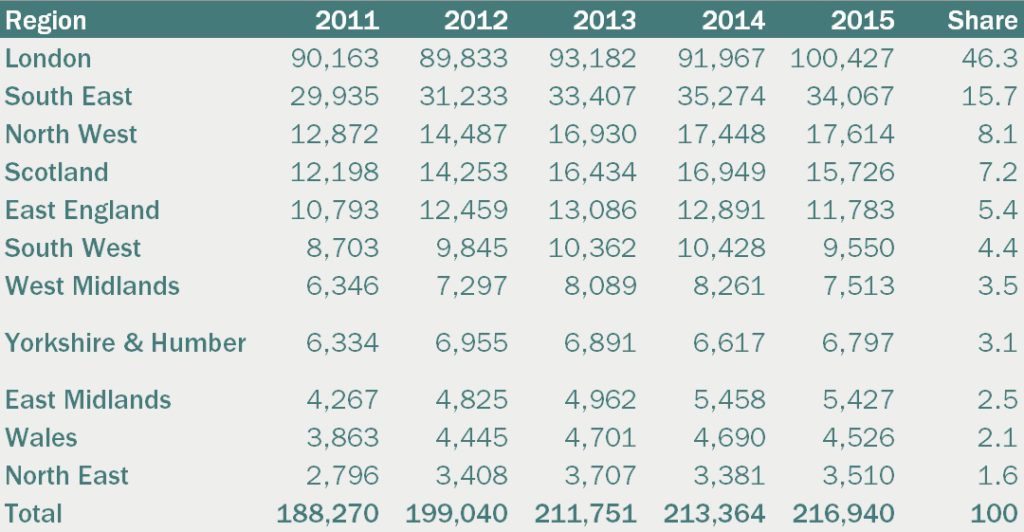
It is not surprising that London tops the list of 11 regions of Great Britain—excluding Northern Ireland for data reasons—in terms of services exports by a wide margin. Nearly half of all UK services exports in a given year originate from London (Table 1). The second most services export intensive region is the South East. Indeed, 40% of internationally trading businesses are located in London and the South East, respectively.[4]
Table 1: Total services export, by region and year, £m
Sources: Office for National Statistics (2017b); Office for National Statistics (2017c); and authors’ calculations. Notes: Annual figures comprise functional categories that combine SIC categories from ITIS as well as commodity categories from the Balance of Payments (Transportation, Finance, and Insurance & Pension, respectively) and from the International Passenger Survey (Travel).
Given the dominant position of London and the South East, the spatial distribution of services exports across UK regions is fairly skewed, with some distinct layers. Outside the capital region, the North West and Scotland are, respectively, the strongest services exporting regions, which is perhaps less widely appreciated compared to the obviously dominant position of London. Beyond those four regions, the East of England and the South West also record sizable services exports. Of the remaining five regions, the lowest value of annual services exports originate from Wales and the North East, respectively.[5]
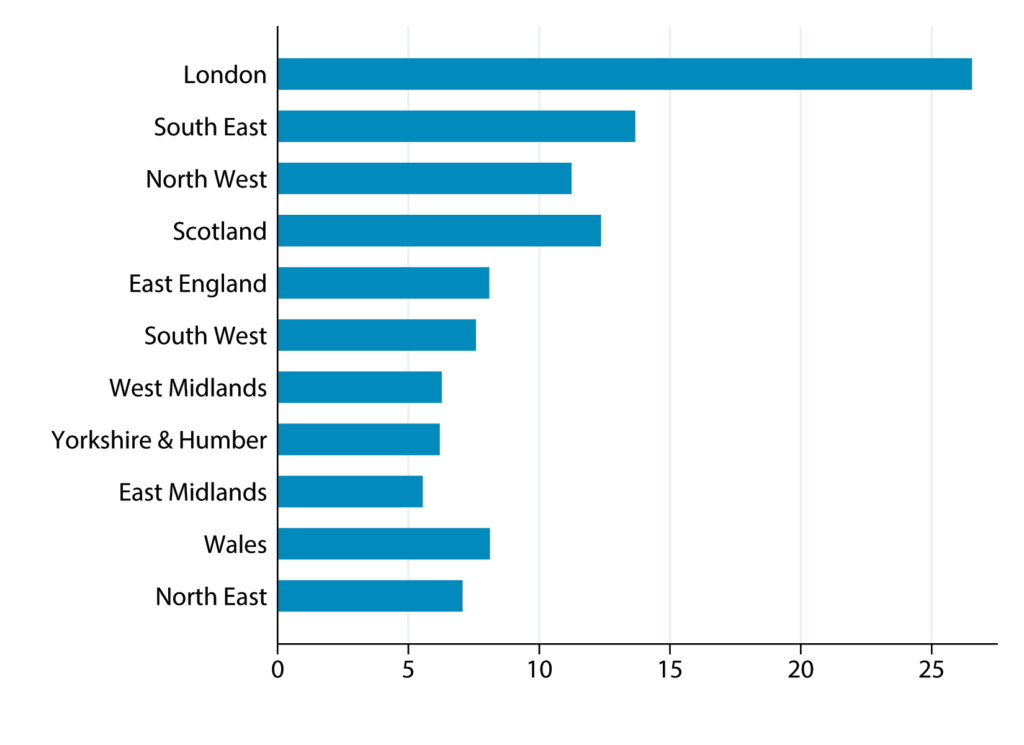
Just how significant these services export values are for a given region depends on the local production structure, i.e. how important services are relative to all economic output, and on trade openness, i.e. how much of services production is actually exported. Regarding the former aspect, the share of services in gross value added (GVA) is invariably 80% or more for every nation and region, with not much variation.[6] Regions do differ in their trade openness, though. Figure 1, below, depicts the ratio of total services exports over total regional GVA in 2015, and regions appear in the same order as in Table 1, i.e. those with highest services export values first. Because GVA and trade are measured in different terms, the actual values of the ratio depicted should not be taken too literal; nonetheless, two insights can be obtained: there is a fair amount of variation in services trade openness across regions [7], and trade openness is related to trade values: regions with larger services exports also tend to export a higher share of their local output.
Figure 1: Ratio of total services exports to total GVA, by region, 2015, in percent
Sources: Office for National Statistics (2017b); Office for National Statistics (2016) “Regional gross value added (income approach) reference tables: Table 6”; and authors’ calculations. Notes: 2015 figures of regional GVA are denoted ‘provisional’ in ONS Table 6. Total services export figures comprise functional categories that combine SIC categories from ITIS as well as commodity categories from the Balance of Payments (Transportation, Finance, and Insurance & Pension, respectively) and from the International Passenger Survey (Travel).
In terms of the potential consequences resulting from Brexit, a pressing question is to what extent UK services exports rely on the EU as market access to EU-27 member states may arguably deteriorate depending on what kind of deal, if any, is struck. On a national level, 40% of services exports (£90 billion)[8] are destined for the EU-27 according to the Pink Book 2016. However, individual UK regions differ appreciably in terms of how much of their overall exports go to the EU, irrespective of the magnitude of their respective exports in absolute terms.
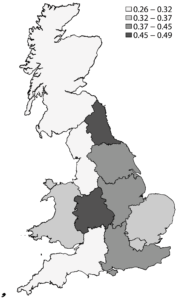
Figure 2 depicts the ratio of export to the EU relative other (ie. non-EU) destinations for total export (excluding travel, transport, insurance and pension and financial services).[9] Regions with higher shares of EU exports are shaded in dark whereas those with the lowest share are set in light grey. The North East is most exposed to EU as a destination market as nearly half of its export go to the EU, followed by the West Midlands (45%). The middle tier consists of regions which direct around one third of their exports to the EU.[10] At the other end, Scotland and the North West are least exposed to the EU market as only about one quarter of their services exports are destined for EU, although both regions contribute significantly to overall services exports (see Table 1).
Figure 2: Share of services exports to the EU in 2015, by region, quartile brackets
Sources: Office for National Statistics (2017a); and authors’ calculations. Notes: Services export values only comprise functional SIC categories from ITIS.
The rendition of London in Figure 2 requires a special caveat, as the numbers underpinning the map suggest that only about one-third of London’s services exports are destined for the EU. This conspicuously low share is mostly a consequence of the lack of information on four service categories (transportation, travel, financial and insurance services, respectively; see endnote 9 above). Trade in financial services, which as a sector constitutes the single biggest item in national services exports, are largely transacted out of London, and the capital does also account for a sizable share of inbound tourism. Hence, Figure 2 should rather not be construed as suggesting that London wouldn’t be depending on services exports to the EU. But apart from London, the map does point towards those regions whose services exports are geared the most towards EU countries, namely the North East and the West Midlands.
The exposure of regional services exports to the EU bears some resemblance with the structure of regional goods exports. For instance, the three regions with the highest relative share of services exports going to the EU in 2015 (just shy of 50%) are the North East, the West Midlands and the South East; those three regions also sends about half of their goods exports towards the EU.[11] At the same time, other regions exhibit greater differences. Scotland too ships half of its goods to the EU but only about 25% of its services. Likewise, two-thirds of Welsh goods exports go to the EU whereas only one-third of its services exports travel that way; that is, both services exports in both these regions are less EU focused than its merchandise goods exports.
The varying degree to which regions rely on the EU market for their services exports is driven in part by specialisation across UK regions in certain services sectors. Therefore we now discuss in greater detail the sectoral dimension of regional exports. One stylised fact emerging from the data is the insight that European trade partners attract exports from some services sectors more than others, so that there are sectors whose exports are mainly geared towards the EU, and conversely other services that would typically go to non-EU destinations.
At the same time, within every service sector there are regions that are relatively more oriented to the EU than other regions; for instance, firms from the manufacturing sector located in the North East direct the majority of their services exports to EU destinations, whereas firms from the same sector located in the North West (or in Scotland) send their services mainly to non-EU countries. Our analysis shows that most EU-focused regions vary by sector. This diversity implies that all regions have an interest in open EU markets, albeit arising from services exports of different sectors.
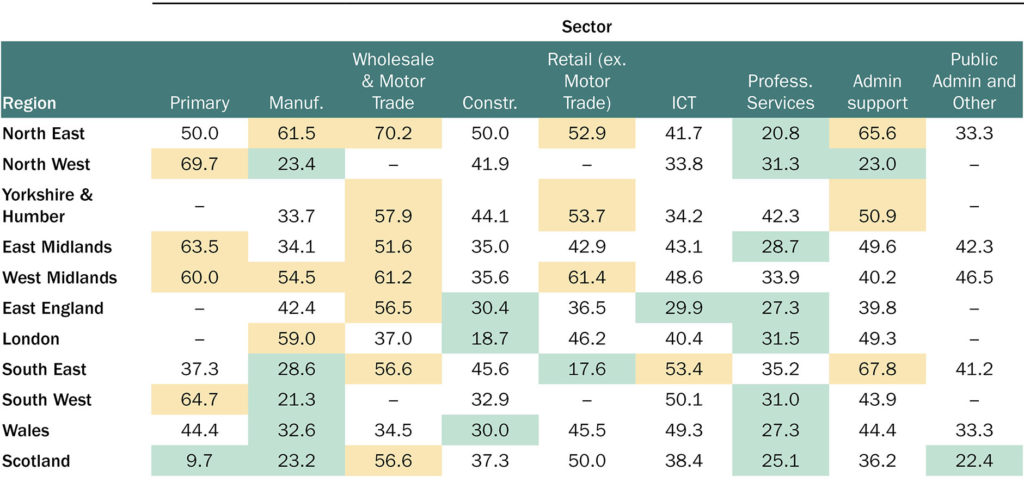
We begin by computing the ratio of services export directed to the EU relative to the value of exports heading elsewhere, broken out by region and sector (Table 2). Data are for 2015, the most recent available year. Entries highlighted in orange signify those region-sector combinations that are most reliant on the EU market (the 25% of table entries with the highest EU share). Green entries denote the least exposed region-sector combinations (i.e. the 25% with the lowest EU orientation).
Table 2: Share of services export to the EU, by region and sector, 2015
Sources: Office for National Statistics (2017a); and authors’ calculations. Notes: Entries denote the share, in percent, of regional services exports by sector that are directed to EU countries. The export share to non-EU destinations is implicitly given by (100 – cell entry). Dots denote instances in which the EU share could not be computed because export values at the region-sector level are suppressed on ONS publications for confidentiality reasons. Column entries only comprise functional SIC categories from ITIS.
Looking at spatially disaggregated services exports in this way reveals a clear sectoral pattern. Services exports by firms from the wholesale/motor trade and from the primary sector, respectively, are those predominantly oriented towards the EU. That is, regional exports of these kinds of services are typically directed towards the EU. The same is true, to a lesser extent, for the administrative support and the retail trade categories. The pronounced orientation of services from the “wholesale/motor trade” sector is likely linked to the close EU integration of the British automotive industry in both intermediate and final goods.
Conversely, services exports by firms from the diverse professional services/real estate sector are mostly geared towards non-EU destinations. In terms of impact for the real economy it is worth recalling that within non-financial services, the largest share in the total number of businesses trading internationally comes from the professional, scientific and technical services sector (58,100 businesses, or 37.1% in 2016). Some of these professional business services, e.g. architectural services or management consulting, are easily traded over the Internet; thus these services exhibit a rather low distance elasticity, which could be one reason why these sectors are relatively intensively exported to ROW destinations. Moreover, exports from the construction sector also tend to go to non-EU destinations.
Beyond those sectors in which most regions export to the same destination (either EU or rest of the world), the orientation of services exports from manufacturing sector firms is geographically more diverse, with regions in the North exporting more to the EU than Southern regions in this sector. Specifically, manufacturing firms in Scotland, the North West and the South West send the majority of their services to the rest of the world, whilst those in the North East, the West Midlands and London focus mainly on the EU. Again a good deal of this pattern is plausibly linked to the location of the British automotive industry.
Apart from those sectors in which exports are predominantly geared either towards the EU or towards the rest of the world across most regions, there are sectors that contribute a lot to overall services export values in which there is greater regional specialisation in terms of export destination. To illustrate this point, Figures 3(a) and 3(b) display individual regions’ shares of exports to the EU for services exports from two important sectors, namely manufacturing and ICT, respectively.
The comparison shows that the exposure of regions to the EU can vary a great deal, depending on the sector. Moreover, apart from the West Midlands which sends 50% of its exports to the EU in both manufacturing and ICT services, it is an entirely different set of regions that rely on the EU in these two sectors. The North East, London and the East of England are, respectively, the three regions most engaged in EU trade for manufacturing sector firms whereas the South East, the South West and Wales are correspondingly the three most exposed regions when it comes to services exports of ICT sector firms.
Figure 3: Shares of services exports to the EU in 2015, by region, percent
A) Manufacturing
C) Professional services and real estate
Sources: Office for National Statistics (2017a); and authors’ calculations.
Notes: Sector definitions correspond to functional SIC categories from ITIS.
Charts like the ones in Figure 3 are useful for highlighting those regions that export relatively intensively to the EU in any given sector, even when the EU orientation is not large enough to be exposed by orange flags in Table 2. For instance, as a whole exports from the professional and real estate services sector are not particularly focused on EU countries; however, that sector’s respective radar chart—Figure 3(c)—reveals that Yorkshire and the Humber has, by a considerable margin, the highest EU share of all regions in these kinds of exports (43%). Under the umbrella of professional business services, specific activities such as legal, accounting or engineering services are highly regulated and thus exports could potentially be quite vulnerable to exiting the Single Market. Figure 3 would thus suggest that the potential future loss of Single Market access would fall on businesses (and service sector jobs) in Yorkshire and the South East.
As negotiations over a future UK-EU trade deal have not yet begun, we cannot know how market access conditions in the EU for services exports will change, and whether conditions would change in a differential manner for, say, the three sectors discussed above. Even if conditions for exports would change in a similar way across the board post-Brexit, Figure 3 would suggest that the majority of regions would be affected, albeit in different sectors.
Statistical evidence on services trade tends to focus on “cross-border services trade” because of the availability of data on this particular type of services trade. It refers to the value of disembodied services—such as telecommunications services—traded between domestic firms and residents abroad. This information is either collected as part of the Balance of Payments or obtained from ONS firm-level surveys. There are, however, multiple other modes of trading services which are generally no less important but which are more elusive because data are not readily available.
One important source of demand for services are services inputs into manufacturing goods, which are subsequently destined for export. In that way, services inputs are indirectly exported as value added embodied in manufacturing exports. In reference to the four modes of services trade [12] as recognised by the World Trade Organization, this particular kind of services trade is sometimes called “Mode 5” services trade. Because sophisticated manufactures such as cars require a substantial amount of services inputs, there is evidence that Mode 5 services trade is quantitatively quite important. The OECD/WTO Trade in Value Added (TiVA) database indicates that 21.3% of the gross value of UK manufacturing exports in 2011 consisted of domestic services inputs. [13]
Whilst precise statistics of Mode 5 services trade do not exist and even estimates are hard to come by, the internationally integrated structure of the UK economy strongly suggests that it is important to consider this type of services trade too. Hence, in order to obtain at least a ballpark estimate of the magnitudes involved, we combine regional goods export statistics from HMRC for 2011-15 and apply the latest available share of embodied services inputs at the national level to these exports.[14] Over the past decade this share of domestic services value added has been roughly stable (it stood at 24.2% in 2000); therefore, applying the 2011 share to later years is likely to be close to the true value. This exercise, albeit imperfect, enables us for the first time to obtain “guesstimates” of the order of magnitude of indirect services exports by region and destination, thereby replicating the exposition in the previous two sections for cross-border services trade now for indirect services exports. [15]
We find that domestic services value added embodied in manufacturing exports is worth more than £50bn per year, roughly the same amount as all financial services exports. These indirect services exports are more evenly distributed across regions than direct cross-border services exports. Thus it is typically a non-negligible share of a region’s total services exports, i.e. cross-border and Mode 5 combined. In 2015, the value of Mode 5 exports ranges from £2.5bn (North East) to £8.2bn (South East). London comes second at £6.4bn.
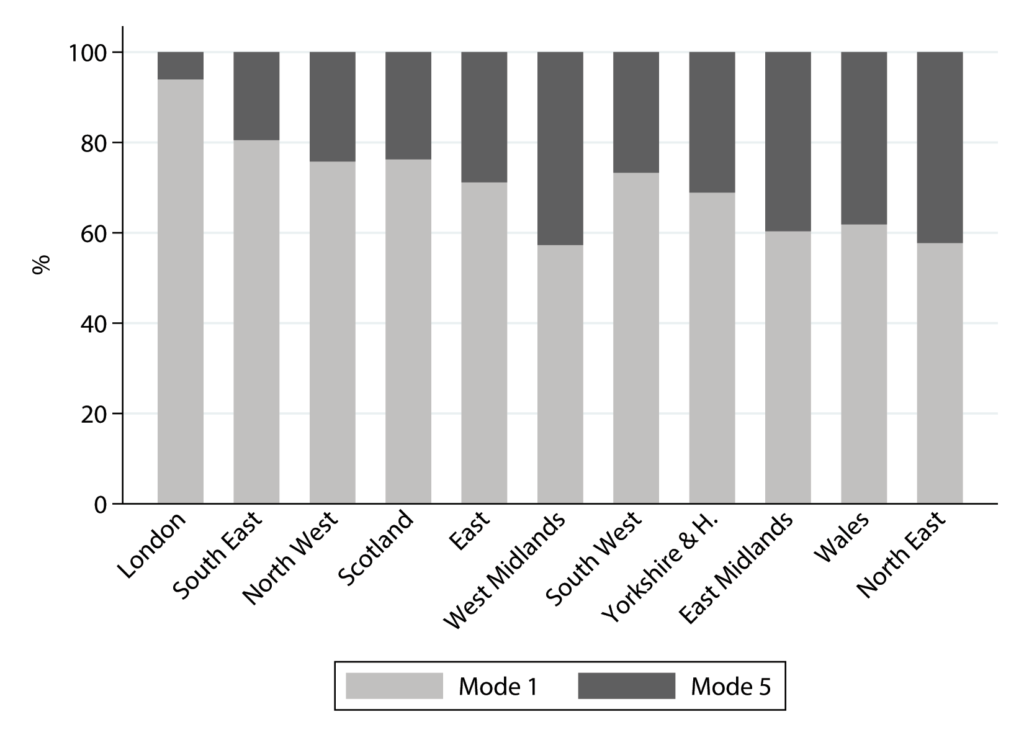
Figure 4 shows the value (in million £) of combined regional services exports in declining order (upper chart) as well as the shares of mode 1 and mode 5 exports, respectively, in a region’s total services exports. Whilst London is by far the dominant region in terms of value of cross-border services exports, as shown in the previous section and in Figure 4 below, London’s runner-up position in Mode 5 exports is not surprising as London’s share of manufacturing gross value added (GVA) is a bare 2.2% of its regional total GVA.
Figure 4: Direct and indirect services exports, by region, 2015
Sources: ONS (2017a); HMRC export statistics by region; OECD/WTO TiVA Database; and authors’ calculations.
For regions other than London and the South East, where exports of financial and professional business services are heavily concentrated, the value of embodied services inputs can constitute a sizable share of a region’s overall services exports (Figure 4 lower graph). In particular, for the North East and the West Midlands the value of services they export through manufactures constitutes over 40% of their combined services exports. The share of Mode 5 trade is equally high for the East Midlands and Wales, respectively. The success of mode 5 services exports, however, depends inter alia on favourable market access conditions for UK manufacturing goods abroad. Figure 4 demonstrates that for a number of regions outside the South East, services trade and employment depend as much on partner countries’ services trade policies as on their goods trade conditions. [16]
The manufacturing export statistics by region from HMRC come with destination information, so that it is possible to disentangle the share of embodied services exports to the EU and other non-EU countries (ROW). In 2015, the destination share of mode 5 exports that goes to the EU ranges from 40-60%, which is a reflection of the rule of thumb that roughly half of UK merchandise exports are destined for the EU. Wales and the North East, respectively, are the regions most focussed on EU destinations, whereas London and the West Midlands directly only about 40% of their manufacturing exports—and thus embodied services exports—towards the EU (Figure 5).
Within this 40-60 percent band, the previous years since 2011 have witnessed a considerable re-orientation of regional manufacturing exports with respect to EU destinations. EU export shares of regions such as Scotland or Wales, amongst the lowest of all regions in 2011, have increased considerably, and as mentioned above, at 60% Wales now exhibits the highest exposure to EU economies for its manufacturing exports. Conversely, the South West and East of England, which had the highest shares in 2011, have seen a quite dramatic fall in their EU share. That is, with regard to their orientation towards the EU, there has been rapid dynamic change across regions in terms of destination for their indirect mode 5 exports, with some regions clearly exporting more to EU destinations whereas others diversifying away.
In particular, the regions in Figure 5 are ordered in decreasing order of mode 5 services exports, i.e. from highest to lowest 2015 values of embodied services inputs. It is apparent that the four regions to the left (London, South East, North West and East) have all seen their EU share of mode 5 services exports fall, sometimes quite dramatically. Over the same period, regions with smaller services trade volumes such as the East Midlands, Wales and the North East have shipped relatively more manufacturing exports to the EU. Since the former regions account for the bulk of mode 5 services exports, the UK as a whole has probably come to rely relatively less on EU destinations for indirect services exports. Yet this recent development is driven by the (re-)orientation of manufacturing exports of “core” regions in the South East; it is concomitant with smaller regions focussing more strongly on EU markets. It would appear that these two opposite trends leave the smaller, more peripheral regions more exposed to Brexit-related changes in market access conditions for manufactures to EU countries.
Figure 5: Share of mode 5 exports to the EU by region, 2011 and 2015

Sources: ONS (2017a); HMRC export statistics by region; OECD/WTO TiVA Database; and authors’ calculations.
These diverging short-run developments unfolded against the longer-term secular trend that, since 1996, the EU share of manufacturing exports—and thus indirect services inputs—has invariably been falling for all UK regions. This general fall is a result of the fact that after the global crisis in 2008 the value of manufacturing exports to EU economies fell whereas it mostly held up to ROW destinations. [17] Nonetheless, latest figures would suggest that the EU exposure for indirect services exports has increased markedly over recent years for geographically peripheral regions such as Scotland or Wales.
Returning to ONS statistics of cross-border services trade, export growth has generally been very solid. The value of aggregate cross-border services exports rose by 15.2% over the period 2011-15, or 3.6% on average every year. This reflects the strong position of the UK economy in services sectors and has led to a further expansion of the current account surplus in services, which partly offsets the ever-widening trade deficit from merchandise goods trade. [18]
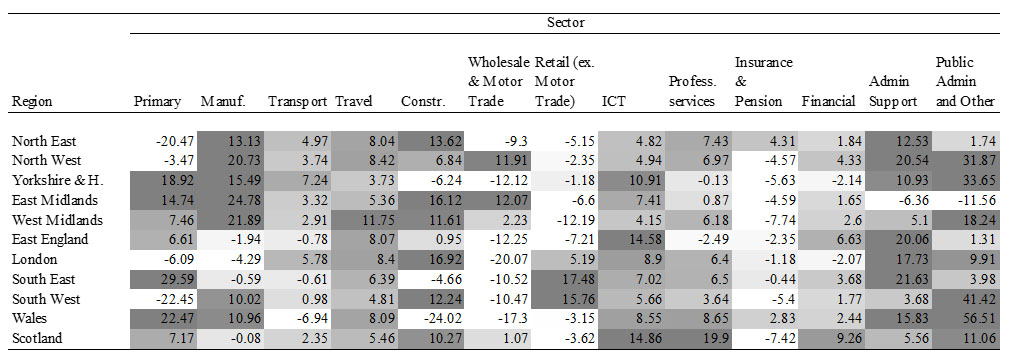
Yet, the robust overall export growth is the net result of different trends. Looking at growth rates in individual sectors, three observations stand out: first, growth rates have been particularly high in certain sectors whose export values are fairly small; for instance, administrative support services, health and education, or the construction sector. In such instances, high growth rates result somewhat mechanically from low numbers in the base year. But these sectors only make up a small share of aggregate services exports, and hence their double-digit growth rates do not drive aggregate growth. Second, exports in the single biggest item—financial services—have essentially stayed stagnant over the past four years, and exports of insurance and pension services have actually shrunk. Thus the financial sectors—often regarded as the ‘crown jewel’ and one of the most successful UK services sectors—is not driving aggregate export growth either. Instead, thirdly, services exports that are quantitatively important and have grown significantly over the past few years emanate from the manufacturing sector (9.2% on average per annum), the ICT sector (8.4% p.a.), and professional services sectors (6.4% p.a.), respectively. As services exports from professional services/real estate sector firms are predominantly exported to non-EU countries whereas services from the ICT and manufacturing sectors are often directed to the EU, recent favourable growth rates seem to be driven by a mix of EU and non-EU markets.
Going more detailed and adding a geographic dimension to sectoral growth rates, it is apparent that the export growth experience is actually fairly diverse across UK regions and sectors (Table 3). Still, the aforementioned pattern that some sectors are growing more than others is quite discernible from the way in which dark cells—denoting high growth rates—align with sectors. As explained before, some of these sectors such as Administrative support services are less important for the bigger picture than the manufacturing or ICT sectors. Table 3 reveals many intriguing developments; for instance, the mixed growth performance of financial services is clearly a result of shrinking exports from London, from which most financial services originate, while Scotland defies that national trend by exhibiting nearly 10% growth in financial services exports every year, and the same is true to a lesser extent for the East of England.
Table 3: Average annual growth rate of services exports 2011-15, by region and sector
Sources: Office for National Statistics (2017b); and authors’ calculations. Notes: Sector columns comprise functional categories that combine SIC categories from ITIS as well as commodity categories from the Balance of Payments (Transportation, Finance, and Insurance & Pension, respectively) and from the International Passenger Survey (Travel).
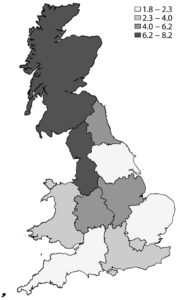
The extent to which regions are successfully participating in services exports is partly down to their specialisation in particular services sectors. Figure 6 shows the distribution of average annual export growth rates across UK regions. At least over recent years, regions in the North such as Scotland and the North West have experienced the most buoyant export growth with rates slightly exceeding 8% and 6% p.a. respectively.
Part of the ‘Northern success story’ is, for instance, Scotland’s considerable growth rates in sectors such as professional services and the ICT sector. Firms located in the North West, in turn, have lodged average services export growth of 20% p.a. out of the manufacturing and administrative support sectors. Indeed, services exports from manufacturing sector firms exhibit massive growth across Northern regions including North East and West, Yorkshire, and East and West Midlands. One might surmise that this could reflect the co-location of manufacturing service providers next to the UK automotive industry in these areas.
Because ONS data on regional services exports end in 2015, the relatively low export growth rate for the South West shown in Figure 6 does not reflect the most recent development that the South West became the third largest English region (after London and South East) in terms of businesses participating in international trade. Most notably, this was due to a large rise in the number of businesses trading services from that region rather than goods. [19]
Figure 6: Average annual growth rate of services exports 2011-15, by region, quartile brackets
Sources: Office for National Statistics (2017b); and authors’ calculations. Notes: Underpinning total services export figures comprise functional categories that combine SIC categories from ITIS as well as commodity categories from the Balance of Payments (Transportation, Finance, and Insurance & Pension, respectively) and from the International Passenger Survey (Travel).
The discussion around Brexit’s potential impact tends to focus on goods trade issues, even though international trade in services is more important for the UK economy than for most other countries. Thus the aim of this Briefing Paper is to present facts about the regional structure and orientation of UK services exports, so as to shed light on how Brexit may have different ramifications for services sectors and for individual UK nations and regions.
We have described the rich pattern of services exports across UK regions in terms of location, destination, and sectoral specialisation. Services exports are highly skewed in a geographical sense, meaning that most services exports originate from two regions, namely London and the South East. The North West, East of England and Scotland, respectively, each contribute similar values to services exports, but between them only about as much as the runner-up region South East. At the same time, the exposure of regions to EU countries as destination markets for services does not follow the aforementioned size pattern. Rather, the regions whose overall trade is most focussed on EU countries, relative to non-EU countries, are the North East and the West Midlands, respectively, followed by the South East.
In terms of sectors, we find that services exports by firms from the wholesale/motor trade sector are those predominantly oriented towards the EU. Conversely, services exports by firms from the diverse professional services/real estate sector are mostly geared towards non-EU destinations. The orientation of services exports from manufacturing sector firms is geographically more diverse, with regions in the North exporting more to the EU than Southern regions in this sector.
Cross-border trade in services is but one of several ways of exchanging services internationally. We provide a ballpark estimate of the value of domestic services that are exported through manufacturing exports as inputs embodied therein. This turns out to add over £50 billion per year to UK services exports, i.e. comparable in magnitude to the total of financial services exports. In 2015, the value of these indirect services exports ranges from £2.5bn for the North East to £8.2bn for the South East. Thus it is a non-negligible share of total services exports for most regions. The share of such indirect services exports that is directed towards the EU ranges from 40-60%, with Wales and the North East being the regions most focussed on EU destinations. The nations of Scotland and Wales as well as the North East region have recently focused more on EU markets and might, therefore, be more exposed to Brexit-related changes in market access conditions for manufactures to the EU Single Market.
Over the 2011-15 period, aggregate growth of cross-border services export was essentially driven by firms from the manufacturing, ICT, and professional services sectors, respectively. As the latter are predominantly exported to non-EU countries whereas services from the ICT and manufacturing sectors are often directed to the EU, recent favourable growth rates seem to be driven by a mix of EU and non-EU markets. At the same time, the North East and the West Midlands are two regions that send nearly half of their services exports to the EU and thus their service sectors emerge as the most exposed to Brexit related changes in market access conditions.
Services differ widely in how and under what conditions they can be traded internationally. For instance, cross-border trade of certain financial services may directly rely on passporting rights, or perhaps on the establishment of a bank branch abroad, and may further be affected by regulation safeguarding the privacy of personal financial data. Exiting the Single Market for services will have starker ramifications for more regulation-intensive services such as financial, legal or broadcasting services. Understanding how alternative Brexit scenarios may affect services export prospects of individual UK nations and regions requires a detailed analysis showing which geographic areas specialise in what kinds of services for which destination markets. This is what this Briefing Paper aims at providing. It may thus be helpful for thinking about negotiating priorities and levels of ambition in the realm of services trade for the forthcoming UK-EU negotiations.
This document was written by Ingo Borchert and Nicolò Tamberi. Without implicating the following persons or the institutions they represent, the authors would like to thank Alan Winters as well as John Cooke, Michael Gasiorek, Peter Holmes and Jim Rollo for helpful comments and suggestions. Any remaining errors are the authors’.
The authors assert their moral right to be identified as the authors of this publication. Readers are encouraged to reproduce material from UKTPO for their own publications, as long as they are not being sold commercially. As copyright holder, UKTPO requests due acknowledgement. For online use, we ask readers to link to the original resource on the UKTPO website.
Office for National Statistics (2017a) “Estimating the value of service exports by destination from different parts of Great Britain: 2015”, data and article. https://www.ons.gov.uk/businessindustryandtrade/internationaltrade/articles/estimatingthevalueofserviceexportsabroadfromdifferentpartsoftheuk/2015
Office for National Statistics (2017b) “Estimating the value of service exports abroad from different parts of the UK: 2011 to 2015”, data and article. https://www.ons.gov.uk/businessindustryandtrade/internationaltrade/articles/estimatingthevalueofserviceexportsabroadfromdifferentpartsoftheuk/2011to2015
Office for National Statistics (2017c) “International Trade in Services survey (ITIS)”, 2015 (published 31 Jan 2017).
Office for National Statistics (2016) “Regional gross value added (income approach) reference tables: Table 6”, published 15th December 2016.
HM Revenue & Customs (HMRC) “Regional Trade Statistics”, data available at: https://www.uktradeinfo.com/Statistics/RTS/Pages/default.aspx
_____________________________________________________________________________
[1] Office for National Statistics: “Annual Business Survey, Great Britain non-financial business economy: 2016 exporters and importers. Article released 09 November 2017.
[2] The recent publication of detailed regional services export statistics by the Office for National Statistics is a significant and valuable contribution. ONS consider these regional estimates “Experimental Statistics.” Accordingly, the analyses and interpretations in this Briefing Paper are subject to the caveats that come with these data; for further details see ONS (2017a, 2017b). No comparable statistics exist for regional imports of services, thus we focus on an in-depth analysis of export flows.
[3] The empirical analyses in this Briefing Paper do not cover Northern Ireland for want of information on regional services exports by sector and destination in 2015. At £2.27 billion, total services exports from Northern Ireland are the smallest of all NUTS-I regions in 2015. Hence, whilst Northern Ireland is politically significant in the Brexit debate, its omission is unlikely to bias the results on services exports in economic terms.
[4] On a national level, the financial services sector makes the biggest contribution to aggregate cross-border services exports. Professional and business services represent the next most significant export category, followed by ICT services and Travel (inbound tourism), respectively. Exports of manufacturing exports are also quantitatively important for the UK.
[5] More detailed information on the concentration of services exports across regions, and its evolution over time, is offered in the online version of this Briefing Paper (Section 6), available from UKTPO’s website.
[6] Further information is contained in Annex Figure A.1 in the online version of this Briefing Paper, available from UKTPO’s website.
[7] Differences in ‘openness’ across regions are partly due to local productivity differences, although by itself this would bias the ratios in Figure 1 downwards.
[8] In 2016, this share has fallen slightly to 37% according to the Pink Book 2017.
[9] The ONS (2017a) estimates of services exports by region and sector are based upon the ITIS survey, which does not cover firms from these four sectors. Further information on functional categories is offered in the online version of this Briefing Paper (Annex 2 on Data Methodology), available from UKTPO’s website. As such, the trade statistics underpinning Figure 2 and Table 2 are not directly comparable to Table 1 figures, which do include these functional categories.
[10] Those regions are, in descending order of EU orientation, the South East, East Midlands, Yorkshire & the Humber, London, East of England, and Wales.
[11] HMRC 2017 Q1 Press Release issued 09 June 2017. See also Matthew Ward, “Statistics on UK-EU trade” House of Commons briefing paper, No. 7851, 17 August 2017.
[12] Mode 1: ‘cross-border services trade’, Mode 2: ‘consumption abroad’, Mode 3: ‘established of commercial presence’, Mode 4: ‘temporary movement of natural persons as service suppliers.’
[13] Another 15.8% of the gross value of manufacturing exports in 2011 consisted of foreign services inputs, which raises the total share of services inputs into manufacturing exports to nearly 40%. However, we abstract from foreign services value added here because changes in services imports do not translate directly into changes for domestic production and employment. That said, services inputs—both domestic and foreign—may play an important role in the efficiency and competitiveness of the manufacturing base.
[14] HMRC regional trade statistics are published in terms of SITC Rev.4 (ie. a goods classification), whereas manufacturing sectors in TiVA are provided in ISIC Rev.3 (ie. an industry classification). Rendering data from both sources compatible requires multiple concordances, details of which are given in the appendix. Concerns one may have about these conversions are alleviated by the fact that the object of interest is aggregate manufacturing only, thus ambiguous concordances at the product/subsector level are irrelevant.
[15] In addition to the aforementioned data compatibility issues, the derivation of regional mode 5 services export figures requires a number of assumptions. First, the share of services value added in UK manufacturing exports is the same across all regions, across destinations (EU and ROW), and over the period 2011-15. Second, the value of services inputs thus recovered from manufacturing exports of a given region is attributed entirely to that originating region; or put differently, manufacturers purchase services only from within that region. This would, for instance, in practice not be true if specialist legal advice or financing was procured from London by a firm exporting manufactures from the North East. Further details on the construction of mode 5 exports is offered in the online version of this Briefing Paper (Annex 3), available from UKTPO’s website.
[16] There are numerous other linkages between goods and services trade. For instance, the North East and West Midlands are the two regions with the highest relative share of mode 5 exports, and at the same time are those regions with the highest share of cross-border services exports to the EU relative to ROW (Figure 2). Both could potentially reflect value-chain activities by some firms.
[17] Graphs with time series of the four largest mode 5 exporting regions are contained in Annex Figure A.2 in the online version of this Briefing Paper, available from UKTPO’s website.
[18] Over the period 2011-2015, the UK trade deficit in goods rose from £95bn to £119bn whilst the trade surplus in services rose from £70bn to 86bn.
[19] Office for National Statistics: “Annual Business Survey, Great Britain non-financial business economy: 2016 exporters and importers. Article released 09 November 2017.