
Download Briefing Paper 23
The nature of inward FDI to the UK
What are the most common source countries of investment in the UK?
Why do different firms want to invest here?
How strong is the UK’s performance in attracting FDI compared to other European countries?
The impact of the Brexit vote on inward foreign investment to the UK
Political uncertainty: timeline of Brexit
FDI in the lead-up to and after Brexit: performance of the ‘real’ and ‘synthetic’ UK
FDI cost of Brexit to date across sectors: manufacturing and services
Has the Brexit vote disrupted investment by supply chain multinational firms?
The UK continues to perform strongly in attracting inward foreign investment, and remains one of the largest recipients of Foreign Direct Investment (FDI) in Europe and globally. In 2017, there were close to 1,000 greenfield investment projects announced for the UK: these created approximately 60,000 new jobs and were valued at just over US$ 33 billion.
The UK’s strength lies in the services sector: the areas with the largest number of individual FDI projects include software & IT services, business services and financial services.
However, in 2017, the UK was overtaken by Germany as the largest European recipient of FDI, with France also gaining ground. The UK share of EU28 FDI has fallen from some 25 per cent in early 2015 to some 18 per cent in late 2017.
Since the EU referendum, inflows of FDI to the UK have followed a downward trend: the longest continuous decline since the beginning of the data series in 2003.
Our analysis shows that the Brexit vote may have reduced the number of foreign investment projects to the UK by some 16-20 per cent. For services FDI, the gap is even larger: investment may be some 25 per cent lower than if the UK had voted to remain in the EU.
While investments continue to flow into the UK, there is a decline in investment in sectors such as ‘software publishing’, ‘investment management’ and ‘retail banking’. These are high-value-added industries, so the threat of Brexit has put high-skilled jobs at risk.
The UK continues to perform strongly in attracting inward foreign investment, and remains one of the largest recipients of inward foreign direct investments (FDI). In 2016, following a string of large megadeals the reported inflows of FDI to the UK reached an all-time high (valued at US$ 196 billion), making the UK the second largest recipient of inward investment in the world, after the United States (UNCTAD, 2018). Alongside much larger economies such as the United States, China and India, as well as Germany, the UK has also been one of the largest recipients of productive foreign investment (i.e. investment that results in new productive capacity).[1]
Anecdotally, the reasons for the UK’s success in attracting FDI are manifold. First, having English as the official language makes communication with partners in other countries simpler, in particular with the US, the largest investor worldwide. Second, the business-friendly environment and stable institutional system make the country an attractive place to start and do business. The UK has also long been a champion of free trade, which has helped to boost foreign businesses confidence. And geography matters too: the UK is a relatively small open economy but as a member of the EU, it offers businesses easy access to the European Single Market, the largest combined economy of 500 million consumers in the world. Although the UK remains a member of the EU until 29 March 2019, the Brexit vote has introduced a considerable uncertainty over some of the things that seem important to investors, especially the availability of labour and access to the EU market.
Because of its long-term nature, foreign investment is sensitive to risk perceptions (Resmini, 2000; Singh and Jun, 1995). This means that the current uncertainty might already have had a significant impact on inward FDI to the UK. Japan, one of the main investors in the UK, has already warned that its firms could leave the country if it became unprofitable to serve the European market from Britain. [2] Recently EY’s Europe Attractiveness Survey, which tracks investment decisions since 2000, noted an increase in project outflows by British companies into other European countries. [3] The report characterised this as ‘loud warnings from firms in those sectors that they will have to move jobs and operations to mainland Europe to cope with the regulatory shake-up that leaving the single market likely entails’. [4]
Although the UK has not yet left the EU – and from this perspective, nothing has changed – there are at least two hypotheses in which we think the Brexit vote may have already impacted on multinational firms’ decisions to invest in the UK. First, there is the role of uncertainty: multinational firms may be temporarily holding off investment, waiting for clarification regarding the nature of the future relationship between the UK and the EU (notably, the ease of doing business with the remaining 27 EU Member States). Second, there is the possibility that the Brexit vote has dented investors’ confidence in the UK, making the UK permanently less attractive to investors.
With only a couple of years’ data, it will be difficult to separate these two effects empirically, so in this paper, we merely aim to establish whether or not the Brexit vote has already had a detectable impact on inflows of investment to the UK.
Using data from the FT fDi Markets database, [5] we analyse foreign investment inflows to the UK since 2003. In particular, we focus on trends in the number of inward FDI project announcements to determine whether the Brexit vote has reduced inflows of FDI since the UK voted to leave the EU on 23 June 2016.
Of course, the number of project announcements is only part of the story: we would also want to know about the capital value of the investment and the number of jobs created. However, for a variety of reasons, our analysis focuses predominantly on ‘projects’. First, owing to commercial confidentiality, the value of investment and job creation data are frequently not available. For the UK, actual figures are not available for some 80 per cent of projects and the FT has estimated them based on jobs and values of similar projects. Even when investment and jobs are reported, they are intentions / expectations rather than actual outcomes. Second, each project is effectively an independent signal of the investor’s trust and confidence in the UK economy. Their aggregate offers a good indicator of average sentiment. Third, a project’s measure of FDI is subject to less fluctuation, as it is not skewed by large megadeals.
In the first part of the paper, we provide a description of the inflows of FDI to the UK over the period 2003- 2017 (including their industrial profile and source of this investment). In the second, we consider the full set of available FDI project data (including any investment projects announced in 2018) to quantify the FDI cost of the Brexit vote. [6] We do this using the synthetic control methodology, which compares the performance of the ‘real’ UK to that of the counterfactual ‘synthetic’ UK in attracting inward FDI before and after the EU referendum.
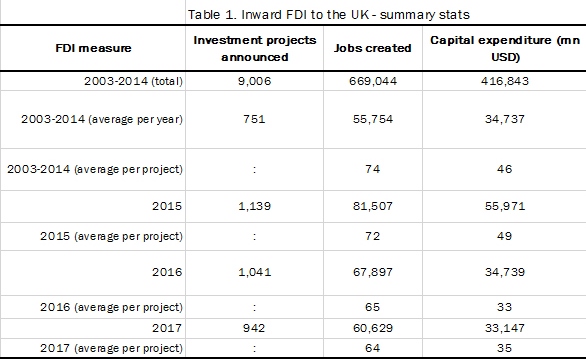
Over 12,000 inward investment projects to the UK were recorded between 2003 and 2017. This number includes all project-based ‘productive’ investment that resulted in new capacity but excludes mergers and acquisitions. [7] These projects resulted in close to 900,000 jobs being created, with an approximate total value of investment of US$ 540 billion. Some 8,000 different companies chose to invest in the UK over this period, and the average project created 72 jobs and was worth US$ 45 million.
By comparison, between 2003 and 2017 an average project in the EU27 created 112 jobs and was worth US$ 35 million. For projects in non-EU countries, the corresponding figures were 189 jobs and US$ 73 million.
As shown in Table 1, the average job creation and capital expenditure per project recorded during the period 2003-2014 (i.e. when the EU referendum was not on the cards) were higher than those recorded since the Brexit vote in 2016. Compared to a peak of 1,139 project announcements in 2015, the number of projects was lower in 2016 and lower again in 2017.
Focussing on the number of FDI project announcements from now on, services dominate the inflows of FDI to the UK, the largest sector being ‘software & IT services’ (see: Table 2). Over the period 2003-2014, ‘software & IT services’ accounted for 23.7 per cent of all projects, with this share being similar in 2015, 2016 and 2017. Inward investment flows to the UK also featured a large number of greenfield projects in ‘business services’ and ‘financial services’, which were the second and the third largest sectors respectively. [8]
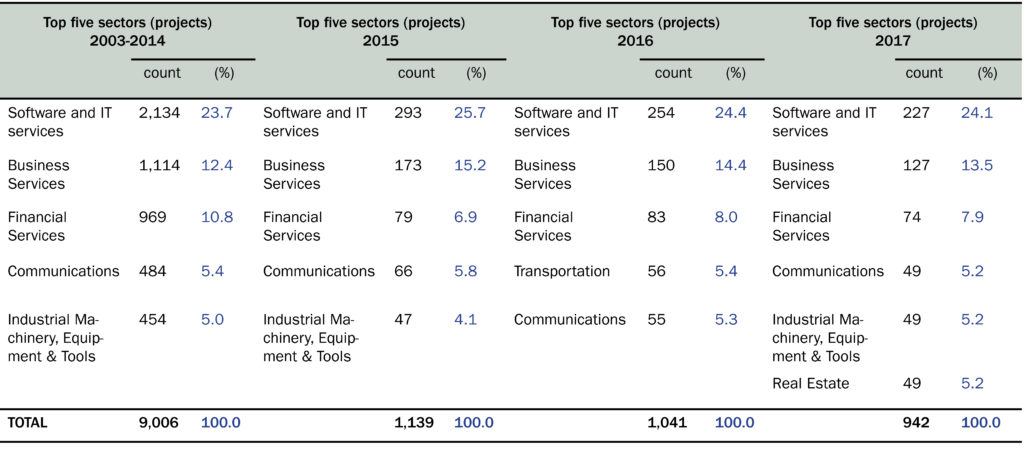
At a more disaggregated industrial breakdown – sub-sectors – the most common type of inward FDI is in the ‘software publishers (except video games)’ sub-sector. [9] Between 2003 and 2014 this one sub-sector accounted for 11 per cent of all projects in the UK. By comparison, the second most common type of inward investment was related to ‘internet publishing, broadcasting and web search’, which accounted for only 2.8 per cent.
More recently, the shares of ‘software publishers’ and ‘internet publishing, broadcasting and web search’ have grown in relative size, to 15 and 4 per cent of all projects respectively. Among other important sub-sectors, ‘corporate and investment banking’, ‘custom computer programming’, ‘advertising, PR and related’ and ‘professional, scientific and technical services’ also feature prominently.
The definition ‘software publishers except video games’ is broad. It encompasses tech companies, the majority of which have headquarters in the United States (i.e. 60 per cent in the US, of which 34 per cent in California). The sub-sector includes large multinational companies such as Fujitsu, Microsoft and IBM, as well as a large number of firms with only a single investment project attributed to them. The sub-sector provides business services, mainly software, data management, cloud platform, machine learning. These high-tech investments tend to create high-skilled and high-paying jobs, and are likely to create positive spillovers that increase the productivity of domestic firms.
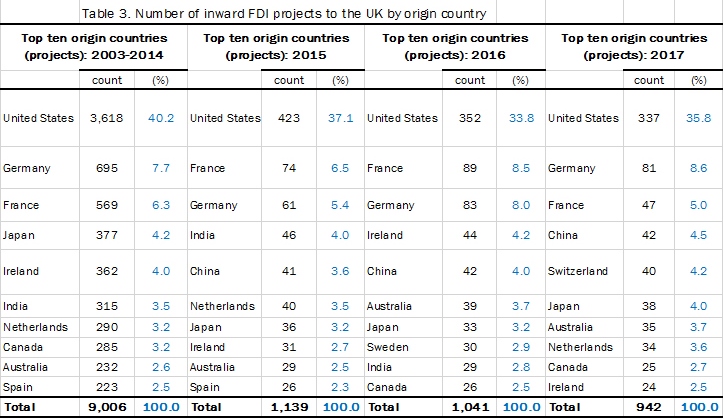
The largest investor in the UK has been the United States. Between 2003 and 2014 it accounted for close to 40 per cent of all inward investment projects, and since 2015 around 35 per cent (see: Table 3). The other main non-EU investors in the UK include Japan, India, Canada, Australia, and, recently, China, which is now one of the top five investors with 4.5 per cent share of projects.
Although it accounts for a smaller share than non-EU investment, FDI from the EU is sizeable too. For example, Germany and France were the second and third largest investors in the UK, with France overtaking Germany in 2015 and 2016. However, in 2017, FDI from France fell considerably (from 89 projects in 2016 to 47 in 2017). Other important EU investors included Ireland and the Netherlands.
Data on investment trends from the fDi Markets database include a category called ‘Motives and Determinants’ that provides an indicator as to the factors cited by companies, and their representatives when announcing or opening a project.
The motives for investment in the UK differed across different companies, but according to the fDi Markets database, the most common reason for companies wanting to invest in the UK was the proximity to markets or customers. In 2017, 22.9 per cent of multinational firms investing in the UK gave this as a reason for their investment. Other important motives given by companies were related to resource-seeking such as ‘skilled workforce availability’ (16.1 per cent of investors) and another market-related motive of ‘domestic market growth potential’ (15.7 per cent).
While we do not attach too much significance to these data – because data providers advise that it is not possible to record motives and determinants for all projects and because in many cases more than one motive or determinant is recorded – we observe that in 2016 there was a significant drop in the share of investors giving ‘domestic market growth potential’ as a reason for investment (from 16.6 per cent in 2015 to 7.2 per cent in 2016).
While the market-related motives such as proximity to markets or customers clearly matter for companies choosing to invest in the UK, we cannot tell which market mattered (local, regional, national or international). Anecdotal evidence (e.g. the letter from Japanese authorities) [10] suggests that access to the European Single Market is an important feature for some companies, and empirical evidence from Bruno et al. (2016) suggests that there was a 28 per cent FDI premium from EU membership – i.e., more investments than what the underlying characteristics of the economy would imply. This evidence suggests that the prospect of losing unfettered access to the EU Single Market could considerably change the incentives for FDI to the UK.
The UK is one of the largest recipients of inward investment in the world, and between 2003 and 2014 received more greenfield investment projects than any other EU Member State (see Table 4). One in five of all projects to the EU28 was destined to the UK. 2015 saw an exceptional performance of the UK vis-à-vis its European counterparts, attracting nearly a quarter of all EU28’s projects. The UK’s performance in 2016 and 2017, however, was not as strong: both the number of projects and the value of investment fell. In 2017, the UK lost the top position as FDI destination in the EU to Germany, with France also gaining ground.
Figure 1 shows the full-time series, plotting the number of inward FDI projects to the UK on the left axis and the UK’s share of EU28 FDI projects on the right axis. At the beginning of 2015, inward investment to the UK peaked – breaking the ‘barrier’ of 100 projects announcements in the first three months of 2015 – and has been falling since. The UK share of EU28 projects fell from some 25 per cent in early 2015 to some 18 per cent in late 2017.

We have seen so far that the UK’s performance as a destination for investment remains strong, although its share of the European market has declined in recent years. In this section, we investigate whether this decline might be attributed to the Brexit vote.
As stated in the introduction, we believe that there are (at least) two channels through which investors may have already reacted to the UK’s decision to leave the EU.
First, there is a significant degree of uncertainty – political and economic – regarding the nature of the future relationship between the UK and the EU: how will this new relationship will impact on the national economy, on the cost of trade, on the ease of managing and coordinating cross-border operations, on future migration policy, and many more? This means that some multinational firms, potentially interested in investing in the UK, may be temporarily holding off, awaiting clarity on some of these aspects, and possibly still planning to make an investment at a later stage.
However, not all foreign firms can afford the convenience of a ‘wait-and-see’ option. This leads to the second hypothesis: that the Brexit vote will cause (if it has not already) a permanent shift in inward FDI away from the UK. For example, if investment is urgent some firms may conclude that Brexit poses too significant a risk to their operations, leading them to choose a non-UK over a UK-base.
Empirically, it will be difficult to separate out a temporary adjustment from a permanent shift – for that, a longer longitudinal series beyond Brexit is needed. For this reason, we focus merely on quantifying the impact of the Brexit vote on foreign investment to the UK, avoiding speculation about what will happen once the UK leaves the EU.
The UK’s vote to leave the EU led to a significant spike in economic and political uncertainty in the UK, and this is evident from a measure of ‘economic policy uncertainty’ developed by Baker et al. (2015), as shown in Figure 2. [11] With FDI being considered to be highly sensitive to risk perceptions because of its long-term nature (Janicki and Wunnava, 2004), we believe that multinational firms are likely to have reacted to the Brexit vote by adjusting their UK investment plans – either temporarily and / or permanently.
In the remainder of this paper, where we quantify the FDI costs of Brexit, we consider the EU referendum date of 23 June 2016 to be the ‘treatment date’: the point at which we hypothesise that investors started to change their UK investment plans. The choice of the ‘treatment date’ is made on the premise of the EU referendum result being largely unanticipated. [12] But we recognise that it would be possible to choose other dates. For example, economic and political uncertainty in the UK started to rise at the beginning of 2016 reaching levels exceeding those seen during the global financial crisis of 2007-09 and the Eurozone crisis. (Box 1 gives a timeline of key events in the lead-up to the EU referendum).
As the Prime Minister at the head of a coalition government between the Conservatives and the Liberal Democrats, David Cameron first declared his intention to hold an in-out EU referendum in a speech at Bloomberg on 23 January 2013. This plan became part of the Conservative Party manifesto for the 2015 General Election. The plan to hold the EU referendum became political reality when the Conservative Party won a 12-seat majority in the General Election held on 7 May 2015. Following the elections in May 2015, the European Union Referendum Act received Royal Assent on 17 December 2015, which paved the way for the EU referendum. David Cameron officially announced the EU referendum date on 22 February 2016. The EU referendum took place on Thursday, 23 June 2016, with 33.6 million voting (72.2 per cent turnout), of whom 51.9 per cent voted to leave the EU and 48.1 per cent voted to remain in the EU.
Between 2003 and 2015, FDI inflows into the UK had increased steadily, punctuated by occasional setbacks (see: Figure 3). The number of foreign investment projects reached a peak in July 2015 and declined by a small amount thereafter in the lead-up to the EU referendum. Since the Brexit vote, inflows have followed a downward trend: the longest continuous decline since the beginning of the series in 2003. The number of project announcements is, at present, similar to that recorded in 2012-13, and we have not yet seen signs of this downward trend reversing.
The series for capital investments (the value of capital expenditure associated with FDI projects) reveals a similar pattern, although it seems that there may have been a mild turn-up in 2018.
This visual inspection of the FDI series suggests, prima facie, that the Brexit vote had an adverse effect on inflows of investment to the UK, but to measure the Brexit effect on FDI rigorously, we need to construct a counterfactual for the UK: i.e., ‘what would have happened to the UK’s inward FDI in the absence of Brexit?’.
To do so, we rely on the synthetic control method (SCM), a technique developed by Abadie and Gardeazabal (2003) and Abadie et al. (2010, 2015). The basic idea is to construct a ‘synthetic’ UK (i.e., the counterfactual) as a weighted average of other similar countries. This is done using information on variables which are considered to be ‘good’ predictors of FDI (for example, GDP, population, level of education …) in the pre-Brexit period. We derive a series of weights for each country in the control group and, assuming that these weights would not have changed, we apply them to the post-Brexit period to compute the counterfactual. These weights are computed such that the distance in the FDI predictors between the UK and the control countries is minimised in the pre-Brexit period.
The predictors of FDI that we use to compute the ‘synthetic’ UK are GDP, population, trade openness (i.e., imports + exports, as a share of GDP), market potential (sum of other countries GDP weighted by distance), corporate tax rate, employment share and employment share in the services industry, cost of labour, education level. Because SCM requires choices to be made about the correct specification of the estimator, we test a number of different specifications as recommended by Jardón et al. (2018). Our specifications differ in the linear combination of the outcome variable used as predictor. Details on the different specifications are reported in the online appendix. We applied a centred moving average with 6 lags and 6 leads to account for seasonality present in the data. The series has been indexed such that it is 100 in Jan 2014.
The result for the ‘synthetic’ UK, as shown in Figure 4, is a weighted average of Australia (weight of 0.02), France (0.145), Ireland (0.185), the Netherlands (0.176) and US (0.473). The resulting control group is a qualitatively sensible, and the counterfactual has pre-treatment fit of 0.94 – i.e. it accurately captures 94 per cent of the variance observed for the actual UK over the sample period. [13]
The estimated impact of the Brexit referendum result on inward FDI is a drop by 19 per cent compared to the counterfactual in which the referendum would not have happened. [14] The FDI series for the UK drops after the referendum, while the counterfactual keeps the positive trend observed before the referendum date (as FDI for countries in the control group kept growing). With 2017 being a buoyant year for the world economy (which is reflected in the growth in inward FDI for the counterfactual, ‘synthetic’ UK), the fact that inflows of investment into the UK have fallen since the EU referendum suggests that the Brexit vote may be starting to bite.
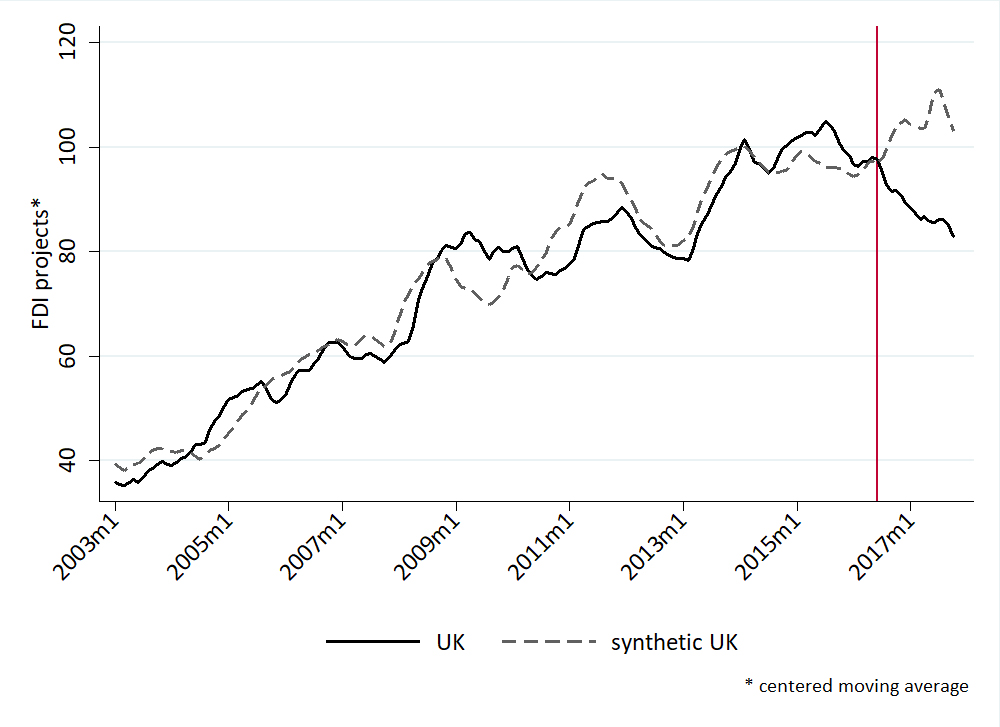
Figure 4 is our preferred specification according to the robustness tests that we run (results for these tests are reported in the online appendix). Other specifications tested, also reported in the online appendix, yield very similar results, with the estimated decrease in FDI ranging between 16 and 20 per cent. This is a considerable drop and, if the trend is not reversed, there could be serious damage to the UK economy in the medium-long run.
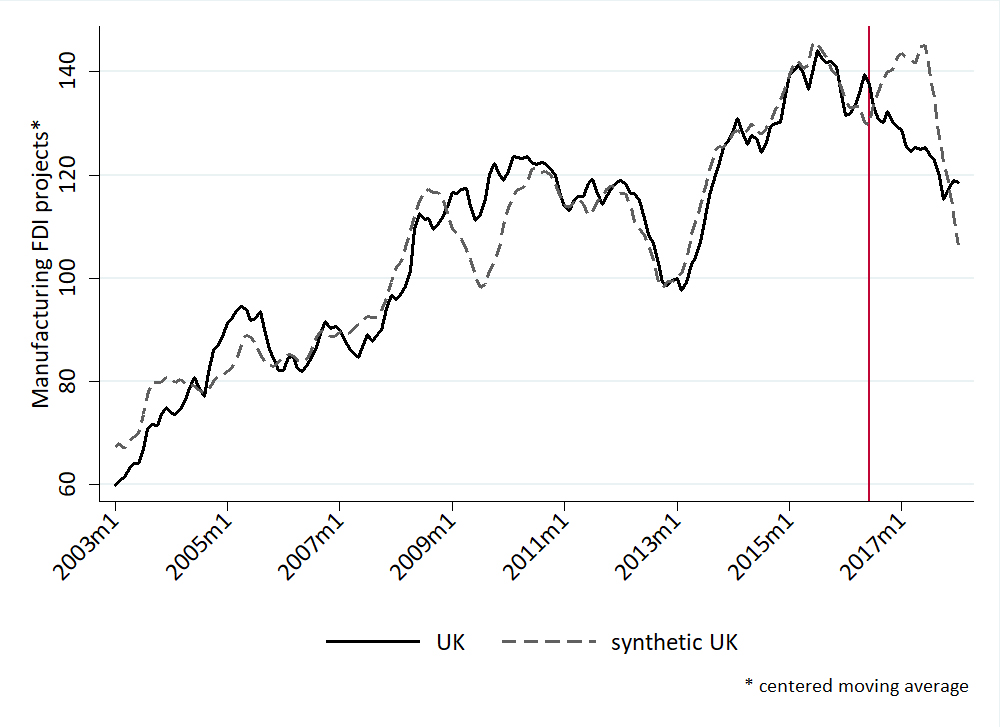
Investment does not happen in a vacuum: multinational firms often form links with domestic firms in the host location. For this reason, looking at the sectoral impact of Brexit on inward investment helps us to gauge how domestic firms in different sectors may be affected. In this section we consider the difference in how the Brexit vote has affected manufacturing and service sector FDI to the UK.
There are several reasons to expect the impact of the Brexit vote to differ across sectors. First, because of the focus on physical products, capital investments in machinery and equipment are typically much higher in the manufacturing industry. This means that manufacturing firms have greater difficulty with relocating as their investments often involve fixed assets, large plants and infrastructures that are planned for medium / long term operations. Second, manufacturing firms are also likely to need substantive investments necessary to maintain operations and replace the depreciated capital, leading to firm-level investment spikes. [15] For example, projects classed as ‘expansions’ (rather than ‘new’ FDI) constitute 40 per cent of all inward FDI to the UK in manufacturing, but (a much lower) 17 per cent of FDI in services. Finally, manufacturing firms are more likely to operate different stages of a production process or have a broader network of suppliers. These complex networks of plants make it harder for manufacturers to make any swift adjustments to their production processes.
By comparison, services sectors – in particular, business services, the main industry investing in the UK – do not need heavy machinery but mainly offices and computers. This allows them to be more mobile and able to relocate at a shorter notice. There are also differences in the reliance of different sectors on access to the EU market and on the Single Market’s regulation.
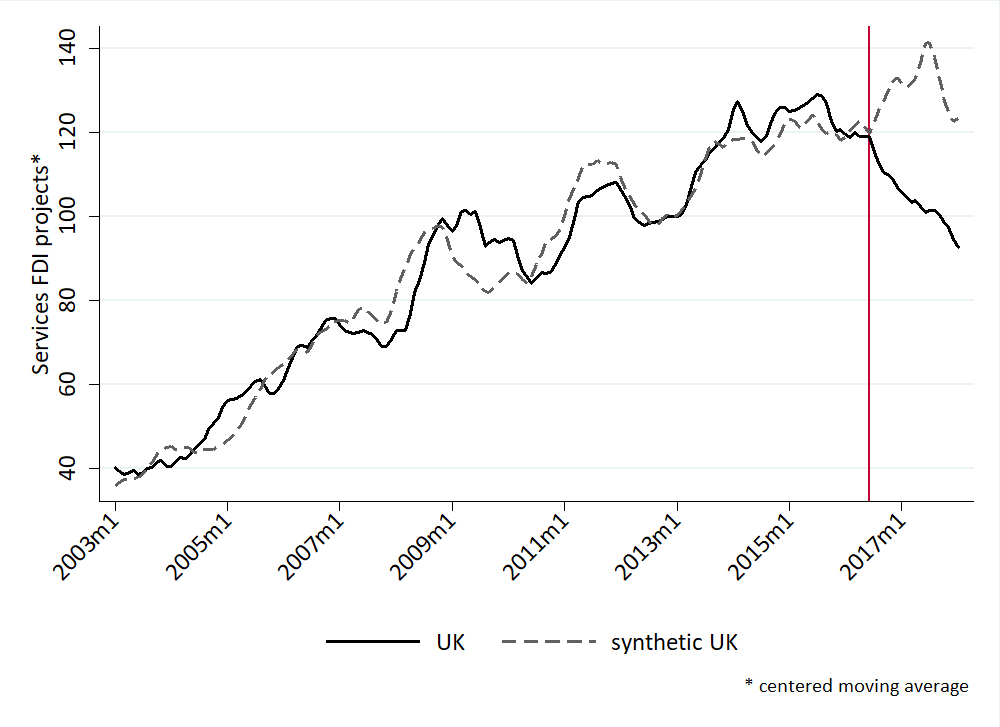
To see whether there is a difference in how investment in these sectors responded to the Brexit vote, we run the synthetic control method separately for manufacturing FDI and services FDI (see: Figure 5). We find that the Brexit referendum had a strong negative effect on inward investment in the services sector, which declined by some 25 per cent relative to the counterfactual ‘synthetic’ UK. In contrast, there is little evidence to suggest that the same has happened to manufacturing: both the ‘real’ UK and the ‘synthetic’ UK have recently experienced a drop in manufacturing FDI suggesting that this shock is unrelated to Brexit.
As described above, the majority of foreign investments in the UK are in the business services sector, with a big part producing software for companies. These investments belong to a highly competitive market and provide services that increase the productivity of domestic firms. Our findings have (at least) two implications: first, if these foreign firms leave the country permanently after Brexit, the British economy will suffer a potentially large negative productivity shock. Second, and more optimistically, if these businesses are effectively quick to react, they might just be waiting to see what the post- Brexit scenario is going to be and we can expect them to settle into a new equilibrium shortly after an agreement between the UK and the EU is (or is not) reached.
Multinational firms often form complex supply chains that involve a number of third-party suppliers, and in some industries (particularly automotive) they rely on just-in-time delivery systems. These cross-border supply chain linkages will become more complex, more time-consuming and more costly to coordinate if Brexit leads to checks at the border (which in some cases imply delays and are unpredictable).
It is plausible, therefore, that the investment strategies of multinational firms operating in global supply chains will differ from those of firms focussed on final consumers (B2C, business-to-consumer). The investment strategies of B2C firms are more likely to be market-seeking and tariff-jumping FDI, as opposed to supply chains firms, whose strategic objective is more likely to be about making their processes and operations more efficient and cost-effective. If this is true, multinationals in global supply chains may choose to cut down on their investment plans in the UK, more than B2C companies.
The recent survey of manufacturing firms by EURIS, [16] an advisory body of 13 trade organisations representing industrial product suppliers covered by the European Single Market, revealed that a third of respondents have already seen a fall in investment due to the Brexit vote. The report also mentioned that there is some evidence to suggest that EU27-based companies have started to remove UK based suppliers from their supply chains to eliminate / reduce the risk of losing preferential trade terms by falling under the 40 per cent EU content requirement.
To check whether supply chain multinationals are reacting more strongly to Brexit than B2C firms, we introduced a taxonomy of sectors that operate as part of supply chains and sectors that serve final consumer demand (B2C). [17]This categorisation of sectors is based on the industry categorisation in Delgado and Mills (2017), who use the percentage of value of output sold for final use by households (i.e. share sold to Personal Consumption Expenditure, PCE) as the criterion for distinction. [18] We further sub-divided supply chain and B2C sectors into manufacturing and services sectors to account for their very different nature; i.e. border delays and tariffs will matter more to manufacturers, while services will be more concerned about specific ‘behind the border’ regulations and requirements that affect the provision of services. [19]
At this stage, however, we do not find evidence that supply chain and B2C multinational firms have so far responded differently to the Brexit referendum result. Our analysis suggests that investment in both sectors have fallen, with this decline being of a similar order of magnitude. It is possible that any difference in investment strategies of these two types of investors will become evident at a later stage, as details and clarity about the future UK-EU relationship start to emerge.
Nevertheless, there are signs that some supply chain investors are becoming more concerned about Brexit. Inspecting data on supply chain services sector investment to the UK more closely, we discover that the sectors that drove this decline in FDI inflows included those related to the digital sector – such as ‘software publishers’ and ‘custom computer programming services’ – but also those in the financial and business services sector, such as ‘investment management’, ‘professional, scientific and technical services’ and ‘retail banking’. Disrupting supply chains is potentially costly for the UK: it puts at risk jobs in both multinational firms which may choose to relocate elsewhere, and also in domestic firms which may lose out on future contracts.
In this briefing paper, we have looked at how the UK has performed in attracting inward foreign investment since 2003, characterising the nature of inward FDI to the UK in terms of the sectoral make-up and the source of investment, but also comparing it to investment in European countries. Focussing on the trends in inward investment since the EU referendum date, we used the synthetic control method to test whether the outcome of the EU referendum has already had a detectable impact on multinational firms’ decisions to invest in the UK. It appears to have reduced UK inflows of FDI by around 16-20 per cent.
Admittedly, the UK continues to be a major destination for FDI (for example, it was the third largest recipient in the world in 2017, after the United States and Germany): however, its share of European FDI inflows has shrunk, and its overall inflow of FDI projects is some 16-20 per cent below what we would have expected it to be in the absence of Brexit. For services FDI, the gap is even larger: investment may be some 25 per cent lower compared to a situation in which the UK voted to remain in the EU.
There is little evidence to suggest that uncertainty about border and tariff arrangements between the UK and the EU has led to differential impact on investment by supply chain and B2C multinational firms. There are, however, signs of a slow-down in investment in sectors such as ‘software publishers’, ‘investment management’ and ‘retail banking’, which are arguably better able to respond quickly to shocks than manufacturing. With sectors such as digital and financial services being considered high value-added industries, this means that Brexit puts at risk high-skilled jobs and the productivity-enhancing effects that these sectors have on other industry.
As we said at the outset, it is difficult to speculate what will happen to inflows of FDI after the UK leaves the EU. The early indications of a slow-down in FDI that we have found may be temporary, caused by multinational firms holding off investing until they get clarity on what will happen after Brexit. But equally they may be permanent, reflecting expectations that the UK will be a worse location for business activity than previously. Such a permanent decline would very probably reduce UK productivity and incomes.
Leaving unanswered the question of whether the Brexit shock to FDI is of temporary or permanent nature, the bottom line is that there is already an indication that Brexit has diminished foreign investors’ appetite to invest in the UK.
1 UNCTAD, based on information from the Financial Times Ltd, fDi Markets.
2 Pitas, C. (2018) Japan Warns on Brexit: We Cannot Continue in UK Without Profit.
3 EY (2018) Game Changers. EY’s Attractiveness Survey. Europe June 2018.
4 Chu, B. (2018) Brexit: Damage to UK Economy Already Happening, According to New Foreign Investment Report.
6 There is approximately a three-month lag between a project announcement and a project appearing in the fDi Markets database. This time is required for a formal validation of projects with company sources by the data provider, which allows further company information to be captured. This means that at the time of publication we have access to FDI data for the period January 2003- July 2018.
7 This number also excludes retail FDI which is also tracked by the fDi Markets. Retail investments tend to involve single shops. Being low-productivity in nature and satisfying the final consumer demand, we chose to exclude these investments from the analysis.
8 The fDi Markets database uses its own bespoke definitions of sectors. A table that details how these sectors map to the Standard Industrial Classification (SIC) codes is available on request from the data provider. Other industry classifications in the fDi Markets database include ‘sub-sectors’ (more detailed than ‘sectors’), ‘clusters’ and ‘business activities’.
9 Data table with information on the number of inward FDI project announcements in the UK in top ten sub-sectors is provided in the online appendix.
10 ‘Japan’s Message to the United Kingdom and the European Union’.
11 See www.policyuncertainty.com for further detail on how the EPU index was constructed.
12 In the lead-up to the first set of EU referendum results being revealed, the sterling experienced an appreciation against the US dollar and the euro, followed by a strong depreciation as the Newcastle and Sunderland results were revealed. This suggests that the Leave result in the EU referendum was unexpected. In the online appendix to this briefing paper we also test alternative – earlier – ‘treatment dates’.
13 Following Jardón et al. (2018), the pre-treatment fit varies between 1 and minus infinity, with 1 being the perfect fit. Detail on the calculation of the measure of fit are in the online appendix.
14 An alternative interpretation is that had the UK not voted to leave the EU, it may have received 24 per cent more FDI projects than it has actually received since the EU referendum.
16 EURIS (2018) ‘Securing A Competitive UK Manufacturing Industry Post Brexit’.
17 Sectors such as ‘general purpose machinery’ and ‘corporate and investment banking’ are classed as supply chains, while sectors such as ‘cosmetics, perfume, personal care & household products’ and ‘accommodation’ are classed as B2C. The appendix provides full detail on this taxonomy of sectors.
18 Supply chain industries are considered those that sell most of their goods and services to other businesses and government, with one-third or less of their output sold for final use by households (PCE ≤ 33.3%). Categorisation is at the level of 6-digit NAICS industries (level somewhat similar to the sub-sector variable in the FT fDi Markets database) and based on the 2002 Benchmark Input-Output (IO) Accounts of the United States of the Bureau of the Economic Analysis.
19 Catalfamo, J. and Arts, L. (2018) ‘Outside the Single Market, What Kind of Deal Can Britain’s Services Sector Hope For? LSE Brexit blog.
Abadie, A. and J. Gardeazabal (2003) ‘The Economic Costs of Conflict: A Case Study of the Basque Country’, American Economic Review, 93(1):113-132.
Abadie, A., Diamond, A. and Hainmueller, J. (2010) ‘Synthetic Control Methods for Comparative Case Studies: Estimating the Effect of California’s Tobacco Control Program’, Journal of the American Statistical Association, 105(490):493-505.
Abadie, A., Diamond, A. and Hainmueller, J. (2015) ‘Comparative Politics and the Synthetic Control Method’, American Journal of Political Science, 59(2):495-510.
Baker, S.R., Bloom, N. and Davis, S.J. (2015) ‘Measuring Economic Policy Uncertainty’, Quarterly Journal of Economics, 131(4):1593-1636.
Bruno, R., Campos, N., Estrin, S. and Tian, M. (2016) ‘Gravitating towards Europe: An Econometric Analysis of the FDI Effects of EU Membership’, Technical Appendix to Dhingra, S., Ottaviano, G., Sampson, T. and Van Reenen, J. (2016) ‘The Impact of Brexit on Foreign Investment in the UK’, Centre for Economic Performance, CEP Brexit Analysis No. 3.
Delgado, M. and Mills, K.G. (2017) ‘A New Categorization of the U.S. Economy: The Role of Supply Chain Industries in Innovation and Economic Performance’, MIT Sloan School Working Paper 5241-16, MIT Sloan School of Management.
Disney, R., Miller, H. and Pope, T. (2018) ‘Firm-Level Investment Spikes and Aggregate Investment Over the Great Recession’, IFS Working Paper W18/08, Institute for Fiscal Studies, London.
Janicki, H. and Wunnava, P. (2004) ‘Determinants of Foreign Direct Investment: Empirical Evidence from EU Accession Candidates’, Applied Economics, 36(5):505–509.
Jardón, A., Kuik, O. and Tol, R.S.J. (2018) ‘Causal Effects of PetroCaribe on Sustainable Development: A Synthetic Control Analysis’, University of Sussex Working Paper, No. 09-2018.
Resmini, L. (2000) ‘The Determinants of Foreign Direct Investment in the CEECs: New Evidence from Sectoral Patterns’, The Economics of Transition, 8(3):665–689.
Singh, H. and Jun, K. (1995) ‘Some Evidence on Determinants of Foreign Direct Investment in Developing Countries’, The World Bank Working Papers, The World Bank, Washington, DC.
UNCTAD, World Investment Report 2018. Investment and Industrial Policies.
Data on foreign direct investment projects were sourced from the fDi Markets database, a service from The Financial Times Limited 2018. All Rights Reserved.
Launched in 2003, fDi Markets is a central bank of information on the globalisation of business. The service tracks crossborder greenfield investment across all sectors and countries worldwide, with real-time monitoring of investment projects, capital investment and job creation. fDi Markets is part of the fDi Intelligence portfolio of investment products and services. A division of the Financial Times, fDi Intelligence specialises in all areas relating to foreign direct investment (FDI) and investment promotion.
Briefing Paper 23 Online Appendix