
7 August 2018
Nicolo Tamberi is a Research Officer in Economics for the UK Trade Policy Observatory.
In a recent post on Brexit Central , Michael Burrage examines the growth of different countries’ exports to the EU12 over 1993-2015 and asks:
‘How can trading with the EU under WTO rules be the worst possible option when the exports to the EU of 15 countries which have been doing just that over 23 years of the Single Market have grown four times as much as those of the UK, despite all the tariff and non-tariff barriers they have faced?’
The answer is ‘easily’!
The first thing one should ask when looking at any growth rate is where did it start from? The growth in height of a thirty-three year old NBA player since 2012 is zero, while that of an infant school child is 100%. So who is taller – LeBron James or the child?
For well-known reasons, such as membership of the Customs Union and proximity, EU member states already traded heavily with each other at the start of the Single Market in 1993. By starting at such high levels, it is hard to imagine two-digit yearly growth.
The second question to ask is which countries account for the export growth? The overall growth of exports to the EU12 over the period 1993-2016 from twenty-two countries trading on ‘WTO-rules’ is 139%.[1] However, this hides substantial differences: China’s exports to the EU12 grew by 1555% in real terms, while the United States’ grew by 86%.[2] This is not because China had fifteen times better access to the EU, but because, for wholly separate reasons, China evolved from being a middling exporter to being the world’s largest.
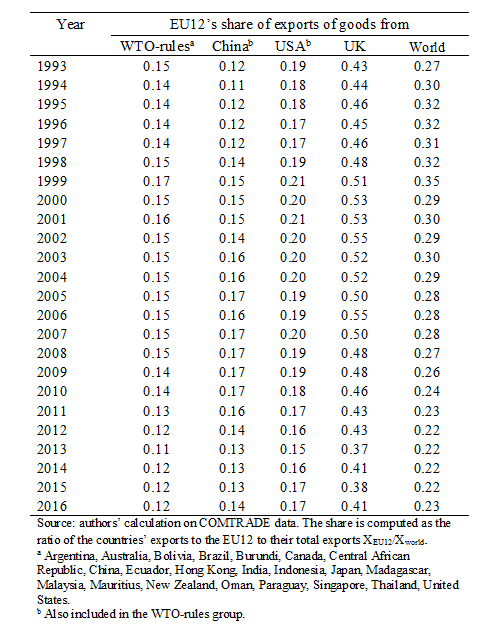
Allowing for countries’ overall growth in exports, a better indicator of changes in access to the EU12 market is to look at the share of the EU12 in those countries’ total exports. For example, although exports of WTO-rules countries to the EU12 grew by 139%, the share of these exports in non-FTA countries’ total exports decreased over 1993-2016, from 15% to 12% – see Table 1. The corresponding share for China increased a little, and declined a little for the United States and the UK.
Even more informative is to compare the share of the EU12 in these countries’ exports with the EU’s share of world imports (basically the share of the EU in all countries’ exports). As column 5 of Table 1 shows, this has declined since 1993 as other countries, especially the emerging markets, have grown faster than the EU. For the WTO-rules group and the United States, the export-shares to the EU12 have evolved at basically the same rate as EU imports in general, whereas for China and the UK they have grown more rapidly. The EU has liberalised its trade with China over the period and also with the UK, via the Single Market.
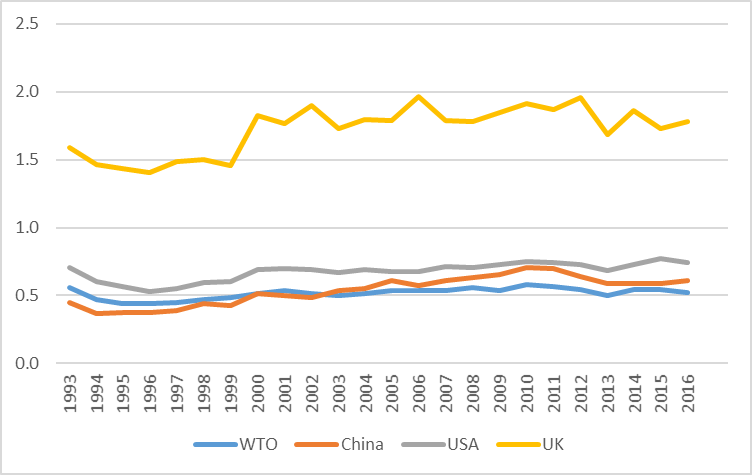
Figure 1 plots the shares of countries’ exports going to the EU divided by the share of world exports going to the EU.[3] As well as showing modest changes over time, it shows clearly that the share of the UK’s exports going to the EU12 is about three times as large as the share for other countries as a whole.
By themselves, export growth rates are entirely uninformative about the level of access that exporters have to a market. The UK has extremely privileged access to the EU market – a privilege that it will never get with any other trade partner.
[1] The WTO-rules group is a set of 22 countries that trade with the EU12 under WTO MFN rules. We restrict the set of countries so that we have data for every year and country from 1993 to 2016. The list of countries included in the group is given in the notes to the table.
[2] The growth rates are computed after deflating the trade values using the US GDP deflator. Data for deflator come from the World Bank.
[3] These ratios are also known as trade intensity indices.
Disclaimer:
The opinions expressed in this blog are those of the author alone and do not necessarily represent the opinions of the University of Sussex or UK Trade Policy Observatory.
Republishing guidelines
The UK Trade Policy Observatory believes in the free flow of information and encourages readers to cite our materials, providing due acknowledgement. For online use, this should be a link to the original resource on our website. We do not publish under a Creative Commons license. This means you CANNOT republish our articles online or in print for free.
This is a useful piece of analysis. Of course, its blindingly obvious that, as regards trade in goods, the EU reached maximum internal trade openess in 1993 when the Single Market came into operation and therefore one could hardly expect trade to grow as fast as with emerging markets. But the slogan that trade has grown faster under WTO terms that within the EU is a slogan, not an analysis.
A useful companion to this blog would be an analysis of the grown in FTAs. More and more countries are negotiating more and more FTAs, which suggests that governments around the world are not content with trading on WTO terms
When this blog was published, I wrote to BrexitCentral as follows:
Michael Burrage’s blog 2nd August
Dear BrexitCentral and Michael,
It is a shame that you do not have a space for comments on your blogs, or we would have responded to Michael through that. As it is, however, we have responded via a UKTPO blog, and since we do have space for comments, perhaps Michael would like to respond to us.
Best wishes,
Maybe surprisingly, while we continue to hear the arguments made by Michael Burrage, we have had no reply to our criticism.
I did not reply because I have only just seen your comment. 19th November at 00.09. I will of course reply,
Tick … tick … tick …