

 14 March 2019
Dr Michael Gasiorek is a Senior Lecturer in Economics at the University of Sussex and Julia Magntorn Garrett is a Research Officer in Economics at the University of Sussex. Both are fellows of the UK Trade Policy Observatory. L. Alan Winters CB is Professor of Economics and Director of the UK Trade Policy Observatory.
Key points:
Following the first defeat of the Withdrawal Bill in Parliament, and prior to yesterday’s vote on a ‘No Deal’ alternative, the Government published the temporary tariff schedule it proposes to apply in the event of a no deal. As with most things Brexit, this is complicated to unpick, especially as some of the listed items are simply asterisked, and the details on these need to be found in another (1400 page) document!
In this blog, we provide an early analysis of some of the key features of what the Government is proposing.
First, it is important to be clear about the current UK tariff structure. There are zero tariffs on imports from the EU (which accounts for about 54% of UK imports), largely zero tariffs on imports from all the countries the EU has Free Trade Agreements with (accounting for another 15% of UK imports); and largely zero tariffs on UK imports from those developing countries which the EU offers preferential access to under the Generalised System of Preferences. There are around 24 countries with whom the UK trades on Most Favoured Nation terms (call these the MFN partner countries). These countries account for around 25% of UK imports, of which around 40% is in products already facing zero tariffs.
The UK Government website states that 87% of UK imports (by value) would be duty free; we estimate that currently (under EU tariff rates) roughly 82% is tariff-free [54% from the EU + 15% from the EU-FTA partners + 40% of the 25% that pays MFN tariffs (=10%) + a conservative estimate that half the imports from developing countries eligible for the Generalised System of Preferences pay zero (=3%)]. So, in terms of import value, this (roughly 5 percentage points) is not a very large liberalisation.
Until we have the data to do the import value calculation more precisely, this blog focusses on the number of products, or ‘tariff lines’ in trade speak, that would be liberalised. The Government’s proposals mean that around 72% of the UK’s 8-digit tariff lines will see some reduction in their Most Favoured Nation (MFN) rates, many down to zero.[1] That would take the number of lines with a zero tariff up to 95% compared with about 26% at present – see chart below.[2]
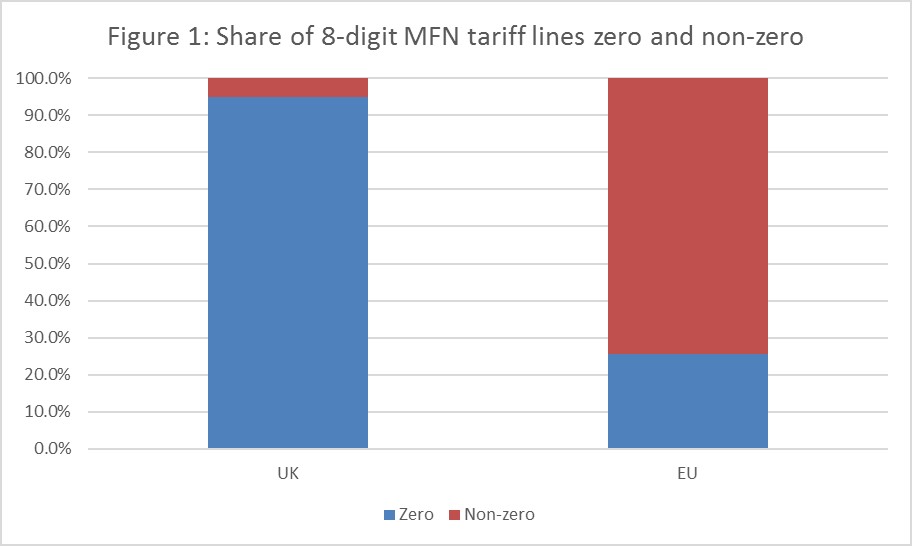
This leaves 5% of tariff lines where the Government has said it will retain tariffs. Of these, 2.8% will be staying at the existing EU level, for example, protection on sheep meat, textiles and clothing, and a range of motor vehicles, and the remaining 2.2% will see some reduction. The tariff reductions on these 2.2% appear to be based on set proportions of the existing EU tariffs, varying by product group. For example, the remaining UK tariffs tend to be around 13% of the current EU tariffs on pork, 60% of EU tariffs for poultry meat and 83% for most rice products.
Where are the remaining tariffs?
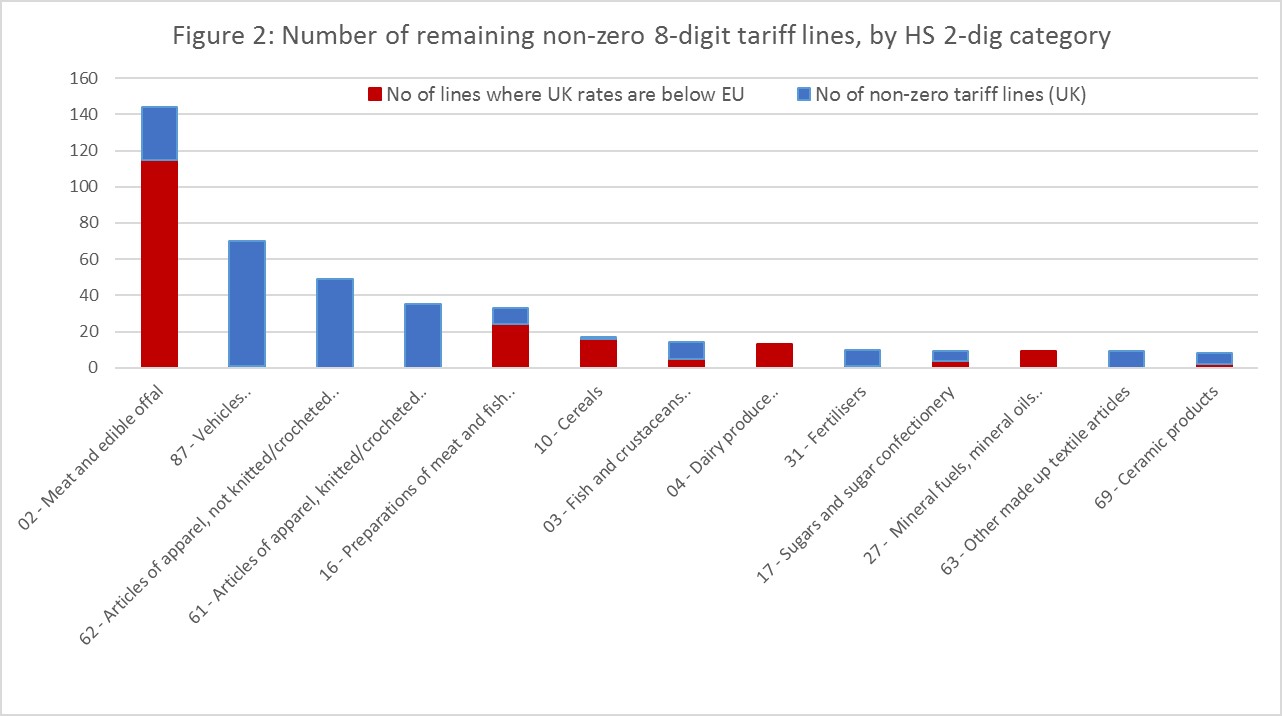
The chart below gives the number of non-zero 8-digit tariff lines summarised into broad sectors. This shows that the sector with the largest number of tariff lines remaining is HS 2-digit sector 02 (Meat and edible offal), followed by HS-87 (Motor vehicles). The chart also indicates for how many of these tariff lines the UK’s proposed rates are below what is currently being levied by the EU.[3] Hence, the first column indicates that in the HS 2-digit sector 02, the UK is proposing to retain positive tariffs for more than 140 8-digit tariff lines, and of these, the rate is lowered for 115. Conversely, if we take the second column, HS-87 there are 70 tariff lines where the UK is retaining protection, and for almost all of these tariff lines, the UK is proposing to keep tariffs at the same level as is currently levied. Clearly, some sectors retain protection across a relatively large number of products, but in most sectors, the protection is much more selective, or even absent. In addition to the 13 sectors listed in figure 2, there are a further 15 HS 2-digit sectors where some non-zero tariff lines exist. These sectors are not included in the chart as there arevery few (7 or fewer) positive tariff lines. The remaining 69 HS 2-digit sectors all have zero tariffs across the board in the UK’s tariff proposal.
A significant proportion of the non-zero tariffs are in specific, or two-part, form rather than ad valorem form, and this means that averaging tariffs across products requires a fair amount of approximation. (We discuss the difference and how to convert specific to ad valorem equivalents (AVEs) in our earlier blog). However, the UK schedule contains specific tariffs only where the EU one does, so we assume that the change in the AVE is the same as that in the specific tariffs.[4] This gives an overall simple unweighted average UK MFN tariff of 0.7%, significantly lower than the EU equivalent of 7.7%. Looking at only the UK’s non-zero tariffs gives an approximate average of 15%, compared with an average of 21.8% for the EU.[5]
Where are the zero tariffs and do they affect the degree of protection?
We now turn to those tariff lines where the UK is proposing that the temporary tariff should be zero. To see which sectors may be most affected by these changes we have summarised the average EU tariff at the HS 2-digit level (calculated based on the detailed 8-digit level).[6] For this calculation, we exclude the tariff lines discussed above where the Government is retaining some protection. The table below gives the ten sectors with the highest average EU tariff, given in the third column of the table. The next column gives the share of that sector in total UK imports, and the final column gives the share of imports in each sector which is not sourced from the EU or from any of the existing FTA partner countries, and hence which will benefit from a tariff reduction. We label this rest of the world (ROW).
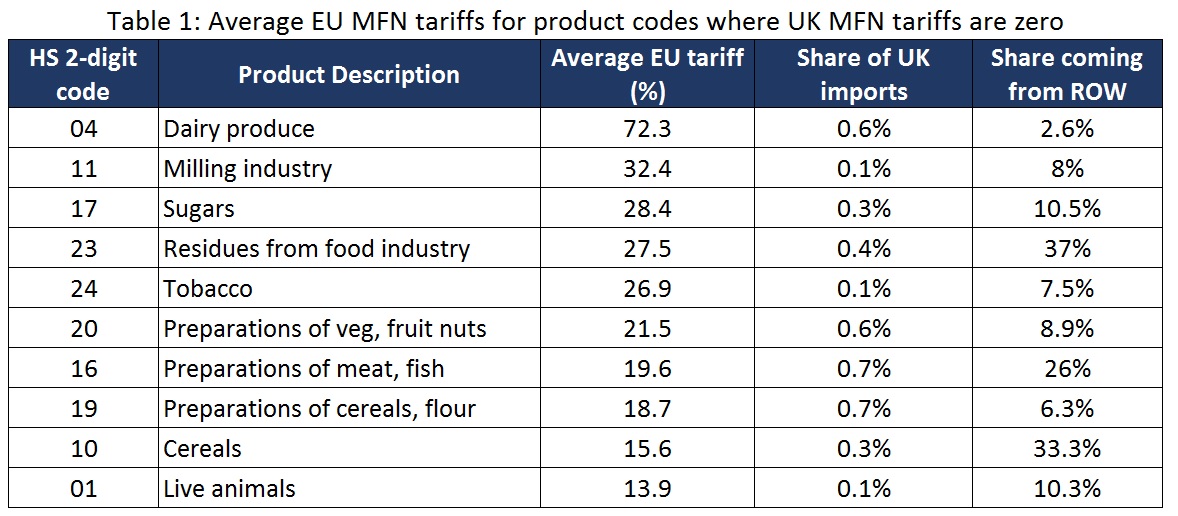
Hence, in Dairy Produce, the current average EU tariff on the products where the UK has gone to zero tariffs is over 70%; this sector accounts for 0.6% of UK total imports, and 2.6% of these import come from the rest of the world. This table goes some way towards explaining what is driving these proposals. Given the high shares of many of these products that are currently imported from the EU or from EU-FTA partner countries, imposing the existing tariff in a no-deal scenario could have a dramatic impact on the price of the products in the UK. By reducing MFN tariffs to zero, the UK is trying to avoid some of this pain.
However, it is also important to point out that just because currently there is small share of imports coming from the rest of the world, this does not mean that reducing MFN tariffs would have a small effect. It may well be that the reason the rest of the world is not supplying so much to the UK market is precisely because of the high tariffs we see in these sectors, and therefore liberalising these tariffs, could result in a substantial increase in imports from new partner countries and increased competitive pressure on UK producers.
What is the government trying to achieve?
The motives behind these tariff changes no doubt reflect a mix of objectives and pressures – concern about possible increases in prices of certain commodities such as agricultural products and food set against a desire to protect certain industries, such as cars; and the wish to maintain trade remedies where they already exist, such as in ceramics. These are valid concerns. However, even if the tariffs are reintroduced after a year there may be permanent effects on some suppliers, especially those in the sectors most exposed to increased competition, and once tariffs have been reduced it may be hard to reintroduce them. It is also worth noting that reducing many tariffs to zero may weaken the UK’s hand in subsequent negotiations of free trade agreements.
Finally, it is important to remember that tariffs are only part of the story. A significant number of tariff-lines in agriculture face tariff rate quotas (TRQs) as well as tariffs, and there are all the regulatory barriers and logistical frictions to factor in as well.
[1] MFN rates are the tariff rates applied to any third country which does not have a preferential trade agreement in place with the UK. In the event of a hard Brexit, this would include all countries except Chile, Faroe Islands, Palestine, Switzerland, Madagascar, Mauritius, Seychelles and Zimbabwe with whom the UK has agreed continuity agreements. It also would not apply to countries benefitting from the Generalised System of Preferences.
[2] Since the UK’s tariffs have been published at the 8-digit level of detail, this is the level used for these calculations. The numbers therefore differ slightly from those reported in our earlier blog, which were based on the 6-digit and 10-digit level.
[3] While both ad valorem and specific tariffs have been taken into account in this analysis, we have not looked in detail at any potential changes to tariff rate quota volumes.
[4] For example, if a UK specific tariff is half the size of the current EU tariff, then the UK is assumed to have an AVE equal to half the size of EU’s AVE for this product.
[5] These calculations are based on EU’s 2017 tariffs, including AVEs. The calculations are done at the 8-digit level, where tariffs for the EU have been aggregated from the more detailed 10-digit level. Perhaps surprisingly, the new UK schedule quotes specific tariffs in terms of Euros rather than sterling!
[6] Calculating the average at the 8-digit level sometimes yields higher results than if this was done based on less disaggregated tariff lines (e.g. at the HS 6-digit level). This is because tariff schedules tend to become more fragmented the higher the protection offered in order to tailor the restrictions to the exact products that governments feel need to be protected.
Disclaimer:
The opinions expressed in this blog are those of the author alone and do not necessarily represent the opinions of the University of Sussex or UK Trade Policy Observatory.
Republishing guidelines:
The UK Trade Policy Observatory believes in the free flow of information and encourages readers to cite our materials, providing due acknowledgement. For online use, this should be a link to the original resource on our website. We do not publish under a Creative Commons license. This means you CANNOT republish our articles online or in print for free.
The import of the changes as explained appears to be that some agricultural products from ROW – mostly cereals, pork, poultry meat, rice, and certain food processing inputs – will be subject to lower tariffs with attendant downward competitive pressures on prices paid by consumer – at least – in the short-term.
The main impact on domestic output and prices, I am assuming, will be the imposition of EU tariffs on UK exports of goods and agricultural products – presumably including met and fish, as well as key intermediate and final manufactured goods, such as vehicle components and assembly.
Would be useful to understand better the sectoral impact in that light.
Some very simple observations with some basic impacts:
(1) Before converting the flat rate elements of compound tariff lines into equivalent percentages, stop and look at the currency: in the DIT schedule these are denominated in Euros. This is not a big deal commercially, but in a post-Brexit world it means that the UK government will be rewarded when Sterling weakens against the Euro.
(2) There are severe operational constraints for food shipments that will make references to past patterns irrelevant, particularly for animal products. Port configurations across the UK, notably at Holyhead and Dover, do not have any available land for the construction of the inbound customs inspection facilities necessary to re-establish an external border.
(3) Outbound livestock and animal products from the UK into EU 27 will have to pass through a designated Border Inspection Post (BIP) at the point of entry. You can’t just turn up at a BIP, either: every consignment has to be booked in advance. For cross-Channel shipments, there are BIPs at Dunquerque, le Havre and Caen, but current throughput at the Dunquerque BIP is already at two thirds total capacity. So huge quantities of previously exported animal products will never leave the UK.
(4) Imagine, for a moment, that document checks on goods crossing the Irish border just happen automagically. This solves one problem, but we’re not out of the woods yet… For example, 25% of all the milk produced in Northern Ireland currently crosses the border for processing. But under schedule 80, EU duty on milk comes to just over EUR 200/tonne. Travelling in 30-tonne tankers the load which left the farmgate worth about £300/tonnne clocks up duty of more than EUR 5000 at the border. Nobody needs a fag packet to work out that with 70 truckloads a day, hundreds of exporting NI dairy producers will go to the wall in days.
Analysing the DIT tariff schedule in isolation gives undue weight to the fine tuning of a system that faces being torn limb from limb before our very eyes. Just In Time (JIT) logistical systems will be just part of the collateral damage that comes with the UK’s current Brexit strategy.
By deciding to leave the European Economic Area (EEA) the UK government is unilaterally choosing to revoke, inter alia, its ex officio membership of the Transit CTC transport scheme (for which it hastily re-applied in December 2018); it ends the international validity of countless supplier and organisational accreditations (in favour of basic third country status); not to mention losing the reciprocal EEA recognition of UK driving licences.
In fact the duty payable (if any) on a product may well take second place to being able to move it into or out of the country. JIT evolved over decades on the assumption that transport capacity is easier to come by than bricks and mortar warehousing. If we are ever outside the Transit CTC agreement this is emphatically no longer the case and the UK will have to resort to its allocation of CEMT international freight permits, which explicitly forbid cabotage.
However you slice or dice the CEMT numbers, the UK has an annual allocation of 1220 lorries. Running alternate outbound and inbound legs with outbound payloads of 22 tonnes – the CEMT permits expressly forbid cabotage – it would be possible to move just under 5 million tonnes of outbound. By way of comparison, Dover alone can shift eight times that tonnage in both directions. The idea that transport would remain as cheap as chips post-Brexit is at best unlikely. The future of JIT is equally untenable.
[…] Tariffs will be zero on around 95% of products (at the 8-digit level) – up from just 26% now – covering around 87% of current UK imports by value. As a result, even though tariffs will be levied on the EU (which is not the case now), the UK trade regime will overall become more liberal – currently, around 80% of UK imports are tariff-free (more detail from the UK Trade Policy Observatory is here). […]
[…] →CAP Reform: UK announces proposed applied tariff schedule in event of no deal Brexit →UKTPO: What should we make of the UK’s ‘No Deal’ tariffs? IEG Policy: European Council grants conditional Article 50 extension →Any extension of Article 50 […]
[…] CB is Professor of Economics and Director of the UK Trade Policy Observatory (14 March 2019). https://blogs.sussex.ac.uk/uktpo/2019/03/14/what-should-we-make-of-the-uks-no-deal-tariffs/ The full exchange in committee can be found here: […]
[…] Tariffs will be zero on around 95% of products (at the 8-digit level) – up from just 26% now – covering around 87% of current UK imports by value. As a result, even though tariffs will be levied on the EU (which is not the case now), the UK trade regime will overall become more liberal – currently, around 80% of UK imports are tariff-free (more detail from the UK Trade Policy Observatory is here). […]