
 29 July 2021
Yohannes Ayele is Research Fellow in the Economics of Brexit at the University of Sussex and Fellow of the UKTPO.
Since 1 January 2021, the UK’s trading relationship with its biggest and closest trading partner—the EU—has been governed by the Trade and Cooperation Agreement (TCA). Under the TCA, UK exports to the EU face zero-tariff and zero-quota. However, to claim zero tariffs, exporters must meet the rules of origin requirements and be able to provide proof of origin. Where exporters do not meet the requirements they end up paying the tariff. Even those exporters that can meet the rules of origin requirement, because of the cost of the paperwork and requirements for proof of origin needed to claim the zero tariff, they may instead choose to pay the tariff. The latter is more likely where the tariff preference margin (i.e., the difference between MFN non-zero tariff and the zero-tariff under TCA) is very low. These problems— the rules of origin requirements and costs associated to claim zero-tariff—could be particularly challenging for smaller companies. Therefore, in practice, firms may end up paying tariffs despite the zero-tariff and zero-quota deal under the TCA.
In this blog, we provide information on the extent to which tariff preferences provided under the TCA has been utilized by UK exporters over the first four months of 2021.[1] To do that we calculate the preference utilization rate (PUR) and tariff-free trade.
For the first four months of 2021, the value of UK exports to the EU still paying tariffs was between €5.2 billion and €6.98 billion. There is some uncertainty due to the amount of trade arriving under inward and outward processing regimes where it is unclear whether or not the tariff end up being paid.[2] The PUR for the first four months ranges from 66.7% to 72.6%. These numbers imply that between 27.4% -33.3% of UK exports to the EU that could have entered under zero-tariffs did not. It shows that despite the zero-tariff zero-quota trade agreement of the TCA, several exporters are actually paying tariffs.
Table 1 shows the values of the UK monthly export to the EU under each preference eligibility regime, the PUR, and tariff-free trade. The PUR in January 2021 was 59.4%, which increased to 65.4% in February, 68.5% in March, and 69.7% in April. While this shows an improvement in the preference utilization rate over the months, it is still at 70%. It means that a significant share of UK exports to the EU is paying a non-zero tariff. Although the PUR could increase if firms pay a tariff first and claim a refund later, the broader picture is most likely going to hold. The table also shows that tariff-free trade slightly increased to 84.8% in April starting from 81.1% in January.
| Period | year | MFN Zero | MFN Non-Zero | Preference Zero | Unknown | Utilization rate | Tariff-free trade |
| Monthly | January | 2701 | 1198 | 1753 | 702 | 59.40% | 81.10% |
| February | 4104 | 1844 | 3487 | 765 | 65.40% | 81.90% | |
| March | 5396 | 2200 | 4779 | 843 | 68.50% | 83.40% | |
| April | 5081 | 1744 | 4003 | 663 | 69.70% | 84.80% |
Looking at the aggregate PUR and tariff-free trade could hide substantial variation across sectors. For example, the complexity of the rules of origin requirement varies across sectors, which in turn may generate a differential rate of preference utilization by sectors. Table 2 and Table 3 show the preference utilization rate and tariff-free trade for the first four months of 2021 by broad sector categories, along with a column that shows the dominant rules of origin criteria in each sector.[3] The preference utilization rate is lowest for the textiles sector (37.9%) where specific processing rules of origin are dominant (66%). The utilization rate is highest in the materials and Agrifood sectors where wholly obtained rules of origin is dominant. Table 2 reports that except in the textile sectors, where the rate of preference utilization is unchanged, the PURs improved over the four months. Similarly, Table 3 shows that there is substantial variation across sectors in terms of tariff-free trade. For instance, in April the textile sector’s tariff-free trade is only 43.8% while it is more than 90% for AgriFood and Materials sectors.
| Rule of Origin | Jan | Feb | Mar | Apr | |
| Adv. Manufacturing & Machinery | CTC or VA (95%) | 28.1% | 41.4% | 45.2% | 49.8% |
| Agrifood | WO(54%) | 84.4% | 85.0% | 89.4% | 90.9% |
| Automotive | CTC or VA(43%) | 69.9% | 68.6% | 71.8% | 71.6% |
| Chemicals | Comb. Of 3 or more (82%) | 74.7% | 78.7% | 80.1% | 81.8% |
| Manufacturing & Electronics | CTC or VA (93%) | 36.1% | 43.4% | 50.3% | 53.0% |
| Materials | CTC or VA (45%) | 70.8% | 76.7% | 80.4% | 78.7% |
| Textiles | Specific processing rule (SP) (66%) | 36.4% | 43.2% | 36.6% | 36.3% |
| Rule of Origin | Jan | Feb | Mar | Apr | |
| Adv. Manufacturing & Machinery | CTC or VA (95%) | 56.5% | 61.6% | 64.1% | 66.0% |
| Agrifood | WO(54%) | 91.3% | 90.7% | 93.2% | 94.2% |
| Automotive | CTC or VA(43%) | 73.7% | 70.4% | 73.9% | 74.1% |
| Chemicals | Comb. Of 3 or more (82%) | 87.0% | 88.1% | 89.0% | 89.3% |
| Manufacturing & Electronics | CTC or VA (93%) | 79.4% | 79.1% | 81.7% | 83.0% |
| Materials | CTC or VA (45%) | 93.1% | 93.9% | 95.1% | 95.4% |
| Textiles | Specific processing rule (SP) (66%) | 49.1% | 52.1% | 44.5% | 43.8% |
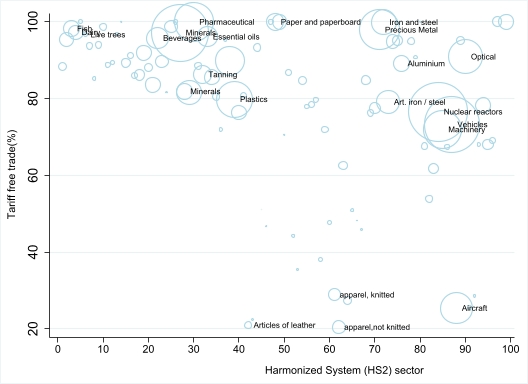
The scatter plots in Figures 1 and 2 provide the PUR and the tariff-free rates at a more detailed level of disaggregation for the first four months of 2021, using the 97 Harmonized System (HS2) sectors. The bigger the circle, the larger the share of the sector in total UK trade. The figures indicate substantial variation in PUR across some sectors. For instance, sectors such as Aircraft, spacecraft and parts thereof (HS2-88), apparel and clothing accessories, not knitted or crocheted (HS2-62) have a very low PUR. On the other hand, sectors such as fish and crustaceans, molluscs and other aquatic invertebrates (HS2-03), dairy products (HS2-04) and iron and steel (HS2-72) have a higher rate of preference utilization. With respect to tariff-free trade (Figure 2), articles of leather, apparels and clothing accessories sector (both knitted or not knitted) and Aircraft, spacecraft and parts thereof have the lowest tariff-free trade. On the other hand, sectors such as fish, dairy, iron and steel have the highest tariff-free trade share, although they are not the major exporting items of the UK to the EU. In summary, the two figures and the previous tables show the large variation in the PUR across sectors.
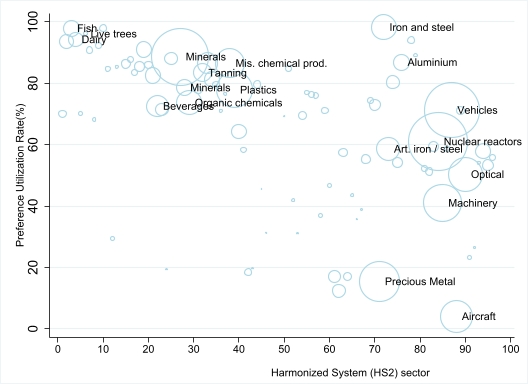
Note: Selected sectors with a high share in total exports and some of the sectors with high PUR are labelled.
Finally, Table 4 is based on even more disaggregated data and shows the number of 6-digit products (of which in total there are over 5000) under different categories of PUR and tariff-free trade. Hence, for example, the first row shows that there are 508 products where the PUR was less than 10%, and 307 products where less than 10% of UK exports to the EU were tariff-free. In total, there were 1657 products for whom the preference utilization rate is below 50%.
| Percent | # HS6 product | |
| PUR | Tariff-free trade | |
| 1-10% | 508 | 307 |
| 10-20% | 319 | 266 |
| 20-30% | 267 | 241 |
| 30-40% | 264 | 248 |
| 40-50% | 299 | 300 |
| 50-60% | 305 | 330 |
| 60-70% | 310 | 324 |
| 70-80% | 382 | 392 |
| 80-90% | 418 | 490 |
| 90-100% | 637 | 2379 |
| Total | 3709 | 5277 |
In summary, trade under the TCA is supposed to be zero-tariff. However, early evidence indicates that substantial exports of the UK to the EU are paying a tariff. The evidence also shows that there is a significant variation in the preference utilization rate across disaggregated sectors.
[1] First, the trade values are from Eurostata and it is largely different from the HMRC and ONS trade, for more information see https://www.sussex.ac.uk/webteam/gateway/file.php?name=wps-09-2021.pdf&site=24.
[2] For the first four months, the preference utilization is highest in Greece at 85.7%, followed by Slovakia (83.9%) and Hungary (83.4%). The lowest preference utilization rate is from Luxembourg (47.7%), Cyprus (48%) and Germany (48.6%).
[3] For an explanation of each of the RoO, see UKTPO Briefing Paper 52: https://blogs. sussex.ac.uk/uktpo/files/2021/01/Briefing-paper-52.pdf