

 27 January 2022
Michael Gasiorek is Professor of Economics and Director of the UK Trade Policy Observatory at the University of Sussex and Guillermo Larbalestier is Research Assistant in International Trade at the University of Sussex and Fellow of the UKTPO.
The crisis between Ukraine and Russia is deeply concerning – for the people of Ukraine, but also in terms of broader ramifications for world order and stability. NATO’s strategy to avoid direct military action against Russia points at diplomacy and economic sanctions. It is therefore useful to consider the possible role of these in the realm of international trade.
As we show below, Russian trade is highly dependent on the EU and NATO member states. Hence, the scope for the use of such policy is there. This is not an argument, however, for so doing – as that involves complex political trade-offs (which are beyond the scope of this blog). The importance of Russia as a supplier in particular sectors, notably energy, and hence the dependence of the EU and NATO member states on Russia is also a factor in those trade-offs.
Economic sanctions against Russia are not a novelty. Following the Russian annexation of Crimea in 2014, sanctions were introduced – involving a mix of actions directed against individuals and specific entities. In the UK, this is set by the Russia (Sanction) (EU Exit) Regulations 2019, which came into force on 31 December 2020. These entail financial restrictions – be this on investment, or the freezing of financial assets – immigration sanctions with regard to particular individuals, prohibitions on technology transfer and technical assistance, and highly targeted trade sanctions. This policy is primarily aimed either at individuals (where presumably the hope is that they may try and influence policy in Russia) or with regard to military technology.[1]
Growth of the Russian economy has been low since 2014 with reports attributing this partly to the sanctions, which may also have served to delay further Russian advances into Ukraine.[2] Korkhonen (2019) summarises findings from various independent studies that quantify the effect of sanctions on Russia’s GDP at -1.2% and -1.5%. In Figure 1 below we depict how Russia’s foreign trade has changed over time, which prima facie reveals the impact of the existing sanctions on trade.[3]
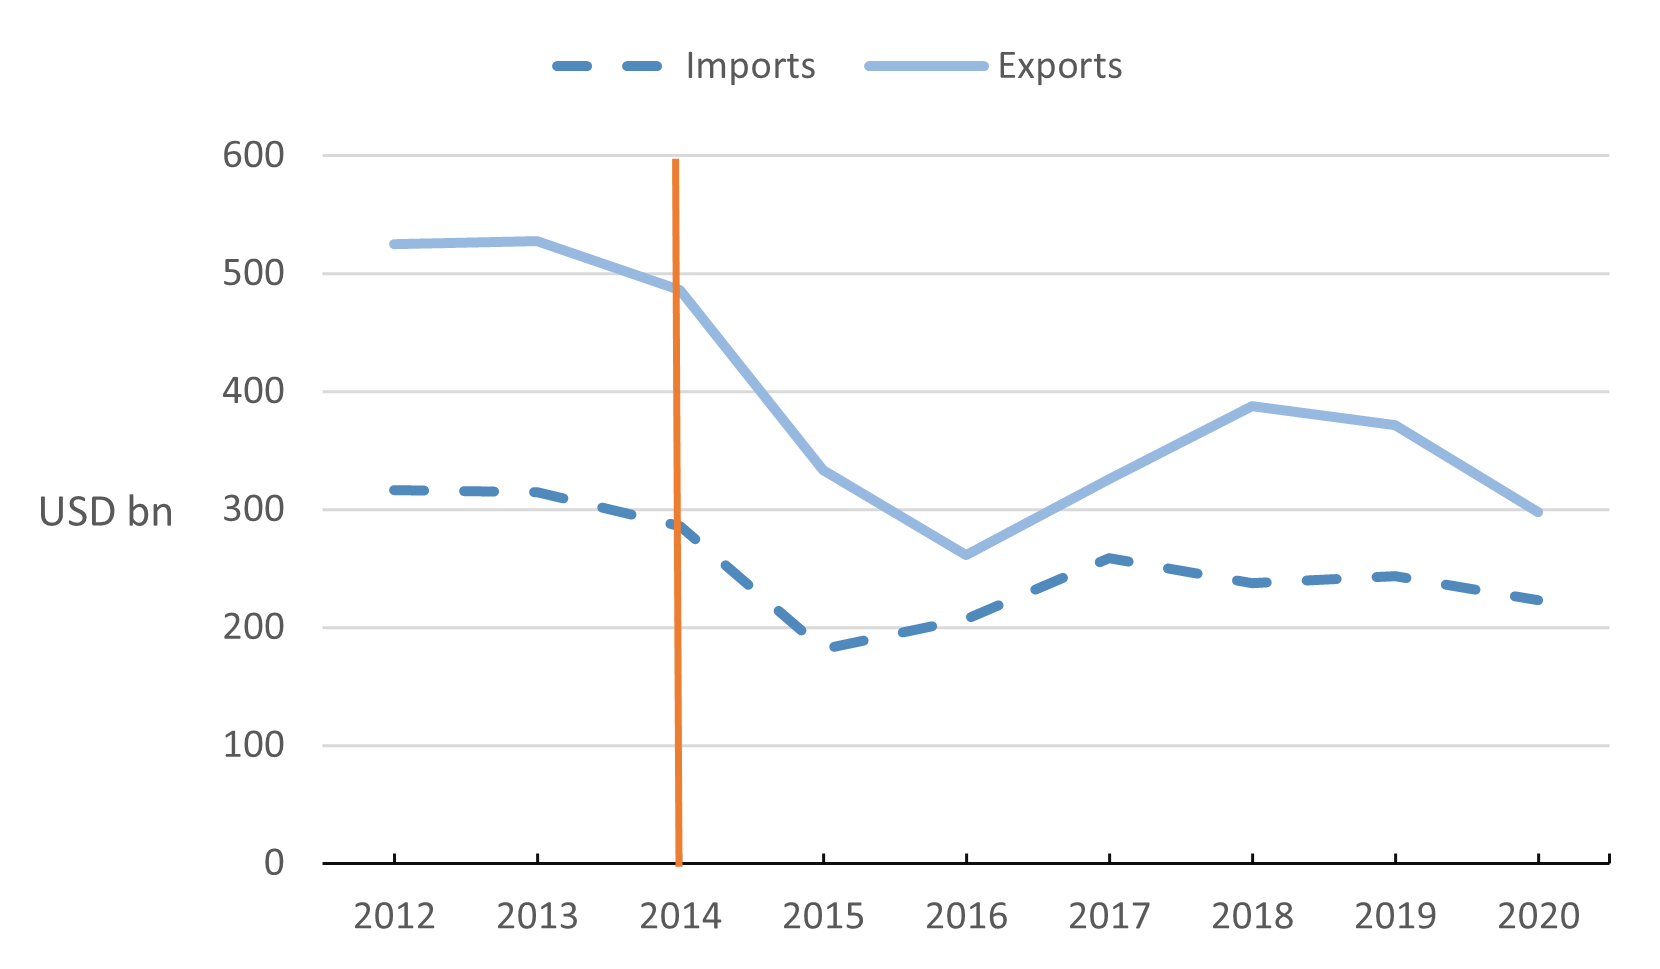
Data Source: UN Comtrade, 2012-2020.
What more could be achieved through wider-ranging trade and economic sanctions? Presumably, and in good part, this will depend on the relative importance, for Russia, of trade and investment with NATO member states – and other allies that would follow suit.
To explore this, consider the trade linkages between Russia and NATO member states. Despite the existing measures and sanctions, these are substantial: in 2020 the share of Russian exports going to NATO countries was 44%; to the EU and the UK almost 40%; and to the USA approximately 3%.[4] Similarly, 38% of Russia’s imports come from NATO member states; 35% from the EU, and just over 4% from the US. Given that trade as a share of GDP for Russia in recent years is close to 50%[5], wide-ranging trade sanctions could therefore have a significant effect on economic activity in Russia.
The total figures contain considerable sectoral heterogeneity. Table 1 lists Russia’s most significant imports by value and by sector (as defined by HS chapters) and their corresponding share in Russia’s total imports. The middle column of the table also lists the share of Russian imports in each sector coming from the EU (vis-à-vis the rest of the world), and the last column gives the share of Russia as a destination for total EU exports in each sector.[6] We see, for example, that 19% of Russia’s imports in 2020 were of nuclear reactors, machinery and parts thereof. In that sector, 43.5% of Russian imports came from the EU; and only 2.8% of all EU exports in that sector went to Russia. Note the 0% of Russian imports of HS08 products from the EU is in line with Russia’s own embargo of most products in this sector in retaliation to the 2014 EU sanctions. The last column on the share of EU exports to Russia for each sector (also relative to the ROW), reveals the much smaller EU dependence on Russia as an export destination for these products.
| RUS Imports – sector share of total imports | EU share of Russian imports by sector | EU exports to Russia as share of EU total exports by sector | ||
| 84 | Nuclear reactors, boilers, machinery and mechanical appliances; parts thereof | 19.4 | 43.5 | 2.8 |
| 85 | Electrical machinery and equipment | 13.6 | 21.3 | 1.5 |
| 87 | Vehicles other than railway… | 8.3 | 42.4 | 1.3 |
| 30 | Pharmaceutical products | 4.9 | 65.2 | 1.9 |
| 39 | Plastics and articles thereof | 4.2 | 47.4 | 1.8 |
| 90 | Optical, photographic, cinematographic, medical or surgical | 3.6 | 36.4 | 2.1 |
| 73 | Articles of iron or steel | 2.5 | 36.5 | 1.5 |
| 08 | Edible fruit and nuts; peel of citrus fruit or melons | 2.3 | 0.0 | 0.3 |
| 29 | Organic chemicals | 2.1 | 35.0 | 0.9 |
| 62 | Articles of apparel and clothing accessories, not knitted or crocheted | 1.7 | 12.1 | 2.2 |
| Column (1) is calculated as the value of Russian imports for each sector divided by total imports (i.e., from the world); Column (2) as the value of Russian imports from the EU divided by total imports for each given sector. Column (3) as the value of EU exports to Russia divided by total exports for each given sector. Table prepared using the TradeSift software with UN Comtrade data for 2020. | ||||
There are numerous sectors where Russian reliance on the EU for imports is considerably higher than the figures in Table 1. This includes, for example, cork products (HS 45) where we find that over 92% of Russia’s come from the EU. This sector, however, only makes up 0.02% of Russia’s total imports in 2020. Interestingly, many of the sectors where Russian reliance on imports from the EU is high are consumer goods sectors, and hence any impacts would probably be quickly felt by the people in Russia, even if these sectors do not make up significant shares of Russia’s total imports.
Table 2 considers analogous information but now looks at Russia’s exports and its reliance on the EU market as a destination. The median share of these products to the EU is around 30% (similar to imports), but a notable difference is that there is a heavier emphasis on raw materials and sectors predominantly made up of intermediate inputs. Notably, 47% of Russia’s most important export, i.e., mineral fuels (HS 27), were destined to the EU.
| RUS Exports – sector share of total imports | EU share of Russian exports by sector | EU imports from Russia as share of EU total imports by sector | ||
| 27 | Mineral fuels, mineral oils and products of their distillation | 47.7 | 46.9 | 17.8 |
| 71 | Natural or cultured pearls, precious or semi-precious stones, precious metals | 10.2 | 72.5 | 12.2 |
| 72 | Iron and steel | 5.7 | 24.0 | 4.1 |
| 10 | Cereals | 3.4 | 2.9 | 0.6 |
| 84 | Nuclear reactors, boilers, machinery and mechanical appliances; parts thereof | 2.8 | 16.3 | 0.2 |
| 44 | Wood and articles of wood; wood charcoal | 2.8 | 30.2 | 5.1 |
| 31 | Fertilisers | 2.4 | 27.8 | 11.6 |
| 74 | Copper and articles thereof | 1.9 | 38.6 | 2.9 |
| 76 | Aluminium and articles thereof | 1.8 | 35.0 | 3.6 |
| 03 | Fish and crustaceans, molluscs and other aquatic invertebrates | 1.6 | 20.9 | 1.7 |
| Column (1) is calculated as the value of Russian exports for each sector divided by total exports (i.e., to the world); Column (2) as the value of Russian exports to the EU divided by total exports for each given sector; Column (3) as the value of EU imports from Russia divided by total imports for each given sector. Table prepared using the TradeSift software with UN Comtrade data for 2020. | ||||
The importance of mineral fuels raises the flip-side of the issue – which is concerned with the importance of Russian supplies for the EU (and the US or NATO more broadly). Mineral fuels are indeed the EU’s most important import from Russia. In 2020 they represented nearly 60% of the EU’s total imports from Russia. In turn, these imports accounted for 18% of the EU’s total imports of mineral fuels from all countries (refer to Column 3 in Table 2).
More widely, Eurostat (the EU’s statistical agency) estimates that the EU’s energy dependency rate, defined as “the proportion of energy that an economy must import”,[7] is close to 60%. Russia is the EU’s main supplier of crude oil, natural gas and solid fossil fuels,[8] with shares standing at 27%, 41% and 47%, respectively, for 2019. Add to this the future supply of gas via the controversial Nord 2 gas pipeline, which would further increase dependence on Russia, the trade-offs are even more complicated. All this does raise serious questions about the advisability of a policy of reliance on energy supplies from a regime such as Russia. To address this the US has reportedly been in talks with Qatar about supplying natural gas to the EU.[9]
In today’s highly globalised economy, economic sanctions can potentially play a pivotal role that impacts economic activity and trade, and thence in defusing situations of conflict. Part of that toolkit of economic sanctions is to restrict trade flows. One drawback of such a policy is that it directly has an impact on all of Russian society, and is not ‘targeted’. There is also the possibility that the sanctions simply lead to a switch of imports from alternative suppliers, and exports to alternative destinations. Given the shares of the EU in Russian trade, this is probably not a major consideration but does need to be factored into the analysis.
More generally, for economic sanctions to work, whether they are directed at trade or investment, in good part they aim to impact the overall level of economic activity. Policy targeted at individuals may be less effective. This is not to advocate the use of trade sanctions in this instance as this involves complex judgements regarding the political and military responses that may follow. What we show, however, is that Russian trade is highly dependent on the EU and NATO and hence the scope for the use of such policy is there; and is another option to the military alternative. Leaving aside the political and military consequences even this cursory look at the data shows that the sectors where EU sanctions would hurt Russia the most are also those sectors where it would probably also hurt itself, and more specifically with regard to energy supplies. The same could be said for Russia, where its own leverage is also a weakness.
[1] For a timeline of “All Russia-Related Sanctions”: https://www.rferl.org/a/russia-sanctions-timeline/29477179.html
[3] On the effects of the sanctions on international trade, Korkhonen (2019) refers to Crozet and Hinz (2019) who estimate that Russia lost USD 54 bn in exports in the period 2014-2015, and Belin and Hanousek (2019) who estimate that Russian exports were USD 10.5 bn smaller at the end of 2016. Cheptear and Gaigne (2018), and Fritz et al. (2017) estimate falls in EU exports to Russia, the latter quantifying the effect at 11%.
[4] Note that not all EU members are NATO members.
[5] Source: World Bank, World Development Indicators
[6] We focus on the EU here, as trade policy for EU NATO countries is an EU competence. The statistics for NATO as a whole are highly comparable.
[7] More info: “It is defined as net energy imports (imports minus exports) divided by gross inland energy consumption plus fuel supplied to international maritime bunkers, expressed as a percentage. A negative dependency rate indicates a net exporter of energy while a dependency rate in excess of 100 % indicates that energy products have been stocked.”
[8] https://ec.europa.eu/eurostat/cache/infographs/energy/bloc-2c.html
[9] https://www.aljazeera.com/news/2022/1/22/us-in-talks-with-qatar-over-supplying-lng-to-eu-reports
great post thanks for sharing
[…] Link: UKTPO: The Ukraine-Russia Crisis and Possible Trade Sanctions […]