The effects of a ‘No deal’ Brexit
A great deal of attention and debate has been devoted to the consequences of different forms of post-Brexit trade policy for UK exports. Exports are important but not in their own right – indeed at its most basic, exporting amounts to putting goods in a container and waving them good-bye! But exports are important because they allow us to buy imports and because, more generally, they generate income.
In terms of buying imports, we need two further pieces of information in order to assess the value of an export. First, we need to know how many imports the export will buy: an increase in the sterling value of exports does not increase UK welfare if it is offset by an increase in the sterling price of imports. Hence, satisfaction with the growth in UK exports since the Brexit referendum should be muted because being largely the result of the effect of the devaluation on prices in sterling terms, the increase in terms of the imports they buy is much less. In the year to the first quarter of 2019, UK exports were 24.6% higher than three years previously in sterling terms but only 8.5% higher in terms of dollars (ONS Balance of Payments and Exchange Rate data, consulted 11th July 2019).
Second, we need to know the extent to which the exports depend on inputs of imported goods or services because these need to be netted out in order to see the extent to which the exports arise from economic activity in the UK and hence generate income in the UK. This Briefing Paper deals mainly with this issue – it asks not only how much income do UK exports generate but in what sectors. To give a concrete example, producing and selling an industrial pump requires inputs of parts, various services (like accounting and marketing), labour, management, machinery and rents, and all the parts similarly require such inputs. We aim to trace all these inputs through the economy (after netting out imported inputs) to see who exactly is producing the value embodied in UK exports. And who, therefore, would experience a decrease in income if exports (say, of pumps) were to fall.
To do this, we need to unpack value chains – the fact that most goods are made from other goods – rather than purely from the activity of labour within the sector from which the final sale is made. Value chains have existed nearly forever – even the farmer in a near subsistence economy typically buys in some of his/her tools and possibly also seed and fertiliser. What makes understanding them so important now is their depth (the number of steps now required in producing a completed good) and their breadth (the geographical spread of these various input-output relations).
In terms of Brexit, the first challenge is to identify which sectors and countries create the value that is embodied in UK flows of exports and imports as traditionally measured, and hence to identify how changes in the conditions under which such trade is conducted will affect the value contributed (i.e. the incomes generated) by different countries.
To do this we use four important concepts of value added (VA) in an exported good or service. The online Appendix (Section 2) gives examples of these:
i) Domestic value added (DVA)
This is the value originating in all sectors of the UK economy that is embedded in a given UK sector’s exports. It includes the value originating in the domestic exporting sector (direct DVA) plus that originating in the UK sectors providing its inputs. (We refer to such inputs as intermediate goods or intermediates.)
From the individual sector’s perspective, we also need to recognize indirect DVA, i.e., the DVA from that sector that is embodied in other sectors’ exports.
ii) Foreign value added (FVA)
This is the value of imported intermediate inputs embodied in UK exports, and represents the import content of exports. It is sometimes referred to as the backward linkage in global production networks because it reflects linkages back up the value chain towards its origin. The foreign value added in exports includes some that is exported back to its country of origin.
iii) Double counting (DDC)
Sometimes the foreign intermediates will include value originating in the UK, but we need to count this only the first time it is exported and not the second time when it is embodied in another UK export.
iv) Multilateral domestic value added (DVAM)
This is defined as UK value added contained in intermediate goods and services that is exported to one country which then re-exports it, embodied in other goods or services, to another. DVAM provides a measure of the UK’s forward linkages from selling in global value chains (GVCs).
Measuring these linkages is complicated and relies on a number of assumptions. The most important is a so-called proportionality assumption. To illustrate, we know from published data what the proportion of the value of cars is made up of steel. We have to assume that this is the same for all UK-produced cars, whether they are sold on the domestic market or exported. We also know how much of the steel used in the UK comes from each country (including the UK) and we have to assume that each use of steel is spread over sources in exactly those same proportions. Because these assumptions are bound to be violated in detail, the results they support will be only approximations, but equally, because they are based on real aggregates, they are not likely to be grossly misleading. More details of the assumptions are given in the online Appendix (Secn. 1)
The data we use are drawn from version 9 of the Global Trade Analysis Project (GTAP) Data Base, a baseline of consistent data on consumption, production, and trade for 121 countries in 2014.[1] For our calculations, we aggregate the 121 countries into 10 regions: the UK (United Kingdom), France, Germany, Italy, the remaining 24 members of the EU, FTA67 (comprising the 67 countries with which the EU has signed Free Trade Agreements),[2] China, Japan, the United States, and the rest of the world (all the remaining countries in the dataset). When we present the results, however, we distinguish just four geographical groups: the UK, the EU27, FTA67 and the rest of the world (ROW). In the calculations, we use the most detailed sectoral aggregation available in GTAP (55 products), but, similarly, when we present the results we do so for just ten aggregate sectors (see Appendix Secn. 3).
Much concern has been expressed about the immediate impact of a ‘No deal’ Brexit on 31st October 2019, in terms of disrupted logistics. Our focus is longer term, asking what ‘No deal’ will look like once the practicalities of trade have been sorted out. As noted, the baseline for our experiments is 2014, so, we are in effect, asking what effect Brexit would have had if it had become fully operational by then. We are not offering predictions for the early 2020s, but rather identifying some of the Brexit-related forces that, in addition to the trends in and shocks to the world economy and future changes in government policies, will shape the future.
Figure 1 shows UK exports and imports with the three overseas groups of countries both in gross terms (the total value of exports or imports, which is the concept that is usually reported) and in terms of value added (VA). Three features are evident.[3] First, VA trade is smaller than gross trade – that is, some of the value of gross exports derives from the foreign value added embodied in the intermediate inputs used rather than from UK activity. Similarly, some of the value of UK gross imports derives from the UK value added embodied in the intermediates that foreign exporters use. Second, imports always exceed the corresponding exports – the UK has a trade deficit with each of these three aggregations of partners. Third, for the FTA67 and ROW, the VA deficits exceed the gross ones, whereas the opposite is true for the EU27. This is because imports from the EU have a larger share of reflected value added than do imports from elsewhere (i.e. the UK VA embodied in £1 of UK imports from the EU27 exceeds that embodied in £1 of imports from elsewhere) and because the composition of UK exports to the EU is biased towards sectors that have relatively large shares of Domestic VA in total value.
Figure 1: UK Trade 2014: Gross and in Value Added ($ billions)
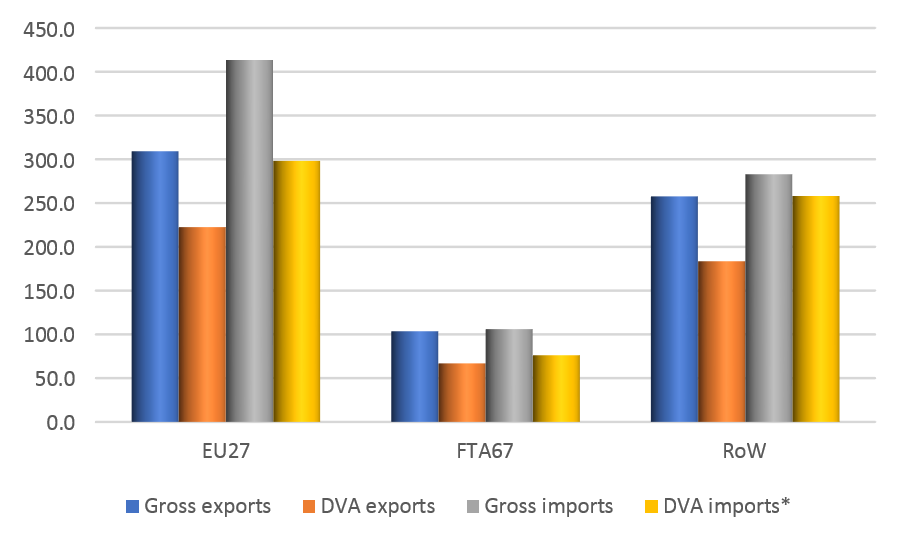
* DVA imports represent the exporters’ DVA in their exports to the UK.
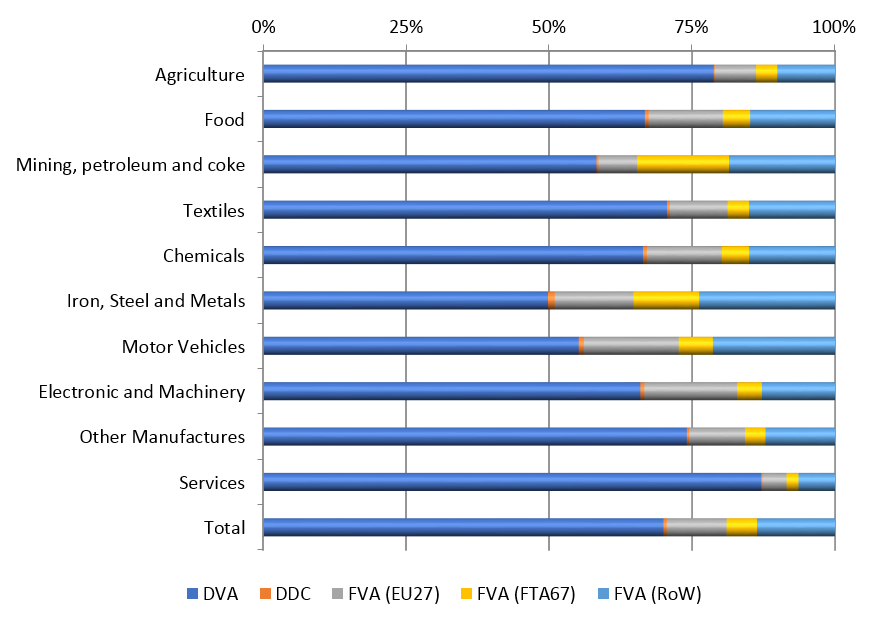
In Figure 2 we decompose each (aggregate) sector’s gross exports to identify the origin of their value added. This reveals the extent to which UK exports depend on imported inputs of goods and services. This dependency is sizable – about 30% in total, of which about one third (10%) originates in the EU27 and one-sixth (5%) in the FTA67. Thus if imports from the EU27 and the FTA67 were hindered by Brexit, imports equivalent to around 15% of the value of exports could face new barriers and thus become more costly. The sectors with the highest overall shares of Foreign VA in UK exports are basic metals (more than 50 per cent), motor vehicles (about 45 per cent), and coke and petroleum etc. (more than 40 per cent). The sectors that embody the largest shares of EU27 VA are motor vehicles, electronic and machinery products, and basic metals (17, 16, and 14%, respectively).
Figure 2. UK’s exports: value added composition by sector
While backward linkages look at the foreign content from other countries embedded in the UK exports, forward linkages look at where the UK domestic VA is absorbed and capture the value contained in the UK’s inputs sent to other economies for further processing and export through the value chain.[4]
A second indicator of the UK’s integration with the EU27 is the multilateral domestic VA (DVAM), i.e. the UK domestic value added reaching its final destination via another country. It provides a measure of the importance of ‘Factory Europe’ as a hub for UK firms to reach export markets. On average, 73% of the UK value added that reaches an EU27 market via an intermediate trading country goes via another EU country. For FTA67, 54% goes via an EU27 country and for ROW around 37% does. That is, for UK exports of multilateral domestic value added, the EU27 (Factory Europe) is the key facilitator.[5]
This study is based on a standard computable general equilibrium (CGE) model of the world economy from the Global Trade Analysis Project (GTAP) Consortium (Hertel and Tsigas, 1997). Traditional CGE models assess changes of trade flows in gross terms. We use a separate GTAP module to back the sources of value added out of the traditional results.[6] Thus, just as with other Brexit simulations (for example, Ebell and Warren, 2016 or UK Government, 2018), we consider changes in trade policies, which are implemented on gross trade flows (e.g. a tariff is levied on the whole value of an imported car), but we then decompose the results to examine their implications for international flows of value added. These will show that conclusions based on gross flows alone may be misleading about some of the effects of Brexit.
Like all models, ours is a simple representation of the actual economy, based on a number of assumptions – see Appendix (Secn. 1). Thus its results are indicative rather than precise, but, given that the main determinants of the results are the structures of each economy (which we know) and the assumed changes in trade barriers (i.e. the shape of Brexit, which we have to assume), they are soundly based.
In this paper, we model only a ‘No deal’ Brexit. Almost no-one wants it, but everyone – including the UK’s new Prime Minister – accepts that it is among the probable outcomes. We define a ‘No deal’ Brexit as the UK
The UK has, in fact, rolled over a dozen of the EU’s FTAs, but accepts that it cannot do so in a number of significant cases, such as Canada and Turkey. As of early July 2019, the roll-overs cover rather less than half of the trade currently covered by EU agreements.[8] The Government also intends to sign new agreements, but this is not an easy task and so we assume that for a few years there will be none. These assumptions are a little pessimistic, but it is well understood that ‘ordinary’ FTAs with relatively distant countries do not generate very much additional trade, so this is not a major reservation.
Leaving the EU Customs Union and the Single Market necessarily entails an increase in the costs of UK-EU trade (in each direction) because it will introduce the need to certify conformity with local standards, statistical requirements, separate VAT systems, etc. and also rules of origin if an FTA is eventually signed with the EU. Trade with FTA67 and the ROW already face these costs and that will not change. Modelling these new trade costs is a methodological challenge, not least because the quantification needs to be consistent with the treatment of trade costs provided by the GTAP model. While GTAP provides a treatment of trade costs, they have never been quantified in the form which it requires.[9] Briefly, we proceeded as follows – more details are given in the Appendix (Secn. 4).
Based on the secondary literature and the approach in Gasiorek, Serwicka and Smith (2019), we assume, conservatively, that the new border formalities would be equivalent to a new non-tariff barrier that increased the cost of trading goods between the UK and the EU by 3.5% of the value of the transaction. We conducted a simulation assuming this value and then used the model to calculate the increases in GTAP trade costs that produced the same overall effect on UK international trade. These turned out to imply that a ‘No deal’ Brexit would absorb 5.1% of the value of a UK export transaction in trading costs and 4.1% for UK imports.
Brexit will have at least three distinct effects. First, the increase in trade costs between the UK and the EU will lead each party to import less from the other and more from other foreign suppliers and also to increase the use of domestic supplies. Second, because trade costs are modelled as a pure loss of output, the quantities of exports reaching the destination will decrease, so more needs to be dispatched to meet a unit of import demand. The net effect of these two forces on measured exports is strictly uncertain, but given the various parameters of the model, we expect it to be negative. And this will be reinforced by a third effect, namely, the decline in consumer welfare as the higher prices of imports reduce real income.
The UK has announced that it intends to adopt current EU bound tariff rates as its scheduled tariffs in the WTO after Brexit. Although it also announced on 13th March 2019 that, under a ‘No deal’ Brexit, it will levy lower tariffs than these for a period of a year, we assume here, since this is a longer run exercise, that tariffs are returned to the bound rates after this transitional period.[10] Hence, in a ‘No deal’ Brexit the tariffs on UK-EU trade will be the same in each direction. These average about 4%, and in terms of GTAP sectors, entail peaks in meat, dairy products and sugar. The average for UK imports from the EU will be 4.9% and on EU imports from the UK 3.9%. They differ because the pattern of imports varies between the two directions. In the same vein, UK imports from FTA67 countries will face MFN rates after Brexit, and UK exports to the FTA67 will face those countries’ MFN tariffs, which average 3.2% with peaks in meat, wheat and vegetable oils.[11] Current tariffs on FTA67 trade are lower than this, but not as low as zero.
An important caveat is that in our scenario, because we do not have the requisite information, we assume no change in the regime governing services trade. This is clearly a significant omission – nearly one-half of UK exports are services – and so our results must be understood as quantifying only a part of the effect of a ‘No deal’ Brexit.
‘No deal’ will entail significant restrictions on trade and global value chains, even after the immediate disruptions have been smoothed out. The increased protection that the UK, the EU and the FTA67 levy against each other will increase trade flows to and from the ROW, especially China.[12] However, for the UK, this expansion does not outweigh the contraction of trade with the EU and FTA67, so UK exports and imports both fall.
Figure 3 reports the percentage changes in the value of UK trade in both gross and value added terms for the three broad groups of countries. Trade with the EU faces new tariffs and new trade costs and becomes less desirable relative to both other flows. Accordingly, UK exports to the EU decline by 16-19% and imports from the EU by 21-22%. Trade with the ROW, on the other hand, faces no new barriers and thus becomes relatively more attractive, increasing by around 10% all round.
Trade with the FTA67 takes an intermediate position. UK exports face increased tariffs in these markets (but not from zero because the FTAs had not reduced all tariffs to zero previously); because nothing else changes, the UK becomes less competitive in the FTA67. However, the loss of sales to the EU induces UK exporters to seek, and have the capacity to supply, greater sales elsewhere, and this outweighs the competitiveness effect, so that, overall, UK exports to FTA67 actually increase. In the UK market, tariffs on FTA67 products also increase from zero to MFN rates; they become less competitive relative to ROW supplies, but, because Brexit makes no difference to the trade costs they face, more competitive relative to EU suppliers. The net effect – reinforced by the fact that UK real incomes have fallen – is that imports from the FTA67 decline.
Figure 3. UK bilateral import-export in a ‘No deal’ Brexit (% change)
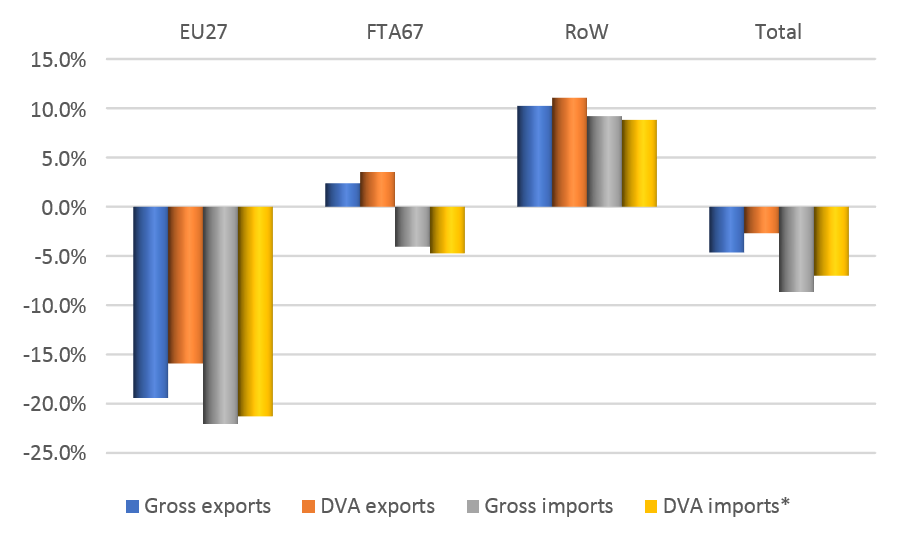
* ‘DVA imports’ represents the exporter’s domestic value added in its exports to the UK.
Figure 3 suggests that a ‘No deal’ Brexit will reduce value chain integration: the increased costs of trade will cause all exporters to use fewer imported intermediate goods and more domestic value added. As a consequence, the proportionate declines in both exports and imports of domestic value added are smaller than those in gross trade: UK gross and value added exports contract by 5% and 3% respectively, and UK gross and value added imports by 9% and 7%. By the same token, increases are larger for value added than for gross trade, as in the case of value added exports to ROW.
Figure 4 breaks the export figures up by exporting sector, but in absolute rather than percentage terms[13]. The differences across sectors reflect differences in their export levels, the tariffs they face in the EU and the domestic value added in exports. Thus food, a small sector facing high tariffs, loses nearly as much value added as electronics, more than twice its size but with fewer new barriers. The biggest losses are in motor vehicles, a large sector with large tariffs, and chemicals, the largest UK manufacturing export sector.[14]
Because we are considering only tariffs and trade costs on goods in these simulations, the services sector experiences no policy shock. Hence it becomes a relatively more attractive way of earning foreign exchange and can absorb the labour released by the goods sectors as their exports fall; for both reasons, services exports increase somewhat (although not services outputs – see below).[15]
Figure 4: UK DVA exports by sector in a ‘No deal’ Brexit (absolute changes $million)
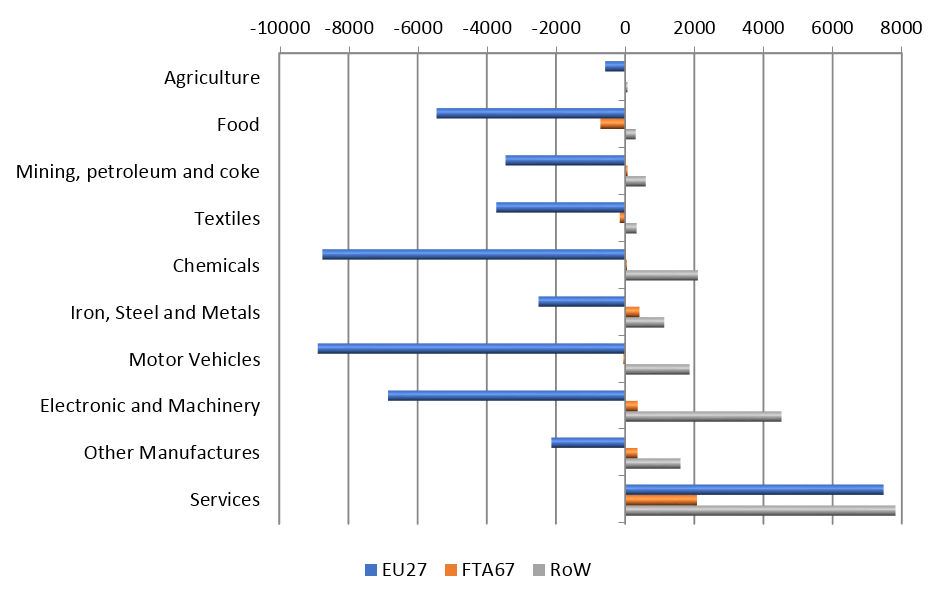
Table 1 looks more closely at how the loss of exports as usually measured (gross exports) is allocated across sources of value added (income). Column [1] reports the decline in each sector’s gross exports. This is comprised of foreign value added and domestic value added (column [3] and as shown in Figure 3). Of the latter, some is provided by the sector itself [4] and some by other UK sectors providing intermediate inputs [5]. For example, of the $13 billion decline in UK motor vehicles exports, nearly half of the loss is of foreign value added (because the foreign share is large and there is some substitution against foreign inputs) and just over half ($7 billion) of UK value added. Of the latter, only $2.9 billion comes from the vehicles sector itself and over $4 billion from other UK sectors (so-called indirect exports). These losses of indirect exports are important in policy terms: they arise not because of the tariffs levied on the source sectors (such as steel) but because of tariffs applied to motor vehicles.
Column [6] collects these indirect exports in a different way; for each sector it presents exports via other sectors. Given the increase in gross exports of services, sectors which are important suppliers of inputs into services show overall increases in indirect exports. Conversely, the large declines in gross exports of goods reduce the indirect exports of their services-suppliers very significantly.[16] The change in UK services sectors’ total exports of value added is shown at the foot of column [7]. It is the sum of the increase in direct exports ($15 billion (column [4]) and the decrease in indirect exports ($9 billion (column [6]). Column [7] shows the loss of export income for each sector, and it is evidently quite different in size and distribution from the loss of gross exports in column [1]. The largest loss of exports in gross terms is in motor vehicles (-$13 billion), while in terms of total VA the largest reduction is registered by chemicals. Overall, the losses in terms of gross exports are far more dispersed than those in value added terms. That is, once we move from considering gross exports to considering the sectors and people actually contributing to their value, the costs of Brexit are more widely spread.
Table 1 ‘No deal’ Brexit – change in exports, gross and value added
$million, relative to 2014 base-line values
| Gross Exports | Foreign Value Addeda | Domestic value added | Indirect Exports of VA | Exported Value Added | ||||
| total | own sector | other sectors | ||||||
| [1] | [2] | [3] | [4] | [5] | [6] | [7] | ||
| Agriculture | -732 | -212 | -520 | -363 | -157 | -546 | -909 | |
| Food | -8997 | -3132 | -5865 | -2851 | -3014 | 169 | -2682 | |
| Mining, petroleum & coke | -5101 | -2312 | -2789 | -2253 | -536 | 453 | -1800 | |
| Textiles | -5160 | -1608 | -3552 | -2357 | -1195 | 15 | -2342 | |
| Chemicals | -11172 | -4572 | -6600 | -4268 | -2332 | 40 | -4228 | |
| Iron, Steel and Metals | -1832 | -872 | -960 | -667 | -293 | -325 | -992 | |
| Motor Vehicles | -13490 | -6418 | -7072 | -2852 | -4220 | 72 | -2780 | |
| Electronic and Machinery | -3396 | -1425 | -1971 | -1811 | -160 | -482 | -2293 | |
| Other Manufactures | -511 | -340 | -171 | -233 | 62 | -180 | -413 | |
| Services | 19185 | 1818 | 17367 | 15960 | 1407 | -9662 | 6298 | |
| Total | -31206 | -19073 | -12133 | -1695 | -10438b | -10446b | -12141 | |
a/ Includes double-counted value added of -$627 million in total.
b/ These two figures differ only because of rounding.
The decline in foreign value added in column [2] of Table 1 demonstrates how a ‘No deal’ Brexit would erode existing value chains. It reflects both the reduction of gross exports and the reduction in the share of foreign value in the total value of exports. The loss is concentrated on EU value added, which falls by 19%, followed by FTA67 (6%) and ROW (3%) – see Figure A2 in the Appendix (Secn. 5). These declines imply that a ‘No deal’ Brexit would have a major impact in terms of GVC reduction and restructuring, and it is worth noting that such a reshuffling of suppliers will be even more dramatic – and hence costly – at the firm level.
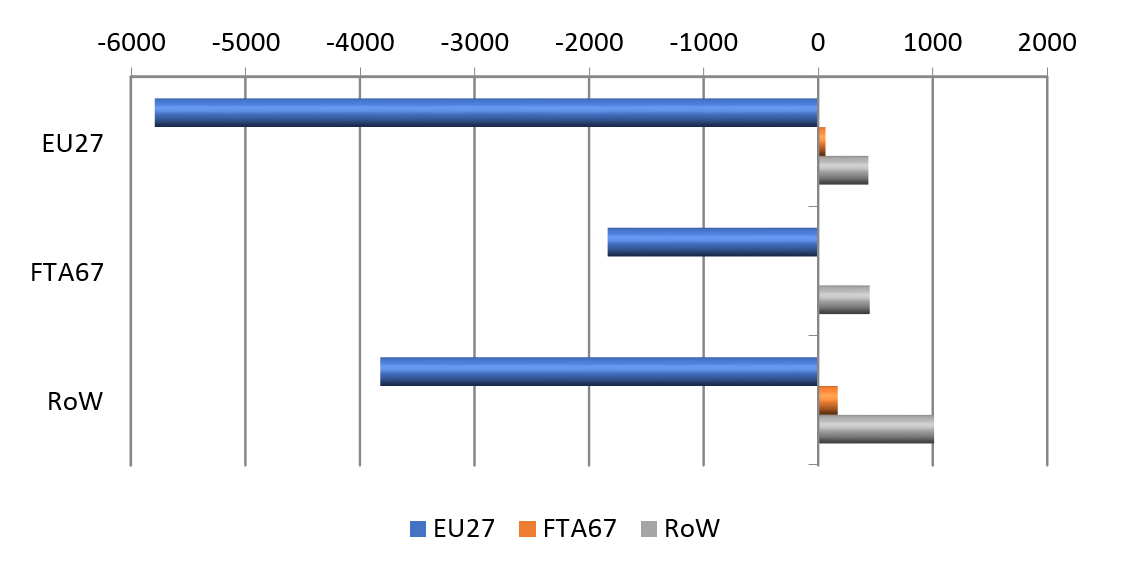
Figure 5 shows the extent of the disruption to UK multilateral value added exports – that is, exports of UK value added to one foreign country via transformation in another. It presents, for each final destination of UK exported value added (EU27, FTA67, and ROW, shown in the stub), the role played by each region as the intermediate platform. The newly introduced tariffs and trade costs on UK-EU trade engender a significant decline in ‘Factory Europe’, with a reduction of almost $US6 billion in UK value added reaching one EU country after transformation in another. Moreover, there are also large reductions in the use of the EU as a platform for exporting to the FTA67 (almost $2 billion) and the ROW (almost $4 billion). More importantly, as the EU declines as an exporter of UK value added, neither FTA67 nor ROW is able to pick the slack.
Figure 5. UK multilateral DVA exports in a ‘No deal’ Brexit ($ million)
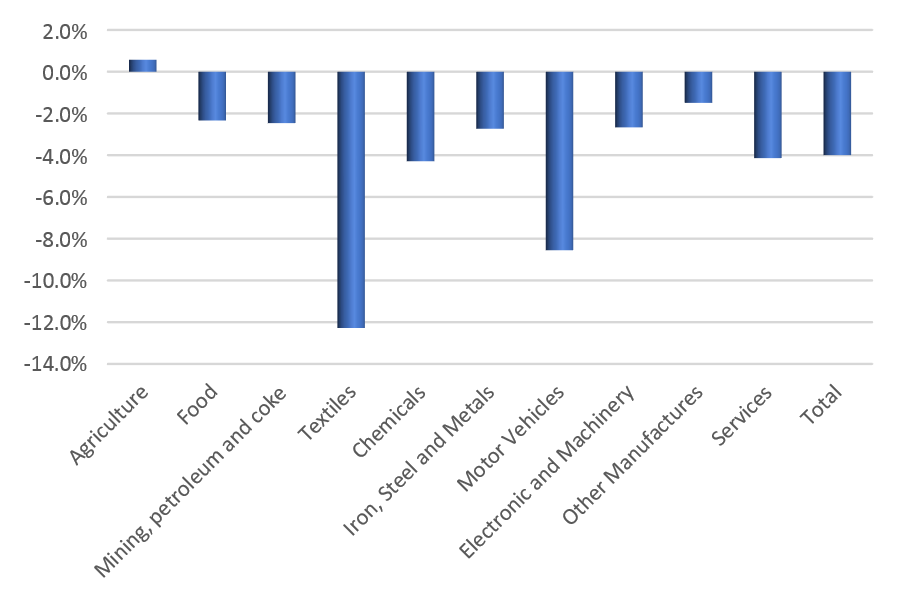
Ultimately we are interested in economic welfare not just the level of exports: domestic consumption and incomes are the key variables. Hence in Figure 6 we report the changes in total value added by sector: that is, changes in the incomes that the sectors generate. These estimates tell a different story from those for exports because they both add in the effects of Brexit on UK imports and allow all the indirect linkages and changes in domestic consumption to work through. Proportionately the largest declines in the value added in exports are in food and in textiles. When we add in the new effects to get an overall story, textiles continues to suffer heavily because it is very exposed to international trade. (Exports are more or less the whole story.) Food, on the other hand, is mainly dependent on the domestic market, and so records a much smaller percentage decline in overall value added than it suffered on its exports.
The largest proportionate declines in value added in a ‘No deal’ Brexit are in textiles and motor vehicles. Notice also that, mainly because of the decline in UK incomes and demand from other sectors, even services, which suffered no direct Brexit effect in our experiment, suffer a 4% decline in value added.
Figure 6 is bad news for UK incomes. Even under our very favourable long-run modelling assumption that all displaced workers and equipment get re-employed somewhere, real incomes fall by 4% on average, while those in textiles fall by 12% and in motor vehicles by 9%. These declines are spread fairly evenly over all the various recipients of income in the sectors, with, overall, slightly larger falls in unskilled wages than in skilled wages or the returns to capital.
Figure 6. UK value added in ‘No deal’ Brexit (% change)
In determining the effect of Brexit on economic welfare, we need not only to consider the losses in output/income arising from the inefficiencies created by tariffs and extra trading costs, but also any changes in the rate at which exports can be transformed into imports through international trade, viz. the terms of trade. As noted above, the increased friction in trade between the UK and the EU27 leads both to increase their efforts to expand trade with the ROW and FTA67; this requires their exporters to reduce their export prices and their consumers/users to increase what they pay for imports relative to pre-Brexit conditions. These two effects imply that post-Brexit, a unit of UK exports will buy a smaller volume of imports (i.e. a worsening of the terms of trade), which, in turn, implies a direct loss of consumption and economic welfare.
Table 2 breaks the loss of economic welfare (in monetary terms) down into a terms of trade effect and an allocative efficiency effect. The former, which arises from changes in the prices at which trade occurs sums to zero across the world – the exporter’s gain is the importer’s loss, and vice versa. The losses are focused on Europe, and specifically on the UK. The changes in allocative efficiency arise because the new tariffs and trade costs lead economies to shift their production patterns away from comparative advantage and their consumption away from the most desirable bundles of goods and services. The UK and EU27 lose efficiency because it is they who introduce the new distortions. Non-European countries, on the other hand, introduce no such costs and benefit a little because the relative disadvantages they faced when the UK and EU27 discriminated in favour of each other are curtailed. In technical terms, by placing say, EU27 and ROW suppliers on an equal footing in the UK a ‘No deal’ Brexit undoes some trade diversion that was caused by European integration.[17]
Table 2 Changes in economic welfare ($million)
| Terms of trade | Allocative efficiency | Total | |
| UK | -17,273 | -21,223 | -38,496 |
| Germany | 628 | -2,786 | -2,158 |
| Italy | -64 | -826 | -890 |
| France | -464 | -2,025 | -2,489 |
| Rest of EU27 | -2,352 | -8,523 | -10,875 |
| FTA67 | 2,679 | -100 | 2,579 |
| Japan | 782 | 74 | 856 |
| US | 4,419 | 175 | 4,594 |
| China | 4,017 | 2,168 | 6,185 |
| ROW | 7,410 | 1,909 | 9,319 |
| Total | -218a | -31,156 | -31,374 |
a/ Non-zero due to rounding errors.
A ‘No deal’ Brexit will be costly for the UK economy, even setting aside any short-term disruptions. We have analysed the introduction of trade restrictions only on goods and found that an extreme ‘No deal’ could reduce UK incomes by as much as 4% relative to remaining as a member of the EU. If we were to introduce service sector restrictions, the results would be worse, as, indeed the Government’s own assessment suggests (UK Government, 2018).
It is relatively easy to identify which sectors’ exports and imports will be hardest hit by trade restrictions – it depends on how heavily they trade with the EU and the size of the prospective barriers. However, our study goes a lot further. Foremost, it recognises value chains – the links between industries and, via global value chains, that some intermediate inputs into UK exports come from abroad. In addition, it recognises that less trade means lower incomes and hence lower demand; and it recognises that hindering trade means everyone pays more for imports and earns less from exports. Once we allow for these factors we see that the pain of a ‘No deal’ Brexit is spread quite widely. For example, the income generated in chemicals, which faces few new direct Brexit-induced trade barriers, falls by 4%, as does that in services. The latter conclusion, is salutary because it arises purely from Brexit-induced barriers to trade in goods: in this exercise, we have modelled no new trade barriers in services at all.
Modern international trade is substantially about global value chains. By throwing up barriers between the UK and the EU, a ‘No deal’ Brexit undermines many value chains and detaches the UK from ‘Factory Europe’. Our analysis assumes that firms adjust to the new reality and make the best of their new circumstances, but, even so, the medium-term cost to UK incomes is a loss of around 4%. The short-run cost, as the adjustment process takes place, is likely to be significantly higher.
[1] For a description of the GTAP Data Base version, see https://www.gtap.agecon.purdue.edu/databases/v9/ .
The 121 countries cover approximately 98% of world GDP and 92% of world population.
[2] For details see the Appendix to Gasiorek, Serwicka and Smith (2019).
[3] Although the the data refer to 2014, trade patterns do not change very rapidly, so it is not misleading about the current situation.
[4] Both backward and forward linkages imply intermediate goods traveling back and forth across the exporter-importer borders. This kind of trade is defined as ‘Global Value Chain (GVC) trade’.
[5] In fact, these numbers are under-estimates because they refer to aggregates of countries. Thus, for example, UK exports to Brazil that are embodied into Brazilian exports to Peru do not show up here as multilateral value added because Brazil and Peru are part of the same geographical grouping in our statistics. Likewise for exports to Denmark that are embodied in exports to Sweden.
[6] The GTAP-VA (Value Added) module carries out a post-simulation decomposition to derive the sources of value added
[7] This scenario is also sometimes termed an ‘MFN’ Brexit – see, for example, Gasiorek, Serwicka and Smith, (2019)
[8] The list is given in https://www.gov.uk/guidance/signed-uk-trade-agreements-transitioned-from-the-eu
[9] For reasons of analytical tractability, the GTAP approach is based on what economists refer to as ‘iceberg’ trade costs. This assumes that of every unit that is dispatched as an export, only a fraction actually arrives in the market, the remainder being lost in trade costs.
[10] See Gasiorek and Magntorn (2019) for details of the announced tariff reductions and a brief analysis of their implications.
[11] MFN refers to ‘most favoured nation’, WTO-speak for the tariff levied on imports from WTO members with whom the country does not have a separate trade agreement.
[12] The effect on economic efficiency of reintroducing tariffs on UK imports from the EU and the FTA67 is ambiguous. On the one hand it eliminates the distortion that arises because imports from different sources face different tariffs (reducing trade diversion), but on the other it introduces a distortion between UK production and imports from the EU and FTA67 (reducing trade creation). The increase in trade costs, on the other hand, induces an unambiguous decline in efficiency.
[13] Figure A2 in the Appendix (Secn. 5) reports the corresponding percentage changes. The absolute amounts here and in Table1 correspond to the 2014 economy (our base-line). Individual prices differ from 2014 actuals, but worldwide average prices are pinned to the actual worldwide average for 2014.
[14] Recall also that each of the sectors reported here is an aggregation from the finer GTAP classification at which the modelling is done. Hence ‘motor vehicles’ combines motor vehicles (tariffs of 8.4% on UK exports to EU and 7.8% on UK exports to FTA67) and other transportation (mainly ships and planes with tariffs of around 1.3%) in different proportions in different markets. This explains why the declines for ‘motor vehicles’ are so different between the EU and the FTA67.
[15] Because our model (in common with most CGE models) assumes that aggregate employment is unchanged by the policy shocks, labour released by one sector has to be absorbed by another. The implication is that as an economy faces worse trading conditions, if employment cannot decline, real wages must.
[16] These indirect exports are sometimes known as Mode 5 service exports, as discussed by Borchert and Tamberi (2018).
[17] One interesting wrinkle to note is that, while the UK and the EU face the same new distortions on the same trade flows, the effects are much smaller in the EU. This is because UK-EU trade is a much smaller proportion of EU27 trade and GDP than it is of UK trade and GDP, and thus it is much easier to accommodate by moving resources around on the margin.
Borchert, I. and Tamberi, N. (2018) Brexit and Regional Services Exports: A Heat Map Approach, UKTPO, Briefing Paper 14.
Ebell. M. and Warren, J. (2016) The Long-Term Economic Impact of Leaving the EU. National Institute Economic Review, 236(1):121–38.
Gasiorek, M. and Magntorn, J. Garrett (2019) Deal or ‘No Deal’? The economic consequences of the UK’s ‘No Deal’ tariffs, UKTPO, Briefing Paper 29.
Gasiorek, M., Serwicka, I. and Smith, A. (2019) Which Manufacturing Industries and Sectors are Most Vulnerable to Brexit?, The World Economy, 42(1):21-56.
Hertel, T.W. and Tsigas, M.E. (1997) Structure of GTAP. In Global Trade Analysis: Modeling and Applications, edited by T.W. Hertel. Cambridge: Cambridge University Press, pp.13-73.
UK Government (2018) EU Exit: Long-term economic analysis, Presented to Parliament by the Prime Minister, Cm 9741, November 2018
Click here to view the online appendix.