Briefing Paper 83 – July 2024
Adriana Brenis, Michael Gasiorek and Manuel Tong Koecklin
Determinants of preference utilisation
After the June 2016 Brexit referendum, and alongside the withdrawal negotiations with the European Union, the United Kingdom undertook a process to secure as much as possible the free trade achieved while being part of the EU with a total of 64 trading partners. The UK signed a continuity agreement with the Republic of Korea in August 2019 and, subsequently, another deal with Canada in December 2020. These continuity agreements, along with the Trade and Cooperation Agreement with the EU (TCA), entered into force once the UK finished its transition to depart from the EU, in 2021.[1]
The agreements offer the possibility for the UK of zero-tariff trade for most products, with some products having a longer period for the tariff liberalisation schedule, also leading to zero-tariff trade in the medium and long run.[2] In practice, not all exports that are eligible for preferential treatment under those agreements actually use those preferences. Hence, UK trade with those partners is not necessarily tariff-free. How much free trade is there in UK Free Trade Agreements? What potential factors prevent that trade from being fully free? What sectors are more likely to enjoy free trade? Which are more constrained? We address these issues in this briefing paper.
We focus on the continuity agreements signed by the UK with Canada and the Republic of Korea mentioned earlier, along with the UK-EU TCA. Firstly, we present some descriptive statistics on UK exports to those partners across sectors, and the tariffs faced in each destination by each sector. Then, we focus on the degree to which UK firms make use of those FTAs’ preferential treatment, by computing the ‘Preference Utilisation Rate’ (PUR). We then analyse the underlying Rules of Origin (ROOs) of each agreement as potential explanators of the PURs obtained. Subsequently, we test more formally the relation between the PUR, ROOs and other potential determinants. Finally, we conclude with some policy implications and suggestions.
While Free Trade Agreements (FTAs) offer the possibility of zero-tariffs, in practice the share of trade which is tariff free is somewhat less than 100%. This is partly because certain products are excluded from zero-tariff treatment to protect domestic industry – though these products usually represent a small fraction of total trade[3]. It is also because the utilisation of preferences is below 100%. There are several factors driving this. A key issue concerns the rules of origin within FTAs. These rules typically require that products have a certain amount of domestic or bilateral FTA trading partner’s inputs to be able to qualify for preferential treatment. Meeting these criteria can present challenges for companies, particularly in sourcing materials. If firms cannot meet the applicable rule of origin or cannot demonstrate that they have met the rules of origin, they then face the Most Favoured Nation (MFN) custom tariffs, making trade more expensive and less competitive.
Rules of origin thus add administrative complexity and hence costs to exporting firms. Firms are more likely to incur those costs the higher the MFN tariff (which they would face if the rules of origin are not met), and the higher the level of trade. If the MFN tariff is extremely low, it may be more efficient for the firm to pay the tariff than to be concerned about meeting the rule of origin.
Table 1 illustrates the average MFN tariffs in percentage imposed by Korea, Canada and EU on UK imports, alongside the corresponding share of UK exports to these regions across sectors. These MFN tariffs are presented as simple averages at the HS 2-digit product level, which are subsequently aggregated into 20 sectors known as HS sections. Similarly, the share of exports is calculated for each of these sections, providing an overview of trade dynamics between the UK and its trading partners.
The data presented show considerable variation across both countries and sectors. MFN tariffs are typically higher in Korea than in Canada or the EU. Hence, for 16 of the sectors listed here Korea’s tariffs are the highest. Across sections, we see that animal & veg. fats & oils, animals & animal products, and foodstuffs, bev. & tobacco encounter the highest average MFN tariff among the three UK partners. Tariffs imposed on animals & animal products stand out significantly. In Korea, Canada, and the EU, these products face average tariffs of 23.73%, 27.69%, and 19.31%, respectively. These sections are among those with the lowest UK export shares.
For each country in the export shares column, the figures in bold represent the five sectors with the largest export shares to each of the partners. This reveals that the same five sectors are the key export sectors to each of these markets and they are: chemicals, gold & pearls, machinery & electrical equipment, mineral, and transport equipment. These sections also tend to exhibit relatively lower average MFN tariff compared to others. For instance, products within the machinery & electrical equipment section face an average MFN tariff of 5.31% in Korea, 0.53% in Canada, and 1.73% in the EU, with the share of UK’s exports within this section being 19% in Korea, 19% in Canada and 21% in the EU.
The correlation between tariffs and global trade patterns has been extensively explored in previous research, demonstrating that when tariffs are low, exports tend to rise, and vice versa (see Caliendo and Parro, 2015, Cali et al., 2019, Fajgelbaum et al., 2020, Wang et al., 2022, among others). This highlights the important role of tariffs in shaping trade dynamics. Therefore, understanding the extent to which free-tariff benefits are utilised and identifying factors that may limit their utilisation is important for policy decision-making in international trade.
Table 1: MFN tariffs and UK’s export shares
| FTA | Korea | Canada | EU | ||||||
| HS section | MFN tariff (%) | Share of UK exports | MFN tariff (%) | Share of UK exports | MFN tariff (%) | Share of UK exports | |||
| Animal & veg. fats & oils | 29.13 | 0.05 | 4.50 | 0.20 | 11.93 | 0.32 | |||
| Animals & animal products | 23.75 | 0.50 | 27.69 | 1.06 | 19.31 | 2.49 | |||
| Arms & ammunitions | 3.11 | 0.08 | 3.97 | 0.05 | 2.60 | 0.10 | |||
| Art & antiques | 0.00 | 1.18 | 0.89 | 0.44 | 0.00 | 0.75 | |||
| Ceramic & glass | 7.92 | 1.10 | 4.06 | 0.43 | 3.54 | 0.89 | |||
| Chemicals | 10.44 | 9.34 | 3.04 | 10.34 | 4.53 | 15.82 | |||
| Foodstuffs, bev. & tobacco | 24.43 | 3.11 | 8.82 | 5.74 | 20.72 | 4.46 | |||
| Footwear & headgear | 10.58 | 1.44 | 7.76 | 0.13 | 5.91 | 0.41 | |||
| Gold & pearls | 5.00 | 10.88 | 2.08 | 23.15 | 0.90 | 4.93 | |||
| Leather | 7.88 | 1.45 | 4.94 | 0.15 | 3.44 | 0.30 | |||
| Machinery & electrical eq. | 5.31 | 18.74 | 0.53 | 18.89 | 1.73 | 20.93 | |||
| Metals | 5.89 | 3.36 | 0.86 | 3.65 | 2.59 | 6.52 | |||
| Mineral | 2.85 | 22.94 | 0.38 | 9.44 | 0.28 | 13.39 | |||
| Misc. manuff. | 6.10 | 0.38 | 3.90 | 0.95 | 2.57 | 1.63 | |||
| Plastics & rubber | 6.77 | 1.63 | 1.40 | 2.11 | 4.31 | 4.87 | |||
| Precision tools | 6.31 | 6.07 | 2.65 | 3.64 | 2.88 | 4.61 | |||
| Textile | 9.46 | 6.94 | 4.72 | 0.92 | 7.17 | 2.29 | |||
| Transport eq. | 4.25 | 10.01 | 4.74 | 17.20 | 2.68 | 12.52 | |||
| Vegetable products | 108.44 | 0.28 | 2.27 | 0.53 | 8.70 | 0.75 | |||
| Wood | 7.63 | 0.01 | 2.39 | 0.04 | 2.85 | 0.36 | |||
Source: World Integrated Trade Solution (WITS), 2021
The UK-EU Trade and Cooperation Agreement is a zero-tariff deal covering all products traded between both parties, although about 26% of HS6 products already benefit from a zero MFN tariff. Similarly, around 78% of the 12,242 Harmonised System tariff lines at the 10-digit level (HS10 products) can be exported to South Korea with a zero preferential tariff under the bilateral agreement, plus nearly 20% of lines previously subject to zero MFN tariff, along with a short list of products gradually liberalised. As for Canada, even though almost 70% of the 6,981 HS tariff lines at the 8-digit level (HS8 products) are already subject to a zero MFN tariff, most products affected by the deal with the UK enjoy immediate liberalisation. To what extent are UK firms selling to those partners with preferential treatment?
We compute for each agreement and, subsequently, for each sector within those agreements, a Preference Utilisation Rate (PUR). This is the ratio of UK exports accessing each of these markets with preferential treatment (either zero tariff or a reduced tariff under a liberalisation schedule), relative to all exports eligible for that preferential treatment.
To calculate those rates, we rely on product imports data from Eurostat, which contains information on preference utilisation, Statistics Canada and Korea’s Trade Statistics Service. While the Eurostat data compiles data at the HS 8-digt level, the Canadian and Korean sources offer more disaggregated information at the HS 10-digit level.
Table 2 presents the estimated aggregate PURs by the UK and EU-27 firms for each FTA considered. The table shows that even in a full zero-tariff deal such as the TCA signed with the European Union, the degree to which UK firms access to free trade is far from 100%, with rates approaching 70% in 2021 and 74% in 2022.[4]
Table 2: UK and EU-27 Aggregate Preference Utilisation Rates per Agreement, 2021-2022 (%)
| FTA/Year | 2021 | 2022 | ||
| EU TCA | 68.90% | 73.60% | ||
| UK PUR | EU-27 PUR | UK PUR | EU-27 PUR | |
| Korea | 60.03% | 73.80% | 55.64% | 73.52% |
| Canada | 29.80% | 51.39% | 51.88% | 50.47% |
Source: Authors’ calculations based on Eurostat, Statistics Canada and Korea’s Trade Statistics Service for 2021 and 2022
The figures are even lower for the continuity agreements with Korea and Canada, with levels only slightly above 50% in 2022. In other words, just more than a half of UK exports to those destinations eligible for preferential treatment actually enter there under those preferences. It is worth pointing out that prior to the enactment of the continuity agreements, PURs for the UK in Korea got to a peak of 78.88% in 2018, under the EU-Korea deal, with a steady downward trend since then. Similarly, under the EU-Canada FTA, UK’s PUR peak was 67.18% in 2020, followed by a sharp fall to 29.80% in 2021, when the continuity agreement entered into force.
For comparison, we present in Table 1 the equivalent aggregate PURs for the 27 EU members for both the Korea and Canada agreements (EU-27). Rates are clearly higher for the EU-27 than for the UK in the Korea deal, which has been the case for most years. With respect to the Canada deal in 2022, the UK PUR slightly surpasses the EU’s. However, in both cases the PUR is low at just over 50%.
We are interested in understanding possible drivers for those PUR levels. Firstly, we attempt to identify patterns of preference utilisation across sectors. We group HS 2-digit product chapters into the HS sections mentioned earlier, and calculate for each year, FTA and section a Preference Utilisation Rate.
Table 3 features the results from those calculations. PURs under the UK-EU TCA are, with few exceptions, systematically higher across HS sections than those under the other bilateral agreements. The table also shows that there are some sectors with high PURs across all the agreements. This is the case for Agrifood sectors like animals & animal products and vegetable products, with rates typically above 90%. That is also the case, to a lesser extent, for arms & ammunitions and ceramic & glass. Other HS sections, conversely, obtain systematically low rates across deals. The evident examples are sections from the Textile industry, such as footwear & headgear, leather and textile, with rates ranging from 10% to 53%. Precision tools is another low-PUR section, with rates never above 50%. In all those sections, we tend to find the common trend of UK-EU TCA rates higher than the other two agreements.
Table 3: UK Preference Utilisation Rates per Agreement at the HS Section Level, 2021-2022
| FTA | UK-EU TCA | UK-Korea | UK-Canada | |||
| HS Section | 2021 | 2022 | 2021 | 2022 | 2021 | 2022 |
| Animal & veg. fats & oils | 0.85 | 0.89 | 0.03 | 0.03 | 0.56 | 0.6 |
| Animals & animal products | 0.97 | 0.98 | 0.98 | 0.97 | 0.69 | 0.99 |
| Arms & ammunitions | 0.66 | 0.9 | 0.92 | 0.41 | 0.76 | 0.66 |
| Art & antiques | 0.46 | 0.03 | ||||
| Ceramic & glass | 0.77 | 0.81 | 0.85 | 0.84 | 0.38 | 0.71 |
| Chemicals | 0.79 | 0.82 | 0.36 | 0.4 | 0.54 | 0.78 |
| Foodstuffs, bev. & tobacco | 0.85 | 0.89 | 0.65 | 0.65 | 0.56 | 0.78 |
| Footwear & headgear | 0.25 | 0.24 | 0.27 | 0.37 | 0.11 | 0.31 |
| Gold & pearls | 0.25 | 0.64 | 0.9 | 0.95 | 0.25 | 0.42 |
| Leather | 0.35 | 0.36 | 0.1 | 0.11 | 0.13 | 0.29 |
| Machinery & electrical eq. | 0.58 | 0.61 | 0.28 | 0.34 | 0.49 | 0.45 |
| Metals | 0.75 | 0.78 | 0.56 | 0.59 | 0.24 | 0.42 |
| Mineral | 0.85 | 0.84 | 0.79 | 0.46 | 0.25 | 0.47 |
| Misc.manuff. | 0.61 | 0.65 | 0.56 | 0.48 | 0.24 | 0.47 |
| Plastics & rubber | 0.79 | 0.84 | 0.58 | 0.64 | 0.43 | 0.67 |
| Precision tools | 0.49 | 0.49 | 0.25 | 0.48 | 0.23 | 0.24 |
| Textile | 0.47 | 0.53 | 0.35 | 0.36 | 0.14 | 0.22 |
| Transport eq. | 0.57 | 0.63 | 0.68 | 0.91 | 0.2 | 0.49 |
| Vegetable products | 0.91 | 0.94 | 0.77 | 0.86 | 0.92 | 0.98 |
| Wood | 0.78 | 0.85 | 0.13 | 0.19 | 0.24 | 0.62 |
Note: The darker the cell, the lower the PUR.
Source: Authors’ calculations based on Eurostat, Statistics Canada and Korea’s Trade Statistics Service for 2021 and 2022
However, by comparing between agreements, there are some strikingly low rates to highlight. For instance, the Preference Utilisation Rates under the UK-Korea agreement for animal & veg. fats & oils are extremely low, relative to the other FTAs. The same can be seen for the wood and, to a lesser extent, chemicals and machinery & electrical equipment. In the Canada deal, especially in 2021, we find low rates, compared to the other agreements, in transport equipment, and textiles.
To access preferential treatment when selling a product to a destination under a free trade agreement, firms must comply with product-specific rules of origin (ROOs), which determine the requirements necessary to fulfil to grant originating status to a product.
Rules of origin in free trade agreements usually specify for each product the minimum percentage of originating content, the necessary transformations that non-originating inputs must undergo or specific production processes to be undertaken. These are the main ROO categories we find in most FTAs:
ROOs in free trade agreements are typically applied in conjunction with general provisions rules such as the cumulation, transportation and tolerance rules. Table 4 below outlines these general provision rules in the UK agreements with the EU, Korea, and Canada.
The cumulation rule determines whether firms can make use of inputs from the other signing party, or indeed from other third countries, to produce a good, with that foreign content being considered as originating when assessing for ROO compliance. Under the UK-EU TCA, UK firms can transform inputs originating from any European Union member to produce a final good and export it to the EU. Such EU content will be taken as UK domestic content, contributing to the minimum domestic content required by the rule of origin. As a result, the UK final good is sold with a zero tariff. Similarly, under the UK-Korea and UK Canada deals, UK firms can use EU inputs in their exports to benefit from preferential tariffs. However, the cumulation rules under those agreements are time-limited, expiring in January 2024 for Korea and April 2024 for Canada. While the UK government successfully negotiated a two-year extension with Korea, no similar outcome has been achieved with Canada.
In terms of transportation rules, the intention is to ensure that preference is granted only to originating goods by avoiding situations where the goods can be manipulated or substituted while in transit through a third country. Under the UK-Korea deal, goods traveling from the UK to Korea through the EU can be split into smaller parts and sent to Korea as long as they have not passed through customs control in the EU yet, offering flexibility. However, if goods pass through any non-EU country, they cannot be split and must go through customs control in that non-EU country.[5] In contrast, under the UK-Canada deal, goods traveling from the UK to Canada through a third country, whether it is the EU or a non-EU country, can also be divided into smaller parts while in the third country. However, each part must stay under customs control in that third country until reaching Canada.
The tolerance rule allows a limited percentage of non-originating materials in a product to still qualify as originating. This provides flexibility in situations where sourcing all materials locally may not be feasible. This ensures that minor inputs from other countries don’t disqualify the product from preferential treatment. Under the UK-EU agreement, the tolerance of non-originating material is set at 15% of the product’s weight for products in chapters 2, and 4 to 24 (except fishery), and 10% of the product’s ex-works price for other products (except products in chapters 50 to 63). In the UK-Korea deal and the UK-Canada deal, this percentage is also 10% of the product’s ex-works price, except for products in chapters 50 to 63.
Table 4: General Provisions on Rules of Origin
| Agreements | Cumulation of Origin | Transportation rule | Time-restriction | Tolerance rule |
| UK-EU | UK traders can use EU inputs in exports to the EU as if they originated in the UK. | No applicable | 10% to 15% | |
| UK-Korea | UK traders can use EU inputs in exports to Korea as if they originated in the UK. | Transits through the EU face different restrictions than transits outside the EU. | Both rules are extended for two more years since January 2024 | 10% |
| UK-Canada | UK traders can use EU inputs in exports to Canada as if they originated in the UK. | Transits through the EU face same restrictions than transits outside the EU. | UK exporters cannot longer consider EU inputs as originating in exports to Canada since April 2024. | 10% |
The extension of the cumulation rule under the UK-Korea deal is good news for UK traders. It means they can avoid Korea’s high tariffs, which is especially important because trade between the UK and Korea has more than doubled since the agreement started, reaching £7.3 billion in exports in 2022. Many British industries, like food and drink and automotive – which constitutes the second largest British export to Korea – will benefit from this extension.
Conversely, the expiration of the cumulation rule for exports to Canada poses challenges for UK exporters. They can no longer consider EU inputs as originating from the UK, losing the advantage of preferential treatment. This requires them to reassess their supply chains and ensure compliance with new regulations. These changes highlight how important it is for companies to follow the rules of origin. Following these rules, firms can get special treatment, save money and stay competitive in the global market.
Considering this, one potential reason why the UK does not make full use of preferential treatment in those international markets is the degree of difficulty experienced by firms to comply with those rules of origin. One set of rules might be more restrictive than others. It may also be the case that certain sectors are generally subjected to harder rules than others, or that the ease of compliance with a rule of origin is sector- or even product-specific.
To address this, we apply a Rules of Origin Restrictiveness Index (ROO-RI), which varies across products, defined at the HS 6-digit level.[6] This index ranges on a scale from 1 to 10. The higher the score, the more restrictive the rule of origin for a particular product. The index assigns scores to each of the main ROO categories described above, as well as to a set of potential combinations of these rules, considering allowances or exceptions, which may apply for one HS 6-digit product.
We compute a simple average for each agreement, based on the HS 6-digit product level scores, and find that the UK-EU Trade and Cooperation Agreement – for which the ROO-RI was originally designed – has a moderate degree of ROO restrictiveness, on the order of 4.26. We also applied the ROO-RI to the rules of the Canada and Korea agreements and find an average restrictiveness index of 3.76 for the former and 4.58 for the latter. The score difference across FTAs is explained by the different frequencies of ROO categories and its combinations. Thus, for instance, the low score for the Canada agreement is heavily explained by the high frequency of products subject to the Wholly Obtained (WO) and Any Heading (AH) rules, which are given the lowest scores in our scale (between 1 and 2). The higher score for the UK-Korea FTA, on the other hand, is largely driven by the high number of products ruled by the Change in the Heading (ΔCTH) rule, scored 6. The average score for the UK-EU TCA reflects the large number of products in which firms can opt between the ΔCTH and the Value-Added (VA) rules.
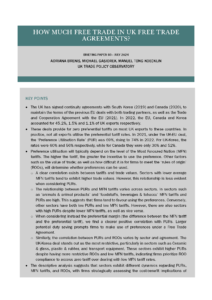
This index varies considerably across industries. Figure 1 shows that heterogeneity by plotting the simple average of our ROO restrictiveness index for each FTA across HS sections. In 13 of these sections, the UK-Korea agreement has indeed the highest degree of average ROO restrictiveness, among which we find industries like leather, wood pulp products, ceramic and glass, gold and pearls, among others. Conversely, only in 5 sections, restrictiveness is higher in the UK-Canada deal. There we find Agrifood industries, along with wood, mineral and footwear and headgear.
Figure 1: Average ROO Restrictiveness Index across HS Sections and FTAs
At a first glance, ROOs under the UK-Korea agreement are more restrictive than under the UK-EU TCA and then the Canada deal, in that order. If there were no other factors in play, we would expect that more restrictive rules of origin would result in lower degrees of preference utilisation. That appears to be the case for the Korea agreement since, as seen earlier, PUR levels for UK exports to Korea tend to be lower than those for sales to the EU. However, ROOs under the Canada deal are found to be even less restrictive on average, but the degree of preference utilisation is even lower, particularly in 2021.
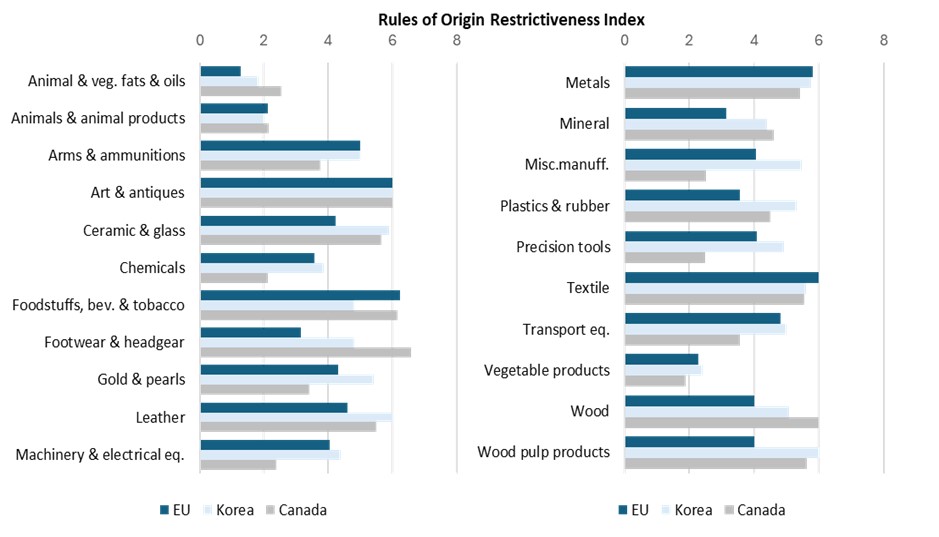
This may be driven by other factors, or it may be a result of a different set of products being exported to Canada in comparison to the other countries, with different levels of ROO restrictiveness. In 2021, slightly more than 60% of UK exports to Canada eligible for preferential treatment corresponded to Automotive tariff lines, for which the ROO-RI is 5.5. Conversely, nearly half of UK sales to Korea eligible for preferences belong to mineral and chemical industries, with the ROO-RI being as low as 1. This highlights the importance of considering how much a country exports of each product or sector to assess the degree to which ROO restrictiveness in practice matters for UK exports, given the UK’s patterns of trade.
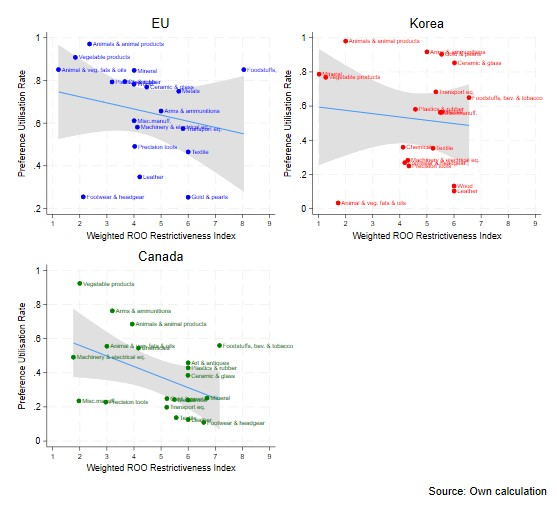
We, therefore, compute a weighted index at the HS section level for each FTA, in which we weight each HS 6-digit product by their respective shares of total trade eligible for preferential treatment. Figure 2 provides further insights on the relative importance of ROO restrictiveness across sections.[7] The figure shows how relevant the compliance of rules of origin is depending on how much is traded per industry. In the case of the UK-Canada deal, we can infer that ROOs weigh more in transport equipment, followed by foodstuff, beverages and tobacco, animal and animal products and plastics and rubber. Similarly, as for the UK-Korea agreement, gold and pearls is the industry in which ROO restrictiveness matters the most, followed by transport equipment and mineral. These two industries are the most relevant in terms of ROO in the UK-EU TCA.
Figure 2: Weighted ROO Index across HS Sections and FTAs
However, it is important to highlight some limitations of the ROO-RI. For instance, the ROO-RI does not consider the general provisions outlined in Table 4 regarding ROO restrictiveness. Additionally, the ROO-RI does not account for how the same product-specific rules (represented by a single ROO-RI score) can vary in restrictiveness across different products. This means that a rule which might be easy to comply with for one type of product could be very difficult for another, yet the ROO-RI would give them both the same score, failing to reflect these differences in restrictiveness.
In this section we explore the correlation between the degree of access to preferential treatment and a series of potential determinants, including the restrictiveness of product-specific rules of origin.
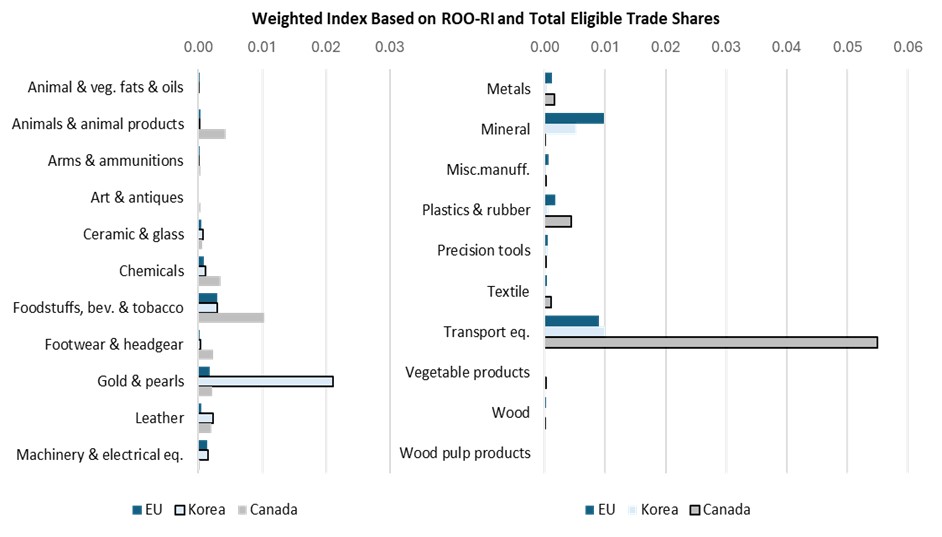
A determinant of preference utilisation, typically considered in the literature, is the preferential margin. This is expressed as the difference between the tariff rate a firm must pay in case of no use of preferences, i.e. the Most Favoured Nation (MFN) tariff, and the preferential tariff a firm can access via the FTA. For larger degrees of preferential margin -in other words, larger potential trade costs-, we expect more preference utilisation.
Figure 3 shows the correlation between PUR and the average preferential margin across HS sections, for each FTA. We obtain a positive correlation between both variables, although the largest correlation coefficient is found for the UK-EU TCA (0.46), followed by the Canada deal (0.24) and the Korea agreement (0.13). In addition, the graph notably reveals a positive association between preferential margins and PURs in certain sectors, indicating that higher tariff margins correspond to higher PURs. Specifically, this trend is observed in HS sections such as Animals & animal products and Foodstuffs, beverages, & tobacco, although the latter experiences a lower average tariff margin in the case of exports to Canada.
The figure also suggests that there are factors other than tariffs which impact on preference utilisation rates. Take the case of UK exports to Canada, which tend to have lower PURs across most sectors. For instance, in HS sector Transport equipment, where UK exports to Canada represent 17% of the total exports to Canada and face an average tariff margin around 5%, the PUR stands at only 20%. This raises questions about whether these differences could be linked to variations in the rules of origin across the agreements, and also to the nature of the supply chains in the UK that are selling to these markets (see also Ayele, Gasiorek & Tong, 2021).
Figure 3: Preference Utilisation vs. Preferential Margin (%), 2021 (HS Sections)
Figure 4 compiles, for each of the three agreements analysed, a scatter plot and fitted line correlating the 2021 Preference Utilisation Rates (vertical axis) and a weighted average ROO Restrictiveness Index calculated across HS sections (horizontal axis), based on the product share of total eligible trade within an HS section. In each of the three treaties, we find a negative correlation between both variables, with the largest degree found in the UK-Canada FTA (-0.47), followed by the UK-EU TCA (-0.22) and the UK-Korea deal (-0.11). This suggests that when HS sections have a higher weighted ROO index, the PUR in that section tends to be lower, and vice versa.
Figure 4: Preference Utilisation vs. Weighted ROO Restrictiveness, 2021 (HS Sections)
As a final empirical exercise, we formally test the relationship between preference utilisation of UK exports and its potential determinants, by running an OLS regression for 2021 and 2022, at the HS6 product level, pooling the data from the three agreements.
Table 4 presents the results from this estimation. The two variables for which we obtained the expected correlations in the scatter plots, ROO restrictiveness (unweighted) and preferential margins, obtain the expected signs and are highly significant. That is, the degree of ROO restrictiveness is negatively associated with preference utilisation at the product level, whereas larger preferential margins, i.e., the gap between the MFN and preferential tariffs, are associated with larger PURs. More formally, a one-point increase in the ROO restrictiveness of a product is associated with a rise in preference utilisation by between 1.8 and 2.2 percentage points. Conversely, a 1% increase in the preferential margin is associated with a 0.12-percentage-point increase in preference utilisation.[8]
The trade value, expressed in logs, which is the total export value eligible for preferential treatment at the HS6 product level, is found to be a consistently significant PUR determinant, with a positive sign. That means, the more UK firms export of a product to a destination in which an FTA is in force, the more likely they are to make use of preferential treatment, by around 0.04 percentage points for a 1% trade value increase. In other estimations, not reported in this paper, we replace the trade value by the potential duty savings (the product of trade value and the preferential margin), finding the same positive and significant effect on PUR. Finally, in column (4) we include FTA dummies for Canada and Korea, taking the UK-EU TCA as base category. The negative and significant coefficients show that PURs in deals with Canada and Korea tend to be lower compared to the agreement with the European Union. This trend is evident from Table 3 and persists in the regression analysis, even when other factors such as preferential margin, trade value, and ROO are considered.
However, it is important to mention that some general provisions on rules of origin such as transportation and tolerance rule differ across these agreements. For instance, the EU allows a higher percentage of non-originating materials in a product compared to Canada and Korea. These rules are not considered in our regression analysis, and they might explain why Canada and Korea have lower PUR compared to EU. Additionally, it is important to note that the analysis only covers the years 2021 and 2022, which could be affected by the uncertainties related to the new agreement terms after the UK left the EU.
Table 5: Determinants of Preference Utilisation of UK Exports, 2021-2022 (HS6 Products)
| Dependent Variable | Preference Utilisation Rate | |||
| Estimation | OLS | |||
| Column | (1) | (2) | (3) | (4) |
| ROO Restrictiveness Index | -0.0191*** | -0.0196*** | -0.0222*** | -0.0175*** |
| (0.00199) | (0.00177) | (0.00183) | (0.00181) | |
| Trade Value | 0.0403*** | 0.0400*** | 0.0326*** | |
| (0.000758) | (0.000829) | (0.000959) | ||
| Preferential Margin | 0.0809** | 0.119*** | ||
| (0.0321) | (0.0330) | |||
| Canada | -0.117*** | |||
| (0.00912) | ||||
| Korea | -0.119*** | |||
| (0.00742) | ||||
| Constant | 0.548*** | 0.0825*** | 0.0927*** | 0.213*** |
| (0.00959) | (0.0126) | (0.0143) | (0.0160) | |
| Observations | 15,132 | 15,132 | 14,391 | 14,391 |
| R-squared | 0.007 | 0.160 | 0.150 | 0.170 |
| r2_a | 0.00675 | 0.160 | 0.149 | 0.170 |
| Robust standard errors in parentheses | ||||
*** p<0.01, ** p<0.05, * p<0.1 |
||||
Despite the UK post-Brexit active policy to secure free trade through continuity agreements with several trading partners, statistics show that UK FTAs are not fully free. Apart from the exclusion of a number of products from those agreements, we find that preference utilisation rates for UK agreements signed with the EU, South Korea and Canada are far from 100%. A set of factors influences this outcome, with dynamics to consider across sectors.
Across trade agreements and sectors, firms face different dynamics between MFN tariffs, ROOs, and the utilisation of preferences. They face tough choices about using preferential tariffs. These decisions depend on things like how complicated it is to follow the ROO, and what happens if they do not follow them. Sometimes, firms skip following ROO rules because they are too hard or take too much time. In contrast, some firms have no choice but to use MFN tariffs because they cannot meet the rules.
For instance, under the UK-Korea deal, sectors like vegetable products appear to prioritise conformity with the ROOs to qualify for tariff preferences. Others, like wood and leather, are more likely to deal with low MFN tariffs instead of complying with the rules. Conversely, in the UK-Canada agreement, sectors such as animal products prioritise compliance with ROOs, while industries like footwear and ceramic face lower MFN tariffs. Similarly, in the UK-EU deal, agrifood industries prioritise ROOs compliance over high MFN tariffs, whereas sectors like foodstuff face both high MFN tariffs and restrictive ROOs, yet there are high PURs, indicating a preference for ROO compliance despite the challenges.
Understanding why firms make these choices matters to policymakers who want to make trade agreements work better and assist businesses in using preferential tariffs well. Therefore, it is crucial to conduct firm-level research to better understand the factors influencing firms’ decisions to use preferential tariff schemes or not.
Regarding the ROO-RI, we find that on average the UK-Korea agreement is subject to more restrictive rules of origin than the UK-EU TCA and the Canada deal, in that order. However, the relevance of that restrictiveness depends highly on how much in each industry the UK sells to those partners. Thus, ROOs are particularly important in transport equipment sold to Canada and gold and pearls sold to Korea.
Exploring what affects PURs across different sectors and agreements reveals a complex and dynamic landscape. Our regression analysis allows us to isolate each factor while taking into account other factors. Here we observe that higher PURs correlate with lower ROO indices, higher tariff margins, and increased trade value.
Overall, each of these factors plays an important role in firms’ decision to export under these agreements. In particular, small businesses may struggle to meet rules of origin and access preferential tariffs. This could hurt their profits and competitiveness, especially in sectors with high MFN tariffs and ROOs.
[1] The UK-Korea FTA came into force on the 1st of January 2021, whereas the UK-Canada FTA entered into force on the 1st of April 2021.
[2] The UK-EU TCA ensures zero-tariff trade for all products, whereas the UK-Korea and UK-Canada deals guarantee zero-tariff trade for around 98% of products, considering both products immediately liberalised and those already liberalised under the Most Favoured nation (MFN) scheme.
[3] For instance, under the UK-Korea FTA, only 67 products classified under the Harmonized System at the 10-digit level (HS10) are subject to Most Favoured Nation (MFN) tariffs which represent 0.55% of the total number of products.
[4] For the calculation of PURs from the UK-EU TCA, we considered EU imports from the UK classified in the four statistical regimes available: normal imports and exports (regime 1), the inward processing procedure (regime 2), the outward processing procedure (regime 3) and ‘not recorded from customs declarations’ (regime 9). Imports under regime 1 account for around 91% of imports eligible for preferences in 2021 and 2022, followed by around 8% accounted for by regime 2. We also consider in our calculations two preference eligibility status from Eurostat: only preferences (E3) and only MFN (E1). We made these choices based on the zero-tariff condition of the UK-EU TCA and the low trade shares from secondary statistical regimes, but we acknowledge that other academic research might prefer to focus only on statistical regime 1 and eligibility status E3.
[5] While this rule also expired in January 2024 for Korea, it has been extended for an additional two years.
[6] The ROO-RI was originally developed by Ayele, Gasiorek and Tong (2022), following Cadot et al. (2006).
[7] We multiply the ROO Restrictiveness Index score of each HS 6-digit product by its corresponding share of total trade eligible for preferential treatment. Subsequently, we compute a simple average of those factors at the HS section level.
[8] In other estimations, not reported in this paper, we considered instead the MFN tariff solely, which was found not to be significant.