Preference Utilization Rates (PURs)
In May 2021, our analysis of UK monthly trade data revealed that in the first quarter of 2021 UK trade with the European Union was adversely affected by Brexit.[1] In this Briefing Paper, we extend this work by applying the same methodology to the more recent monthly data to assess how UK goods trade has performed in the period January-July 2021.
Since the UK-EU Trade and Cooperation Agreement (TCA) came into force, firms trading with the EU have faced new costs as they learn to trade under new regulations and comply with customs formalities that were otherwise not present.[2] These costs can have significant impacts on trade and on the overall UK economy given the importance of the EU as a destination of exports and as a source of imports. We employ various methods that allow us to isolate a TCA effect from other economic shocks (notably the Covid-19 pandemic) and find that overall UK exports to the EU decreased by 14% and UK imports from the EU by 24% over the entire period. The decline in exports was almost entirely driven by a prominent fall exhibited in January, while the decline in imports has shown a persistent negative effect in each month since January 2021. We also find that these effects on both exports and imports vary considerably across sectors.
Likewise, we also expand our analysis on preference utilization rates (PURs), which depict the extent to which UK exports to the EU have benefited from the tariff-free treatment agreed in the TCA. To claim zero-tariffs exporters need to meet complex Rules of Origin (RoO) requirements and provide proof of origin. Even some exporters that can meet the RoO may instead choose to pay the tariff because of the cost of the paperwork and requirements for certification. This means that, in practice, firms may end up paying tariffs despite the zero-tariff and zero-quota deal under the TCA. We find that since January the PUR is on average 74%, and in July 2021 was still 75%. This means that around 25% of exports to the EU covered by the TCA preference scheme are paying tariffs. These tariffs can translate to higher prices for UK products in EU markets that reduce their demand and lower profits for UK firms. In turn, these can impact on the ultimate survival of firms and is likely to affect small and medium enterprises disproportionally.
Finally, we also extend our work by examining the impact of the TCA on trade in services. We estimate that the TCA has reduced exports by 12% and by 37% for imports in the first half of 2021, with varying effects by service type.
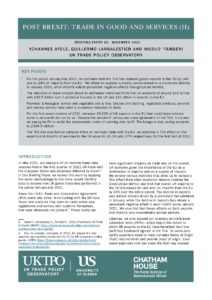
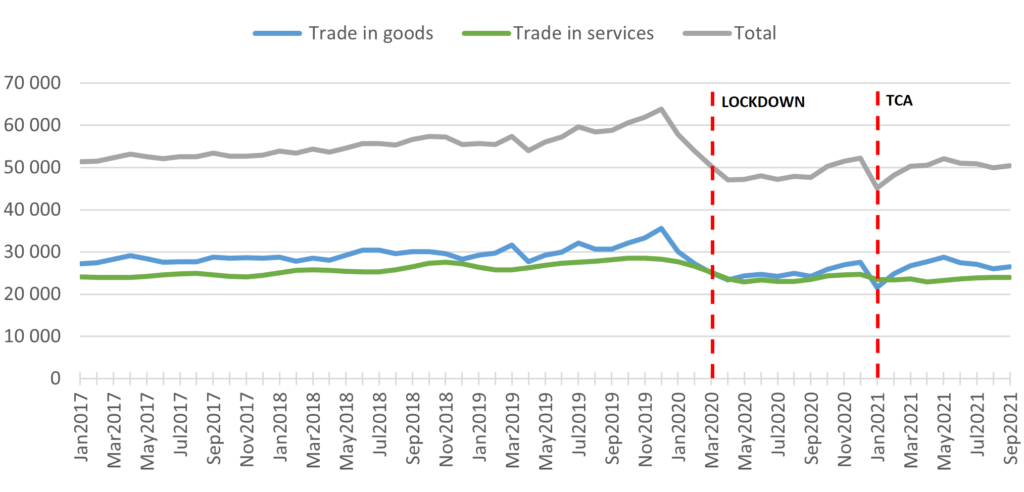
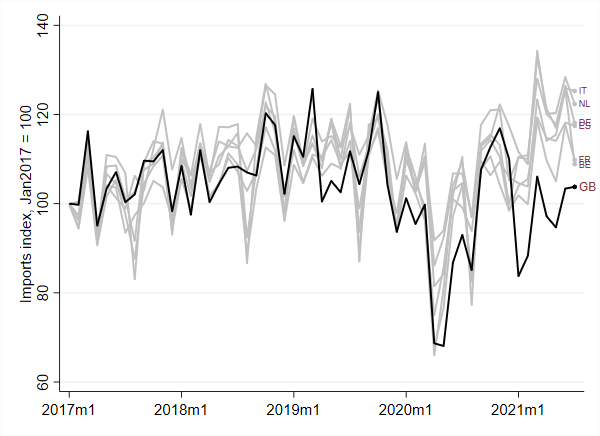
Figure 1 shows UK monthly trade movements since January 2017 to all countries. Both panels show noticeable decreases since January 2020, no doubt largely driven by the onset of the Covid-19 pandemic. The vertical line placed on March 2020 denotes the time at which the UK Government first introduced lock-down measures.
We then observe signs of recovery up until January 2021 when the TCA came into force. Both exports and imports of goods have experienced relatively persistent increases since this initial shock albeit, and importantly, they remain below pre-pandemic levels. The fluctuations in the exports and imports of services are less pronounced directly following the two marked events but, once again, we observe that values remain below pre-pandemic levels.
a) Exports
b) Imports
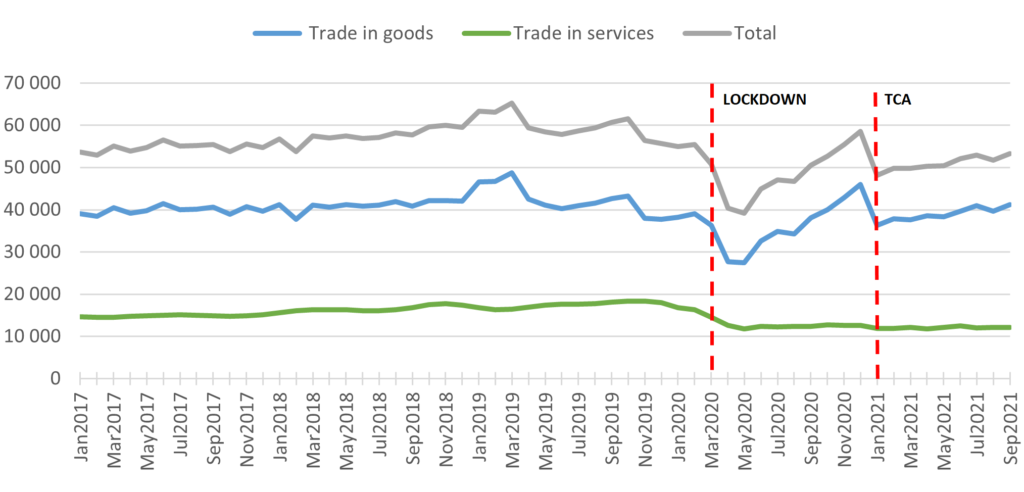
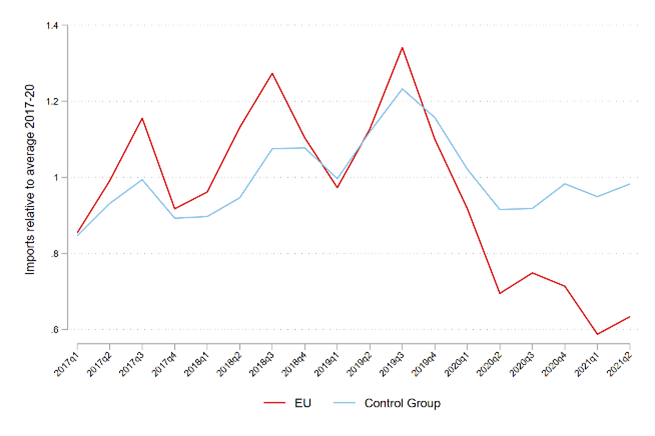
Despite the overall upward trend in exports and imports exhibited in 2021, it appears that the UK’s economic recovery has been relatively sluggish and is lagging behind those of other major economies. [3] Figure 2 shows that UK monthly goods trade has performed relatively poorly in comparison to other EU27 countries.
a) Exports
b) Imports
We focus our analysis on estimating the TCA effects, i.e., the amount of trade the UK has lost with the EU – had the UK not left the EU – in comparison to UK trade with non-EU countries. Our approach does not capture the extent to which the overall sluggish recovery of UK trade, in comparison to other countries, since the onset of Covid may also have been induced by the UK’s departure from the EU, and the negative impact on economic activity and trade as a result.
In order to estimate the impact of the TCA on UK-EU trade in goods we rely on three econometric techniques: difference-in-differences (DD), triple difference (DDD) and synthetic control (SC). In the DD we compare UK trade with the EU before and after the TCA against UK trade with OECD+BRICS countries. In this manner, we are able to control for the evolution of the Covid-19 pandemic in the UK and other shocks that affected the UK in any given month. For the DDD estimation, we also include information on EU trade with itself and with the group of OECD+BRICS countries. This further information allows us to control for any type of shock that affected a particular country in a particular period, such as the evolution of Covid-19 cases, the introduction and lifting of lock-down measures and any other economic shock. Finally, the synthetic control method allows us to go a step further. Recognising that perhaps not all flows included in our comparison group are equally valid as control units for UK-EU trade, we let the SC algorithm select the subset of countries that best resemble UK-EU trade over the period July 2016-December 2020, and use this subset as the counterfactual for UK-EU trade in 2021. For a more detailed description of the methodology, see the appendix to UKTPO Briefing Paper 57.
Table 1 reports the results for the three methodologies on total UK-EU trade excluding gold (HS code 7108).[4] The three methods yield very consistent results. According to the SCM results (our preferred method[5]), the TCA reduced UK exports to the EU by 13.9% over the period January-July 2021. However, this is all attributable to a reduction of -42% in January and not much in the following months. On the other hand, UK imports from the EU were reduced by -24% over the period January to July, and the effects have been very persistent throughout 2021.
| Exports | Imports | ||||||
| Period | DD | DDD | SC | DD | DDD | SC | |
| Jan-Jul 2021 | -6.3 | -6.3 | -13.9 | -29.4 | -29.9 | -24.0 | |
| January 2021 | -41.0 | -40.0 | -42.3 | -26.7 | -31.8 | -28.8 | |
| February 2021 | -7.1 | -2.5 | -10.6 | -32.6 | -33.8 | -23.2 | |
| March 2021 | -7.8 | -9.8 | -8.7 | -28.8 | -27.2 | -19.4 | |
| April 2021 | -0.5 | 0.7 | -14.2 | -31.0 | -31.8 | -26.9 | |
| May 2021 | 0.8 | -0.2 | -5.5 | -30.8 | -30.9 | -25.8 | |
| June 2021 | 9.1 | 6.2 | -7.5 | -28.4 | -26.8 | -22.2 | |
| July 2021 | 4.2 | 1.9 | -8.6 | -28.5 | -28.3 | -22.0 | |
| The table reports effect of the TCA on UK exports to and imports from the EU in percentage. Figures in bold are those statistically significant. For the SC method, significance is based on permutation tests, while for DD and DDD the significance threshold is 5%. DD=difference in differences, DDD=triple difference, SC=synthetic control. | |||||||
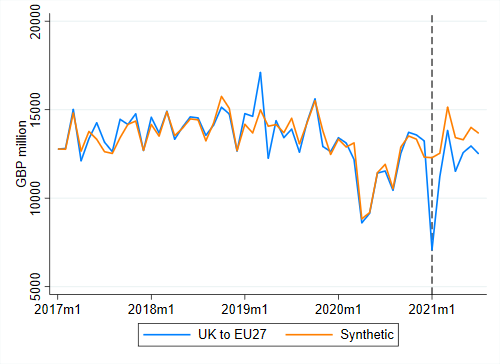
a) UK exports to the EU
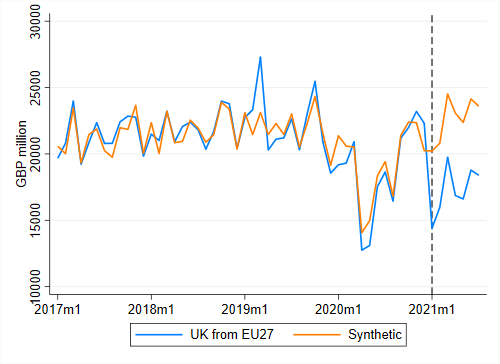
b) UK exports from the EU
We then look at trade disaggregated by product categories, using the 21 sections of the HS classification. We apply the triple difference method to each product group and report the results in Table 2 for exports and Table 3 for imports.[6] Together with the estimated TCA impacts, we also report in the first columns of Table 2 and Table 3 the share of each HS section in exports / imports to the EU in 2019. The results by HS sections show that the TCA had negative persistent effects on some specific products. In particular we see a strong negative impact on Footwear & headgear (-77.2%), Animal and vegetable oils & fats (-63.6%), Textile and clothing (-60.2%), Vegetable products (-43.5%), Foodstuff, beverages and tobacco (-21.2%), Ceramic & glass (-16.9%) and Metals (-12.9%). Apart from Foodstuff, beverages and tobacco, which saw a strong negative effect in January only, all these other product groups show signs of persistent effects in all months of 2021. We notice that in these sectors the EU MFN tariff tends to be higher and given the low preference utilization rates in some of these sectors (see below) it is possible compliance with the TCA rules for accessing preferences is particularly onerous. For other sectors (notably foodstuff and agriculture) the negative impact is likely to be driven the increased border checks and documentary requirements to do with sanitary and phyto-sanitary standards. The picture is different for imports, where we see that the TCA impacts have been more homogeneous across products, and only a few show no sign of a TCA effect.
| HS section | Share 2019 | Jan-Jul | Jan | Feb | Mar | Apr | May | Jun | Jul |
| Animals & animal products | 2.6 | 1.1 | -28.2 | -13.7 | 17.2 | 32.5 | 13.3 | 1.4 | -18.7 |
| Vegetable products | 1.1 | -43.5 | -61.7 | -38.6 | -30.8 | -44.4 | -29.7 | -46.7 | -49.2 |
| Animal and veg. fats & oils | 0.3 | -63.6 | -24.6 | -69.7 | -17.9 | -77.3 | -68.8 | -76.4 | -31.8 |
| Foodstuffs, bev. & tobacco | 4.9 | -21.2 | -64.4 | -31.5 | -17.9 | -11.4 | -4.1 | -16.5 | -4.8 |
| Mineral products | 13.4 | -2.5 | -7.5 | 38.2 | 8.4 | 1.8 | -6.3 | 111.9 | -58.7 |
| Chemicals | 13.9 | -0.5 | -44.1 | 9.8 | -11.4 | -4.1 | -10.2 | 69.8 | 1.6 |
| Plastics & rubber | 4.6 | -11.5 | -44.3 | -9.0 | -8.0 | -8.7 | -4.7 | 2.9 | -9.7 |
| Leather | 0.5 | -23.2 | -47.6 | -23.0 | -8.2 | -5.8 | -33.6 | -20.1 | -23.1 |
| Wood | 0.2 | 23.9 | -50.6 | 30.9 | 17.5 | 87.2 | 56.9 | 25.2 | 16.3 |
| Paper | 1.9 | -10.6 | -42.3 | 3.1 | 4.3 | -9.5 | -7.7 | -1.5 | -18.0 |
| Textile & clothing | 4.2 | -60.2 | -76.7 | -64.4 | -46.9 | -58.7 | -60.6 | -59.9 | -54.1 |
| Footwear & headgear | 1.1 | -77.2 | -89.7 | -81.7 | -72.6 | -72.4 | -75.3 | -70.9 | -74.9 |
| Ceramic & glass | 0.9 | -16.9 | -46.6 | -31.0 | -13.7 | -6.9 | -10.9 | -11.7 | 2.9 |
| Gold & pearls | 3.0 | -16.1 | -27.8 | -77.4 | -77.4 | 2.4 | 212.9 | 151.4 | 117.4 |
| Metals | 5.5 | -12.9 | -45.3 | -0.8 | -20.9 | 7.1 | -11.7 | -9.0 | -9.5 |
| Machinery & electrical eq. | 19.3 | 3.2 | -40.0 | 2.1 | 1.4 | 15.8 | 8.4 | 18.5 | 16.0 |
| Transport eq. | 16.5 | -8.3 | -36.7 | 11.7 | -21.7 | -1.8 | -20.9 | -7.6 | 27.1 |
| Precision tools | 3.9 | 14.1 | -25.3 | 18.2 | 27.0 | 27.7 | 19.9 | 9.8 | 17.7 |
| Arms & ammunitions | 0.1 | 2.2 | -32.8 | -69.1 | 20.8 | 25.6 | 48.7 | -30.5 | 113.7 |
| Miscellaneous manuf. | 2.1 | -15.3 | -53.4 | -6.9 | -16.4 | -5.6 | 11.4 | -6.7 | -27.3 |
| Art & antiques | 0.1 | 1063.3 | 199.5 | 1420.0 | 630.2 | 1495.5 | 4092.4 | 692.4 | 1295.6 |
| The table reports the TCA effects in percent estimated with the triple difference method. Numbers in bold are statistically significant at the 5% level. | |||||||||
| HS section | Share 2019 | Jan-Jul | Jan | Feb | Mar | Apr | May | Jun | Jul |
| Animals & animal products | 3.0 | -40.1 | -36.6 | -45.8 | -39.5 | -38.8 | -39.2 | -36.3 | -45.3 |
| Vegetable products | 2.9 | -24.3 | -17.8 | -28.2 | -23.3 | -37.3 | -25.1 | -18.9 | -23.1 |
| Animal and veg. fats & oils | 0.4 | -46.1 | -3.4 | -74.0 | -20.9 | -55.6 | -55.0 | -46.5 | -41.5 |
| Foodstuffs, bev. & tobacco | 7.5 | -18.1 | -12.8 | -20.6 | -18.6 | -19.5 | -16.0 | -14.1 | -25.5 |
| Mineral products | 3.6 | -20.9 | -21.1 | -13.3 | -25.9 | -26.6 | -34.8 | -17.0 | -1.7 |
| Chemicals | 13.6 | -50.3 | -46.4 | -64.7 | -54.9 | -43.7 | -54.2 | -39.5 | -43.1 |
| Plastics & rubber | 4.6 | -21.8 | -24.5 | -28.9 | -29.3 | -26.2 | -19.1 | -6.7 | -18.7 |
| Leather | 0.6 | -41.7 | -52.4 | -47.1 | -41.9 | -42.2 | -34.5 | -34.2 | -40.8 |
| Wood | 1.2 | -1.1 | -17.4 | -4.9 | 3.3 | 21.5 | 6.1 | 1.2 | -16.4 |
| Paper | 2.0 | -10.9 | -17.6 | -4.7 | -18.3 | -15.9 | -15.2 | 7.3 | -10.2 |
| Textile & clothing | 3.4 | -23.3 | -28.2 | -29.2 | -20.4 | -23.3 | -16.3 | -15.3 | -30.6 |
| Footwear & headgear | 1.2 | -45.1 | -35.0 | -53.9 | -43.7 | -32.3 | -43.6 | -47.2 | -56.2 |
| Ceramic & glass | 1.2 | -30.3 | -29.2 | -40.8 | -31.5 | -24.6 | -19.2 | -21.0 | -42.1 |
| Gold & pearls | 2.7 | -43.3 | -44.4 | -4.1 | -45.4 | -41.9 | -47.8 | -81.3 | 29.2 |
| Metals | 5.8 | -28.9 | -24.3 | -21.9 | -26.7 | -24.1 | -25.8 | -40.2 | -34.9 |
| Machinery & electrical eq. | 19.6 | -23.0 | -31.5 | -28.4 | -20.3 | -26.1 | -19.8 | -17.6 | -17.8 |
| Transport eq. | 20.7 | -24.6 | -25.7 | -19.5 | 3.1 | -28.4 | -40.5 | -10.9 | -45.4 |
| Precision tools | 3.3 | -19.8 | -16.1 | -21.2 | -11.0 | -19.7 | -25.5 | -25.8 | -19.2 |
| Arms & ammunitions | 0.1 | -25.9 | -87.6 | -21.6 | -0.8 | 4.3 | -1.6 | 22.3 | 4.5 |
| Miscellaneous manuf. | 2.4 | -30.5 | -27.4 | -36.1 | -34.4 | -23.0 | -24.2 | -29.8 | -36.4 |
| Art & antiques | 0.1 | 4.9 | -6.1 | 124.6 | -44.6 | 224.3 | 110.4 | -96.9 | -18.9 |
| The table reports the TCA effects in percent estimated with the triple difference method. Numbers in bold are statistically significant at the 5% level. | |||||||||
We also disaggregate products by ‘end-use’ categories using the BEC product classification and apply the triple difference method to each end-use category: capital goods, final consumption goods and intermediate goods. From intermediate goods we exclude gold (HS 7108) for consistency with the analysis of aggregate trade. Results are reported in Table 4. We find again a significant effect on exports only in January 2021, with consumption goods being the most affected and capital goods the least affected. On the other hand, there are only small differences in the imports effects across the three types of goods, and the negative imports results are again persistent across all months of 2021.
| Period | Capital Goods | Consumption Goods | Intermediate Goods | |||||
| Exports | Imports | Exports | Imports | Exports | Imports | |||
| Jan-Jun 2021 | 8.2 | -31.8 | -8.8 | -32.2 | 2.3 | -28.7 | ||
| January 2021 | -34.9 | -39.4 | -45.1 | -35.8 | -38.2 | -28.9 | ||
| February 2021 | 23.0 | -37.1 | -11.9 | -38.5 | -1.8 | -32.4 | ||
| March 2021 | 3.5 | -26.3 | -11.8 | -33.6 | -10.8 | -25.5 | ||
| April 2021 | 14.5 | -32.1 | -5.7 | -32.5 | 18.1 | -27.6 | ||
| May 2021 | 12.4 | -33.8 | -3.3 | -28.6 | 7.1 | -30.8 | ||
| June 2021 | 9.4 | -24.0 | 16.1 | -26.6 | 41.5 | -27.0 | ||
| July 2021 | 27.0 | -33.0 | -0.8 | -30.8 | 8.1 | -28.1 | ||
| The table reports the TCA effects in percent estimated with the triple difference method. Numbers in bold are statistically significant at the 5% level. | ||||||||
Under the TCA, UK exports to the EU face zero-tariffs and zero-quotas. However, to claim zero tariffs, exporters must meet the rules of origin requirements and be able to provide proof of origin.[7] The rules of origin are set at the product level and based on one of four criteria—Whole obtained (WO), Value-added (VA), Change in tariff classification (CTC) and Specific production process (SP). These rules can also be used in combination for a given product. [8] These different criteria are all different ways of determining whether ‘enough’ economic activity has taken place in the UK, for the good in question to be deemed as originating in the UK.
Meeting the underlying rules of origins is complex. Where exporters do not meet the requirements, they end up paying the tariff. Note, however, that even those exporters that can meet the rules of origin requirement, because of the cost of the paperwork and requirements for proof of origin needed to claim the zero tariff, may instead choose to pay the tariff. The latter is more likely where the tariff preference margin (i.e., the difference between the most favoured nation (MFN) tariff and the zero-tariff under TCA) is very low. These problems— the rules of origin requirements and costs associated to claim zero-tariff—could be particularly challenging for smaller companies. All this shows that, in practice, firms may end up paying tariffs despite the zero-tariff and zero-quota deal under the TCA.
In this section, we provide information on the extent to which tariff preferences provided under the TCA have been utilized by UK exporters over the first seven months of 2021. We provide three metrics:
In general, the three utilization measures provide important information on whether UK firms are complying with the rules of origin (RoO) and utilizing the zero-tariff preference provided in the agreement effectively. In interpreting the following figures, also note that under the TCA for the first 12 months of 2021, the UK and the EU have agreed for firms not to require the supporting documentation proving origin at the time of shipping the goods. They may, however, be required subsequently to provide that proof retrospectively.
Table 5 shows the values of the UK aggregate and monthly exports to the EU under each preference eligibility regime, the PUR, and tariff-free trade for the first seven months for all goods excluding inward and outward processing trade.[10] It shows that for the first seven months of 2021, the value of UK exports to the EU still paying tariffs was between £7.89 billion and £10.56 billion.[11] For the first seven months, the PUR is 74.1%. If we include inward and outward processing regimes where it is unclear whether or not the tariff ends up being paid, the aggregate preference utilization rate for the first two months would be 68.13%. These numbers imply that between 26-32% of UK exports to the EU that could have entered under zero-tariffs did not do so. It shows that despite the zero-tariff, zero-quota trade agreement of the TCA, a wide range of exporters are nevertheless paying tariffs.
The monthly PUR rate over the first seven months is as follows: in January 2021 it was 67.8%, it then rose to 71.1% in February, 74.2% in March, and 74.6% in April, 77.14% in May and then dropped down to 75.1% in June and 75.15% in July. While the PUR shows an improvement over time, it is still at around 75%. This means that a significant share of UK exports to the EU are paying a tariff. Although the PUR could increase if firms pay a tariff first and claim a refund later, the broader picture is most likely going to hold. The table also shows that tariff-free trade slightly increased to 88.3% in June starting from 85.1% in January.
Table 6 shows the duty saving rates for the first 7 months of 2021 for UK exports to the EU. Preference utilization measured by duty rates is 77.5%, which is slightly higher than the PUR. In total, UK exporters to the EU saved £1841 million over the first 7 months (ie had there been no deal and with no tariff preferences this would be the amount that would have been paid in tariffs). The potential duty saving in the same period was £2376.2 million. Therefore, £534.6 million is the forgone duty saving.
| Month | MFN zero | MFN non-zero | Preference Zero | Unknown | Utilization rate | Tariff free trade |
| January | 2040.65 | 746.32 | 1573.32 | 635.81 | 67.83 | 85.06 |
| February | 3275.71 | 1239.65 | 3047.21 | 624.31 | 71.08 | 84.86 |
| March | 4356.35 | 1429.91 | 4115.76 | 636.35 | 74.22 | 86.43 |
| April | 4175.15 | 1173.73 | 3459.02 | 569.39 | 74.66 | 87.48 |
| May | 3950.65 | 1031.69 | 3481.14 | 695.64 | 77.14 | 88.74 |
| June | 4484.92 | 1165.23 | 3514.61 | 745.51 | 75.10 | 88.24 |
| July | 4336.11 | 1105.27 | 3343.01 | 667.75 | 75.15 | 88.31 |
| Jan-July | 26619.53 | 7891.81 | 22534.07 | 4574.76 | 74.06 | 87.19 |
| Month | Potential duty savings, £m | Actual duty savings, £m | Duty savings rate , % | Foregone duty savings, £m |
| January | 201.75 | 150.97 | 74.83 | 50.78 |
| February | 332.16 | 250.89 | 75.53 | 81.27 |
| March | 431.28 | 330.54 | 76.64 | 100.73 |
| April | 357.57 | 278.38 | 77.85 | 79.19 |
| May | 348.00 | 281.12 | 80.78 | 66.88 |
| June | 357.62 | 277.01 | 77.46 | 80.61 |
| July | 347.81 | 272.68 | 78.40 | 75.13 |
| Jan-July | 2376.19 | 1841.60 | 77.50 | 534.59 |
Looking at the aggregate PURs analysis can hide substantial variation in the PUR across sectors. Table 7 shows the PURs by HS sections. It shows that shows that HS section Live Animals has the highest preference utilization rate at 96.6% followed by minerals products (95.7%), vegetable products (91.1%) and animal or vegetable fats (89.2%). The higher level of the preference utilization in these sectors could primarily be due to the dominance of wholly obtained rules of origin criteria, where it can be more easily fulfilled by UK exporters. Table 7 also shows that the lowest PURs is observed HS section Footwear (22.8%) followed by Hides and skins (30.4%) and Textile (43%).
Table 7 also shows the duty saving by the HS sections. The highest duty saving rate is for HS section Live Animals (97.6%) followed by Vegetable products (93.3%) and prepared foodstuff (87.8%). The lowest duty saving is in Footwear (32%) followed by Hides and skins (34.6%) and Textile (41.9%). This shows that duty saving rates and utilization rates provides similar results.
| HS section | Utilization rate, % | Tariff free trade, % | Duty savings rate, % | Foregone duty savings, £million |
| Animals & animal products | 96.56 | 97.65 | 97.59 | 11.72 |
| Vegetable products | 91.07 | 94.52 | 93.31 | 4.93 |
| Animal and veg. fats & oils | 89.19 | 91.4 | 84.32 | 2.15 |
| Foodstuffs, bev. & Tobacco | 85.83 | 91.83 | 87.85 | 26.11 |
| Mineral products | 95.69 | 98.75 | 86.5 | 8.73 |
| Chemicals | 82.77 | 92.28 | 81.65 | 52.07 |
| Plastics & rubber | 79.02 | 81.56 | 77.92 | 45.41 |
| Leather | 30.38 | 47.23 | 34.66 | 4.07 |
| Wood | 81.03 | 93.06 | 85.59 | 0.6 |
| Paper | 100 | 0 | ||
| Textile & clothing | 43.11 | 51.8 | 41.88 | 79.21 |
| Footwear & headgear | 22.77 | 34.39 | 32.36 | 11.51 |
| Ceramic & glass | 74.23 | 82.96 | 74.93 | 5.51 |
| Gold & pearls | 19.13 | 98.28 | 19.02 | 2.18 |
| Metals | 75.36 | 90.26 | 75.73 | 20.18 |
| Machinery & electrical eq. | 63.96 | 80.51 | 54.53 | 74.13 |
| Transport eq. | 71.03 | 75.22 | 69.74 | 171.57 |
| Precision tools | 51.7 | 90.76 | 44.45 | 7.87 |
| Arms & ammunitions | 62.92 | 69.05 | 64.82 | 0.19 |
| Miscellaneous manuf. | 60.15 | 76.36 | 61.62 | 6.48 |
| Art & antiques | 100 | 0 |
For UK exporters to claim zero tariff under the TCA, they must provide paperwork for proof of origin which increases their costs. If the tariff preference margin (i.e., the difference between MFN non-zero tariff and the zero-tariff under TCA) is very low, then exporters may instead choose to pay the tariff. Therefore, we might expect higher a preference utilization rate where tariffs are higher. Table 8 largely shows that the preference utilization rate is indeed higher for higher tariff ranges. The utilization rate for goods tariff range >20% is higher than tariff range 1-5% by more than 20%.
| Tariff range | MFN zero | MFN non-zero | Preference Zero | Unknown | Utilization rate | Tariff free trade |
| 1-5% | 1892.3 | 4173.6 | 9500.9 | 595.0 | 69.5 | 74.2 |
| 5-10% | 217.9 | 1677.7 | 7292.9 | 480.6 | 81.3 | 82.6 |
| 10-15% | 2.9 | 1772.7 | 3754.0 | 230.6 | 67.9 | 69.2 |
| 15-20% | 0.3 | 82.0 | 328.5 | 51.3 | 80.0 | 82.3 |
| >20% | 1.5 | 148.2 | 1518.4 | 508.2 | 91.1 | 93.2 |
The preceding sections have been solely focused on goods trade. However, a very significant portion of UK trade is in services. In 2019, 46% of the UK’s total exports and 30% of total imports were services. Exports and imports of services to and from the EU amounted to £124 billion and £106 billion, respectively. Like goods trade, the EU is the UK’s biggest trading partner of services.[12]
Trade in services data is sourced from the ONS’ quarterly estimates. These data do not present the same degree of granularity nor are they released with the same frequency as goods trade data and, as such, seem to have received less attention in public discourse. To estimate a TCA effect on services trade, we subject the data to the DD estimation technique applied previously. Figure 4 shows the comparison of the UK’s exports and imports of services to and from the EU against those to and from our control group of OECD+BRICS countries.
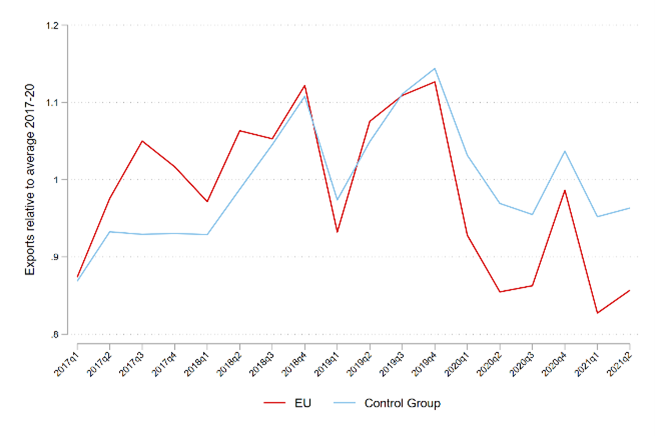
a) Exports
b) Imports
The quarterly movements of exports to both destinations are relatively synchronised but it is clear that exports to the EU in 2021 are substantially lower than their 2017-20 average values. This is even more pronounced in the case of imports where we observe a greater and widening gap between the two groups. Our estimates quantify a TCA effect of -11.5% and -37% on the exports and imports of services, respectively, for the first half of 2021. The effects are relatively stable in the two quarters: -14% and -12% for exports in Q1 and Q2, respectively; and -37% and -36% for imports. All estimates are statistically significant at the 5% significance level.
Data on trade in services by country and type of service is limited to important partners, aggregated for geographic regions, and is often suppressed. Therefore, we are not able to apply the DD and DDD methods as we are not able to construct the control group of OECD+BRICS. For this reason, we look at the aggregated export and import values to and from the EU and the rest-of-the-world. The comparison is done in a similar manner by calculating percentage changes relative to the 2018-20 averages, and by taking the difference between EU and non-EU changes.
Table 9 shows the results of this exercise for total services and 12 broad categories of services type. For instance, in the first six months of 2021 exports of financial services to the EU were 24% lower than its respective 2018-20 average value. Exports of financial services to non-EU countries, on the other hand, was 2% lower. Under the assumption that the Covid-19 pandemic, among other economic shocks, affected trade with the EU and non-EU equally, trade with non-EU acts as a simple counterfactual. Thus, the exercise quantifies the TCA effect for this type of service at -24%-(-2%) = -22 percentage points.
Looking at other service types, we find that the biggest adverse changes in services exports and imports to and from the EU were for travel services. However, this is also the case for non-EU countries, which would imply the absence of a TCA effect for this service type.
Most of the service types display cases where the percentage change in trade with the EU was larger than with non-EU countries. The negative differences (as in the 3rd and 6th columns of the table) are indicative of TCA effects. The most prominent differences are for construction services. Increases in the export of construction services to non-EU countries were driven by substantial increases in exports to Russia, Singapore and USA. More research has to be done in this area to provide more specificity.
Numerous plausible reasons may explain the variation in differences displayed in the table. On the one hand, specific TCA provisions on services would have had an effect on the amount of services trade between the UK and EU. For example, in the TCA air traffic rights were reduced, which can explain, at least in part, the decrease in trade for transportation services. Similarly, the TCA does not contain provisions on mutual recognition of professional qualifications (MRPQs), which would also have adverse effects on those services that require the physical movement of persons. Related to the latter, the main mode of supply of these service types may provide another possible explanation of the variation exhibited in the table. Likewise, this is scope for future research on the TCA effect on services trade.
| Exports | Imports | |||||
| EU | Non-EU | Diff | EU | Non-EU | Diff | |
| 0 Total Services | -13.3 | -4.4 | -8.9 | -36.9 | -6.4 | -30.5 |
| 1 Manufacturing | -2.5 | -35.6 | 33.2 | 1.4 | -44.5 | 45.9 |
| 2 Maintenance and Repair | -58.5 | 11.2 | -69.7 | -24.5 | 42.3 | -66.8 |
| 3 Transportation | -22.6 | -5.7 | -16.9 | -57.3 | -30.4 | -26.9 |
| 4 Travel | -68.3 | -60.8 | -7.5 | -75.6 | -75.2 | -0.5 |
| 5 Construction | -26.1 | 89.1 | -115.2 | -10.4 | 37.6 | -48.0 |
| 6 Insurance and Pension | 0.5 | 11.5 | -11.0 | -17.2 | 9.7 | -26.9 |
| 7 Financial | -24.4 | -2.2 | -22.2 | -22.0 | 10.2 | -32.2 |
| 8 Intellectual property | -2.4 | -11.7 | 9.4 | -7.9 | 22.4 | -30.3 |
| 9 Telecomms | 2.3 | -2.6 | 4.9 | -18.4 | -12.0 | -6.5 |
| 10 Other Business Services | 6.4 | 4.8 | 1.6 | -12.7 | 10.3 | -23.0 |
| 11 Personal, Cultural and Recreational | -9.8 | -11.9 | 2.1 | 51.9 | 17.8 | 34.1 |
| 12 Government | -31.9 | -26.5 | -5.4 | -13.1 | 9.3 | -22.4 |
Our analysis of trade data for the first seven months of 2021 shows that the introduction of the TCA reduced trade between the UK and the EU. We find that over the period January-July 2021 UK goods exports to the EU fell by -13.9% while goods imports from the EU fell by -24%. However, we note that exports have been strongly affected in January 2021 (-42%) and they quickly recovered in the subsequent months. On the other hand, imports remained persistently affected in all months of 2021. When we look at trade by product groups we find quite homogeneous effects across products for imports. However, for exports, the TCA effect appears to be concentrated in a few sectors that have seen drastic reductions in sales to the EU. The differential impacts on exports in comparison to imports, and the persistent negative substantial impact on imports in comparison to exports is somewhat surprising and more work will need to be undertaken to explain the driving factors.
It should be noted that while the TCA allows tariff-free trade between the UK and the EU, preferential access to the EU market comes at a cost. In July 2021, the preference utilization rate of UK exporters was only 75%, with marked differences across products. We also looked at the first two quarters of services trade data, a sizeable portion of UK total trade. Again, we find that UK imports from the EU have been more affected than UK exports with both of these declining as a result of the UK’s exit from the EU. Over the first two quarters of 2021, UK exports to the EU fell by -11.5% while UK imports fell by -37%.
It is important to underline that this ongoing analysis only focuses on the immediate, and short-run impacts on UK trade. These numbers do not reflect the longer-run impacts on changes in trade flows, production and specialisation in the UK as these will take much longer to evolve. Nevertheless, the impacts are striking. Finally, we stress that these results do not distinguish between the impacts by firm type, and notably firm size. We would expect, and casual empiricism supports this, that the challenges and impacts of trading with the EU, are more likely to be greater for small and medium-sized enterprises. This is an area of research to be explored in future work.
[1] Ayele Y., Larbalestier, G., Tamberi N., 2021, Post-Brexit: UK Trade in Goods, UKTPO: https://blogs.sussex.ac.uk/uktpo/publications/post-brexit-uk-trade-in-goods/
[2] See, for example, Jerzewska, A. 2021, The impact of a new customs and regulatory border with the EU for UK companies trading goods, UKTPO: https://blogs.sussex.ac.uk/uktpo/publications/the-impact-of-a-new-customs-and-regulatory-border-with-the-eu-for-uk-companies-trading-goods/
[3] See for example latest analysis by the Centre for European Reform on the Cost of Brexit, analysis by UK in a Changing Europe on Trade after Brexit, or reporting by the Financial Times.
[4] We exclude gold trade because of its particular nature and volatility.
[5] We prefer the SC method over the DD and DDD method because it explicitly selects the counterfactual as the subset of flows that bests mimics UK-EU trade before the TCA.
[6] We do not apply the SCM at the HS section level because product-level data can become very noisy, and the SCM is not particularly suited in presence of high volatility.
[7] Initially, the TCA does not require third party certification of proof of origin. It allows self-certification by the exporter and importer.
[8] See for more discussion on RoO. https://blogs.sussex.ac.uk/uktpo/files/2021/01/Briefing-paper-52.pdf
[9] The EU MFN import tariff data is for 2019 and from UNCTAD. The tariff includes Ad Valorem Equivalent tariff estimates of quota and TRQs.
[10] The inward or outward processing trade is an import or export of goods temporarily for further processing and the tariff category end up paying may depend on what ends up happening to the goods.
[11] There is some uncertainty due to the amount of trade arriving under inward and outward processing regimes where it is unclear whether or not the tariff ends up being paid.
[12] ONS Pink Book 2020, Chapter 9.