Note: For further information on the values of the Regulatory Indices for 2021, please consult the data at the 2-digit HS level.
Product Regulations and Directives and their Impact on International Trade
How the Indices are constructed from EU Regulations and Directives
Descriptive Overview of the Regulatory Intensity Indices
The United Kingdom’s (UK) exit from the European Union’s (EU) Single Market and Custom Union has various implications for firms that engage in international trade in both markets. Key among these concerns are the product regulatory barriers that firms now face: UK exports to the EU can no longer be automatically deemed compliant with EU regulatory requirements and hence have to be subjected to various conformity checks, customs formalities, and inspections at the borders. The unravelling of almost 40 years of regulatory integration between the UK and EU could therefore result in added costs for UK firms that export to the EU.
Product regulatory barriers between the UK and EU have implications also for the position of Northern Ireland (NI) post-Brexit. The Northern Ireland Protocol of the Withdrawal Agreement and the successive Windsor Framework stipulate that Northern Ireland remains a member of the EU Single Market for goods, and hence all goods that are sold in Northern Ireland must meet EU Single Market requirements – including all NI purchases from the rest of the UK. Simply put, trade between Great Britain (GB) and EU, as well as that between GB and NI, will be impacted by the application of current EU Single Market product regulations as well as by any future divergence in regulations that might occur between the UK and the EU. From the perspective of NI producers, however, the Windsor Framework creates a position which is more favourable than that of GB firms when serving the EU market, and more favourable than that of EU firms when serving the GB market. NI firms benefit from what has been termed ‘dual market access’, as their access to the EU and the rest of the UK remains the same as pre-Brexit, and is unaffected by the new border formalities and regulatory barriers faced by either GB or EU firms when serving each other’s markets.[1]
To be able to quantify the potential impacts of these regulatory barriers for GB firms or, conversely, potential advantages arising from the lack of barriers of NI firms, we must measure the requirements and obligations arising from EU Regulations and Directives that firms have to comply with when exporting to the Single Market. The approach needs to consider the various categories of regulatory burdens that firms are likely to face. This is because, even if we assume that GB exporters currently meet EU standards and produce according to the same technical requirements as EU firms, there are still other potential regulatory costs that exporters might face when exporting to the EU. For instance, the cost of obtaining the requisite information (which keeps changing), or to undergo conformity assessment testing, labelling costs, documentation costs, time of border inspections and delays, among others. These requirements certainly also differ across various products. An ideal measure of regulatory obligations must capture all these differences, both by type of regulatory requirement and by type of product.
In this briefing paper, we introduce new indices that capture the regulatory obligations for products exported to the EU’s Single Market. These indices are based on an analysis of core EU Regulations and Directives, aiming to measure the complexity of these legislative acts as a proxy for the regulatory barriers they impose. Three dimensions of regulatory obligations are captured by the new indices. The first group of obligations relate to the technical requirements that firms must produce, including, for instance, labelling and packaging rules, and maximum residue limits. The second dimension captures the conformity assessment procedures that firms must follow before placing a product on the market. A good example is the CE declaration of conformity that manufacturers must draw up to demonstrate that their products meet EU requirements.[2] The third dimension involves the compliance checks, such as those conducted at factories, or at the borders. The indices presented here capture these obligations at the detailed 6-digits level of the Harmonised System classification (HS6-digits) and can serve as a useful tool to capture the impact of EU product regulation on GB-EU trade, trade from GB to NI, as well as EU imports from the rest of the world. On the other side of the coin, these indices can be indicative of potential advantages, in the form of lack of various kinds of obligations when serving the EU, for firms based in NI over firms based in GB.
The rest of the briefing paper is structured as follows: a background discussion of product regulations and directives and their impact on international trade, the UK-EU context, an explanation of how the indices are constructed and a descriptive analysis of the indices.
Product Regulations and Directives within the EU are legally binding legislative acts that set out the requirements that products must comply with when sold on the EU Single Market. Specifically, they set out guidelines and rules with regards to product safety, marking and labelling, standards of production, product certification, compliance checks, amongst others. These may apply to specific sectors, products, or generally to all products.
EU Regulations apply directly at the national level and have supremacy over domestic laws that overlap with them. EU Directives, on the other hand, set out targets or minimum requirements that member countries are expected to achieve and have to be transferred into national laws by EU Member States. The main rationale for this EU legislation is to protect the interest of the general public by putting in place mechanisms to correct any negative externalities that might arise from the activities of economic actors. These Regulations and Directives, however, might have implications for international trade in addition to their intended welfare impacts.
The total effects of product regulation on international trade cannot easily be predicted. This is because product regulation can either boost international trade or deter it. Product regulation can increase the demand for the regulated products through quality signalling as well as having trade facilitating effects through improved access to regulated markets, especially for firms that are able to meet the requirements (Chen and Mattoo, 2008[3]; Maertens and Swinnen, 2009[4]; Xiong and Beghin, 2014[5]; Curzi et al., 2020[6]). However, product regulation can also restrict trade: the imposition of technical, information, and compliance requirements are likely to raise costs for firms and can act as non-tariff barriers to trade (Ferro et al., 2015)[7].
Due to the fact that the impact of non-tariff measures (NTMs) on international trade is an empirical question, it is necessary to find adequate proxies or measures. Measures that have been employed in the literature include the UNCTAD TRAINS database on NTMs (Essaji 2008[8]; Murina and Nicita 2017[9]; Timini and Conesa, 2019[10]; Peci and Sanjuan, 2020[11]), explicit measures such as maximum residue levels of pesticides (Drogué and De Maria, 2012[12]; Xiong and Beghin, 2014; Ferro et al., 2015; Fiankor et al., 2021a[13]), the global trade alerts database that captures trade policy data (Kinzius et al., 2019[14]), as well as data on specific trade concerns raised at the WTO that are considered as barriers to trade (Fontagné et al, 2005[15]; Crivelli and Gröschl, 2016[16]; Fontagné and Orefice, 2018[17]; Fiankor et al., 2021b[18]). All these measures do not capture the intensity of non-tariff measures however, which is a dimension captured by the regulatory intensity indices presented in this briefing paper.
Prior to leaving the European Union, the UK’s product regulatory framework was highly determined by EU legislation and institutions which the UK had a part in formulating together with other EU Member States. The UK’s departure from the EU put an end to this and restored the UK’s regulatory independence through the passage of the EU Withdrawal Act of 2018. The EU Withdrawal Act ensured continuity in the UK’s legal system by bringing all EU laws and Regulations that applied to the UK pre-Brexit into UK domestic law as part of the retained EU laws[19]. However, even though these retained EU laws continue to apply in the UK, the UK now has the legal freedom to draw up its own new regulations, repeal or amend the retained EU laws, and implement them to meets its domestic and international objectives without necessarily emulating what the EU does.
The UK’s ability to determine its own product regulatory framework post-Brexit however means that EU and UK regulatory environment might diverge either through changes to legislation (active divergence) or through the making of new laws in either jurisdiction that is not emulated by the other (passive divergence). These changes to the UK’s regulatory environment, the additional regulatory obligations that UK exporters might have to meet when trading with the EU, and the uncertainty it creates for UK firms can become a source of added costs.
Northern Ireland (NI) stands in a unique position from the rest of the UK in this case, as it is within the UK internal market and its custom territory but remains also inside the EU Single Market for goods. This solution allowed to avoid the creation of a hard border[20] between NI and the Republic of Ireland, and was formalized in the Protocol on Northern Ireland (or Northern Ireland Protocol, henceforth NIP) to the Withdrawal Agreement. This arrangement implies that, on the one hand, NI firms have ‘unfettered’ access to the rest of the UK, and, on the other hand, goods sold in NI (either produced in NI or imported from GB) must comply with EU Single Market Regulations and Directives. To this end, Annex II of the NIP lists a set of (approximately 300) EU Regulations and Directives that goods sold in NI must meet: this legislation can be thought of as the principles that the EU considers fundamental to protect the integrity of the EU Single Market, and forms the basis from which our new indices on product regulatory intensity are derived.
The indices on regulatory intensity (RII’s) are constructed to capture the obligations that EU Regulations impose on products placed on the EU Single Market. These obligations apply without discrimination to all (EU and non-EU) producers and distributors, and therefore also on all EU imports from non-EU countries. For this reason, we can use these indices as a measure of regulatory barriers to trade with the EU.
The indices capture the complexity of regulatory obligations related to three areas: technical requirements, conformity assessments, and compliance checks. The steps outlined below describe how the indices were constructed.
Table 1: Keywords by area, grouped by synonyms
|
Technical Requirements |
Conformity Assessment |
Compliance |
|
harmonised standards |
conformity assessment |
border control |
|
harmonise |
conformity assessment procedure |
customs control |
|
standards |
declaration of conformity |
checks |
|
inspection |
||
|
quality standards |
accreditation |
Verify/verification |
|
marketing |
accredited |
sampling |
|
certificate |
||
|
technical documentation |
certification |
authorise |
|
specifications |
EU type |
authorisation |
|
production procedure |
EC type |
authority |
|
essential requirement |
approval procedure |
|
|
CE marking |
comply |
|
|
maximum |
conformity marking |
compliance |
|
minimum |
affix |
|
|
weight |
monitor |
|
|
Codex Alimentarius |
notified body |
monitoring |
|
residue |
surveillance |
|
|
traceability |
||
|
label |
hazard |
|
|
labelling |
||
|
package |
license |
|
|
packaging |
||
|
penalties |
Note: in each column the keywords have been grouped by potential synonyms, i.e. in the column for Technical Requirements the 18 keywords have been divided into 5 synonyms groups. This implies that, for a certain Regulation, the maximum index COUNT is 5, whereas the maximum index SUM depends on all the instances each of the 18 keywords are found.
Table 2 presents the summary statistics for the eight indices constructed on the basis of the 257 EU Regulations and Directives. These include indices based on the structure as well as the content of the Regulations.
Table 2: Summary Statistics of Indices Extracted from 257 Regulations and Directives
|
Mean |
Median |
Std. Dev |
Minimum |
Maximum |
|
|
Structure |
|||||
|
Number of articles |
29.98 |
21 |
32.24 |
1 |
283 |
|
Total number of words |
9614.58 |
5499 |
15166.29 |
408 |
144875 |
|
Content |
|||||
|
SUM |
|||||
|
Technical requirements |
45.54 |
23 |
63.58 |
0 |
564 |
|
Conformity assessments |
45.16 |
2 |
113.93 |
0 |
1016 |
|
Compliance checks |
108.50 |
35 |
210.84 |
0 |
2006 |
|
COUNT |
|||||
|
Technical requirements |
3.73 |
4 |
2.06 |
0 |
10 |
|
Conformity assessments |
1.55 |
1 |
2.01 |
0 |
10 |
|
Compliance checks |
3.52 |
3 |
1.10 |
0 |
11 |
Source: Authors’ calculations.
The number of articles as well as the total number of words per Regulation are the two indices based on structure. The number of articles and total number of words for the average Regulation are approximately 30 articles and 9615 words, respectively. There is a great deal of variation, however.
For the indices based on structure, both the SUM and COUNT indices are presented here. All three of the SUM indices display positively skewed distributions indicated by the much lower medians in comparison to the means. The conformity (sum) index has a very low median value of 2 keywords. This implies that 50% of the Regulations and Directives in our list have 2 or less keywords referring to conformity obligations. The same can be said for the other two SUM indices, where one can observe that there is a concentration of obligatory requirements in a few Regulations, due to the high maximum values, high standard deviations, and low median values in comparison to the mean of the indices.
When we consider the COUNT indices, based on counting the occurrence of synonym groups for our keywords, we note that the average (median) Regulation features 4 keywords groups related to Technical Requirements, 1 related to Conformity Assessments and 3 in regard to Compliance checks. For the rest of the analysis that follows, we mainly focus on the COUNT indices.
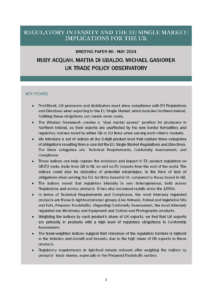
The regulatory intensity indices at the HS6-digits product level are presented next. Figure 1 depicts both the number of HS6-digits products that are regulated over time, as well as the average number of Regulations applicable to a given product over time. The number of regulated products within the Single Market has witnessed a sharp increase over the period under consideration. According to the set of Regulations in our list, as of 1990 2286 products were regulated within the EU Single Market. By 2021, 5074 (out of approximately 5300) HS6-digits products were regulated. Associated with the increase in the number of regulated products, there was also an increase in the average number of Regulations applicable to a given HS6- digit product. The average number of Regulations per product rose from less than 2 in the 1990s to close to 8 as of 2021.
Figure 1: Number of regulated products and average number of regulations per product over time
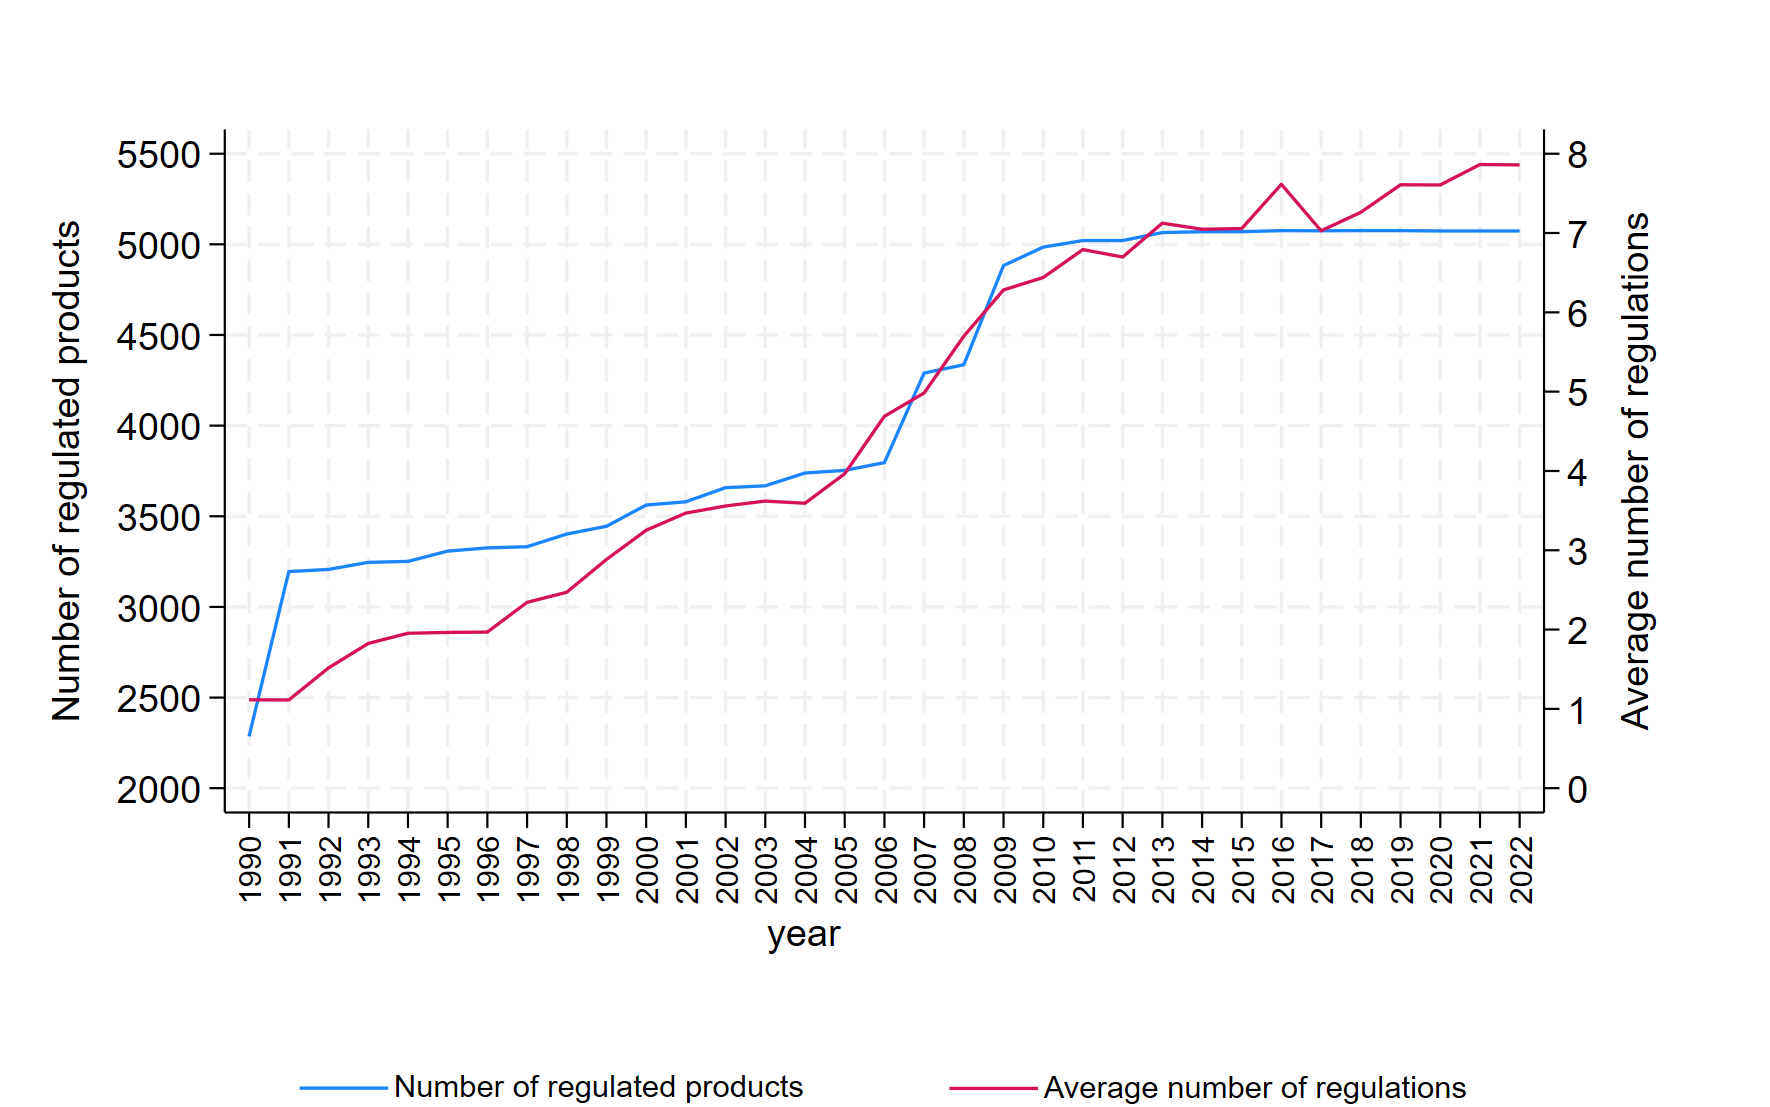
Next, we present some descriptive analysis of the indices on Technical Requirements, Conformity Assessment and Compliance. To compute the regulatory intensity indices at the product level we sum the indices for all the Regulations that apply to a given HS6-digits product at a given point in time. The distributions of the three COUNT indices at the HS6-digits product level are presented in Figure 2. The range of the product level indices as well as their mean values are also presented. Again, very skewed distributions appear: the average regulated HS6-digit product has an intensity index of 12.34 for Technical Requirements, 3.99 for Conformity Assessment and 11.14 for Compliance Checks. Note also that the range of the indices is similar for Technical Requirements and Compliance, and lower for Conformity Assessment.
Figure 2: Distribution of Regulatory Indices (Count)
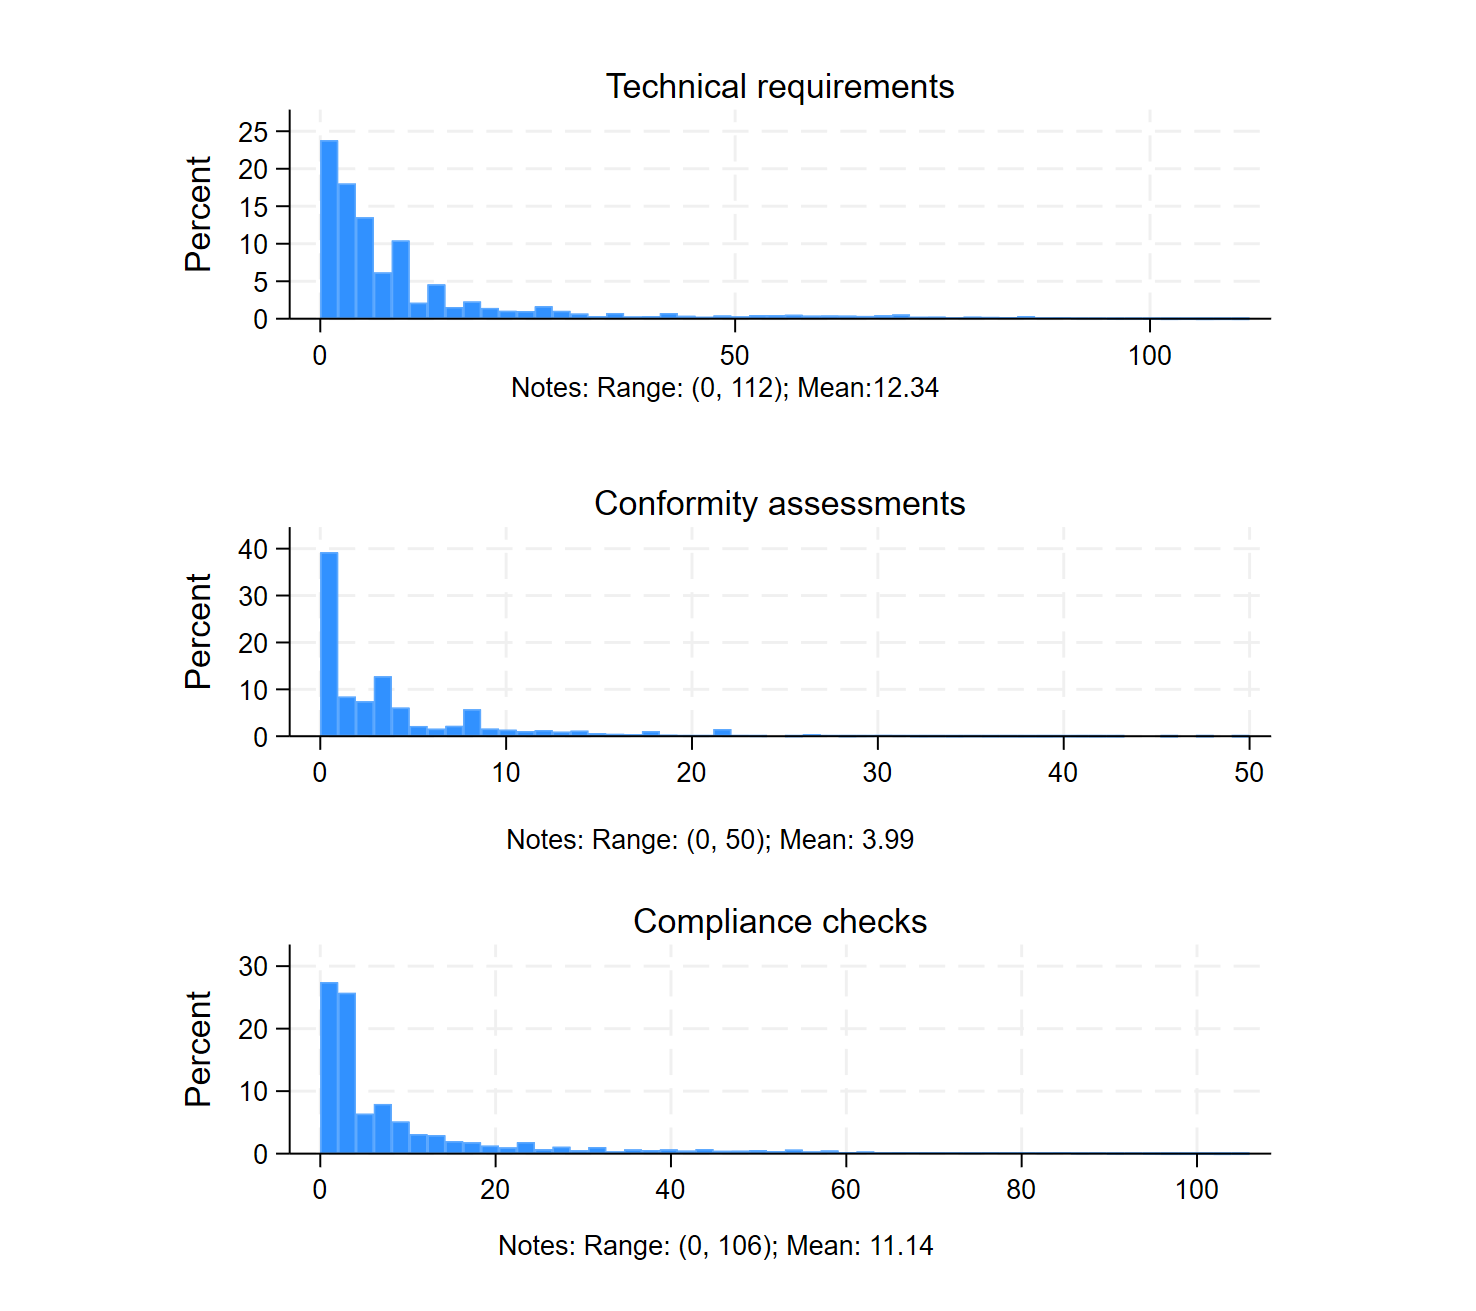
Figure 3 presents the yearly mean regulatory intensity indices calculated over all the regulated HS6-digits products. The solid lines denote simple (unweighted) averages of the indices, while the dashed lines denote weighted averages of the indices, where the share of an HS6-digits product in total UK exports to the EU is used as weight. Regulatory obligations imposed on firms that sell in the EU Single Market have been on a steady increase since the 1990s. The general (mean) trend in regulatory intensity has grown steadily over the period, in line with the increase in the number of Regulations and products covered, observed in Figure 1.[25] Technical Requirements and Compliance obligations have trended together at a similar level, while Conformity Assessment grew more slowly and at a lower level. We can also observe that the general upward trend is confirmed when we weigh each product by its relevance in the UK’s export basket.
A couple of interesting points emerge from the weighted indices. First, overall, there is not enough heterogeneity across the product-level indices and their trade shares for the weighted averages to result in substantially different trends, compared to the unweighted averages. Second, a few noticeable differences do emerge, however: the weighting reduces the mean values of Technical Requirements and Compliance, more or less throughout the entire period (more evidently so over the first half of the period), and increases the value of Conformity Assessment (especially post 2014). This implies that the value of UK trade with the EU is somewhat skewed towards products that face more Conformity Assessment requirements, rather than the other two sets of obligations. Interestingly, all the weighted indices decline post 2020, more so for Technical Requirements and Compliance than for Conformity, however. This period was characterized by a contraction in trade with the EU due to both Brexit and the Covid-19 pandemic (distinguishing between the two shocks is way beyond the scope of this briefing paper), but it is interesting to see that trade might have somewhat been re-oriented towards the less regulated products.[26]
Figure 3: Average product regulatory complexity over time
NB: Weights are computed as the share of an HS6 products’ exports in UK exports to the EU. Trade data is sourced from UN-COMTRADE.
We now analyse product regulatory intensity at a more disaggregated level. Table 3 presents the number of EU Regulations on our list that apply to the 21 product sections of the HS classification for the years 1990, 2010 and 2021. The changes in the number of Regulations by HS sections over the 1990-2021 period are presented in the second to last column. The final column reports the export shares of regulated products in total UK exports by HS sections (averaged over the 1996-2021 period).
As of 1990, 6 out of the 21 HS product sections did not have any Regulations on our list applying to them. The HS section with the greatest number of regulations in 1990 was the Optical/Photographic section, while live Animals/Animal products, Vegetables products, Prepared foodstuff, Base metals/articles, and Machinery and equipment sections also had 5 or more Regulations applying to them. By 2010 all HS product sections were subject to a minimum of 3 Regulations. The average number of Regulations by sections had also increased to 25 from only 3 in 1990. Live animal/animal products had the greatest number of regulations in 2010, while arms and ammunitions had the least. In 2010 and 2021, the top 5 most regulated products were Agri-food products, Chemical products, and Advanced manufacturing products, which all had an above average number of Regulations applying to them in both years.
All 21 HS product sections have experienced a significant increase in the number of Regulations that impose some form of regulatory conditions on them over the 1990 to 2021 period. Chemical products, Prepared foodstuffs, Machinery and equipment and Live animals/animal products stand out here, with 50 or more new regulations affecting these products coming into force over the period.
Table 3: Number of Regulations by product sections
|
HS Section |
Number of regulations |
Export share (%) |
||||
|
1990 |
2010 |
2021 |
∆ 2021-1990 |
Mean 1996-2021 |
||
|
I.LIVE ANIMALS/ANIMAL PRODUCTS |
6 |
89 |
62 |
56 |
2.06% |
|
|
II.VEGETABLE PRODUCTS |
6 |
37 |
44 |
38 |
0.93% |
|
|
III.ANIMALS/VEGETABLES FATS AND OILS |
1 |
36 |
39 |
38 |
0.25% |
|
|
IV.PREPARED FOODSTUFFS |
5 |
66 |
69 |
64 |
4.45% |
|
|
V.MINERAL PRODUCTS |
2 |
24 |
37 |
35 |
11.85% |
|
|
VI.PRODUCTS OF CHEMICAL/ALLIED INDUSTRIES |
4 |
55 |
73 |
69 |
13.13% |
|
|
VII.PLASTIC AND RUBBER ARTICLES |
3 |
19 |
35 |
32 |
2.67% |
|
|
VIII.RAW HIDES/ SKINS/ LEATHER/ FURSKINS PRODUCTS |
0 |
8 |
9 |
9 |
0.26% |
|
|
IX.WOOD/ WOOD PRODUCTS |
0 |
13 |
20 |
20 |
0.23% |
|
|
X.PULP OF WOOD/ FIBROUS CELLULOSIC MATERIAL |
0 |
8 |
13 |
13 |
1.12% |
|
|
XI.TEXTILES |
1 |
18 |
24 |
23 |
3.50% |
|
|
XII.FOOTWEAR, HEADGEAR ETC |
1 |
7 |
12 |
11 |
0.59% |
|
|
XIII.STONE/PLASTER/CEMENT/ASBESTOS ETC PRODUCTS |
3 |
14 |
27 |
24 |
0.89% |
|
|
XIV.PRECIOUS METALS |
0 |
7 |
10 |
10 |
1.59% |
|
|
XV.BASE METALS/ ARTICLES |
5 |
24 |
40 |
35 |
5.65% |
|
|
XVI.MACHINERY AND EQUIPMENT |
5 |
37 |
66 |
61 |
14.74% |
|
|
XVII.VEHICLES/AIRCRAFT/VESSELS ETC |
2 |
21 |
41 |
39 |
11.62% |
|
|
XVIII.OPTICAL, PHOTOGRAPHIC |
7 |
23 |
38 |
31 |
3.23% |
|
|
XIX.ARMS AND AMMUNITION |
0 |
3 |
4 |
4 |
0.02% |
|
|
XX.OTHER MANUFACTURED ARTICLES |
2 |
21 |
34 |
32 |
1.03% |
|
|
XXI. ARTS/ ANTIQUES |
0 |
4 |
5 |
5 |
0.16% |
|
|
Mean number of regulations |
3 |
25 |
33 |
|||
|
Total export share |
79.98% |
|||||
Source: Authors’ computations. Mean number of regulations rounded to the nearest whole number.
Next, we look at the three dimensions of regulatory intensity at the HS product section level. Figure 4 presents our three regulatory intensity measures averaged within section in the years 1990, 2010 and 2021. The horizontal axis in each graph reports the average values of our Index Count, i.e. the number of non-synonym keywords found in the Regulations applying to the products in each section.[27] The averages are computed by taking the simple (unweighted) mean of the indices across all regulated HS6-digits products within the section. This highlights how EU regulatory intensity varies across sections over time, while giving equal weight to each product.[28]
Regulatory intensity across the three dimensions has increased dramatically between 1990 and 2021, with all sections bearing some form of regulatory obligations with regards to all three dimensions by 2021. When we consider 2010 and 2021, we note that agriculture and food products, i.e. live animal products, animal/vegetable fats and oils, prepared foodstuffs, and vegetable products were the most regulated product groups in terms of Technical Requirements. Likewise, agri-food products are the most regulated also for Compliance checks. In terms of Conformity Assessment, three out of four of these product sections (specifically; live animas/live animal products, prepared foodstuffs and vegetable products) were among the top 6 most regulated in 2010 and, by 2021, all four of them are among the top 10 most regulated product sections. In recent years, next to agri-food, regulatory obligations have also risen sharply for some advanced manufacturing products, especially with regards to Conformity Assessment requirements: machinery and equipment and optical/photographic products are the most regulated in 2021, with both product groups ranking fairly high also in terms of Technical Requirements and Compliance.
To sum up the messages from Figure 4, by using information on regulatory obligations only, agri-food and (some) advanced manufacturing industries are the most regulated in the EU Single Market, and this is where UK (and other non-EU) exporters face the highest regulatory trade barriers.
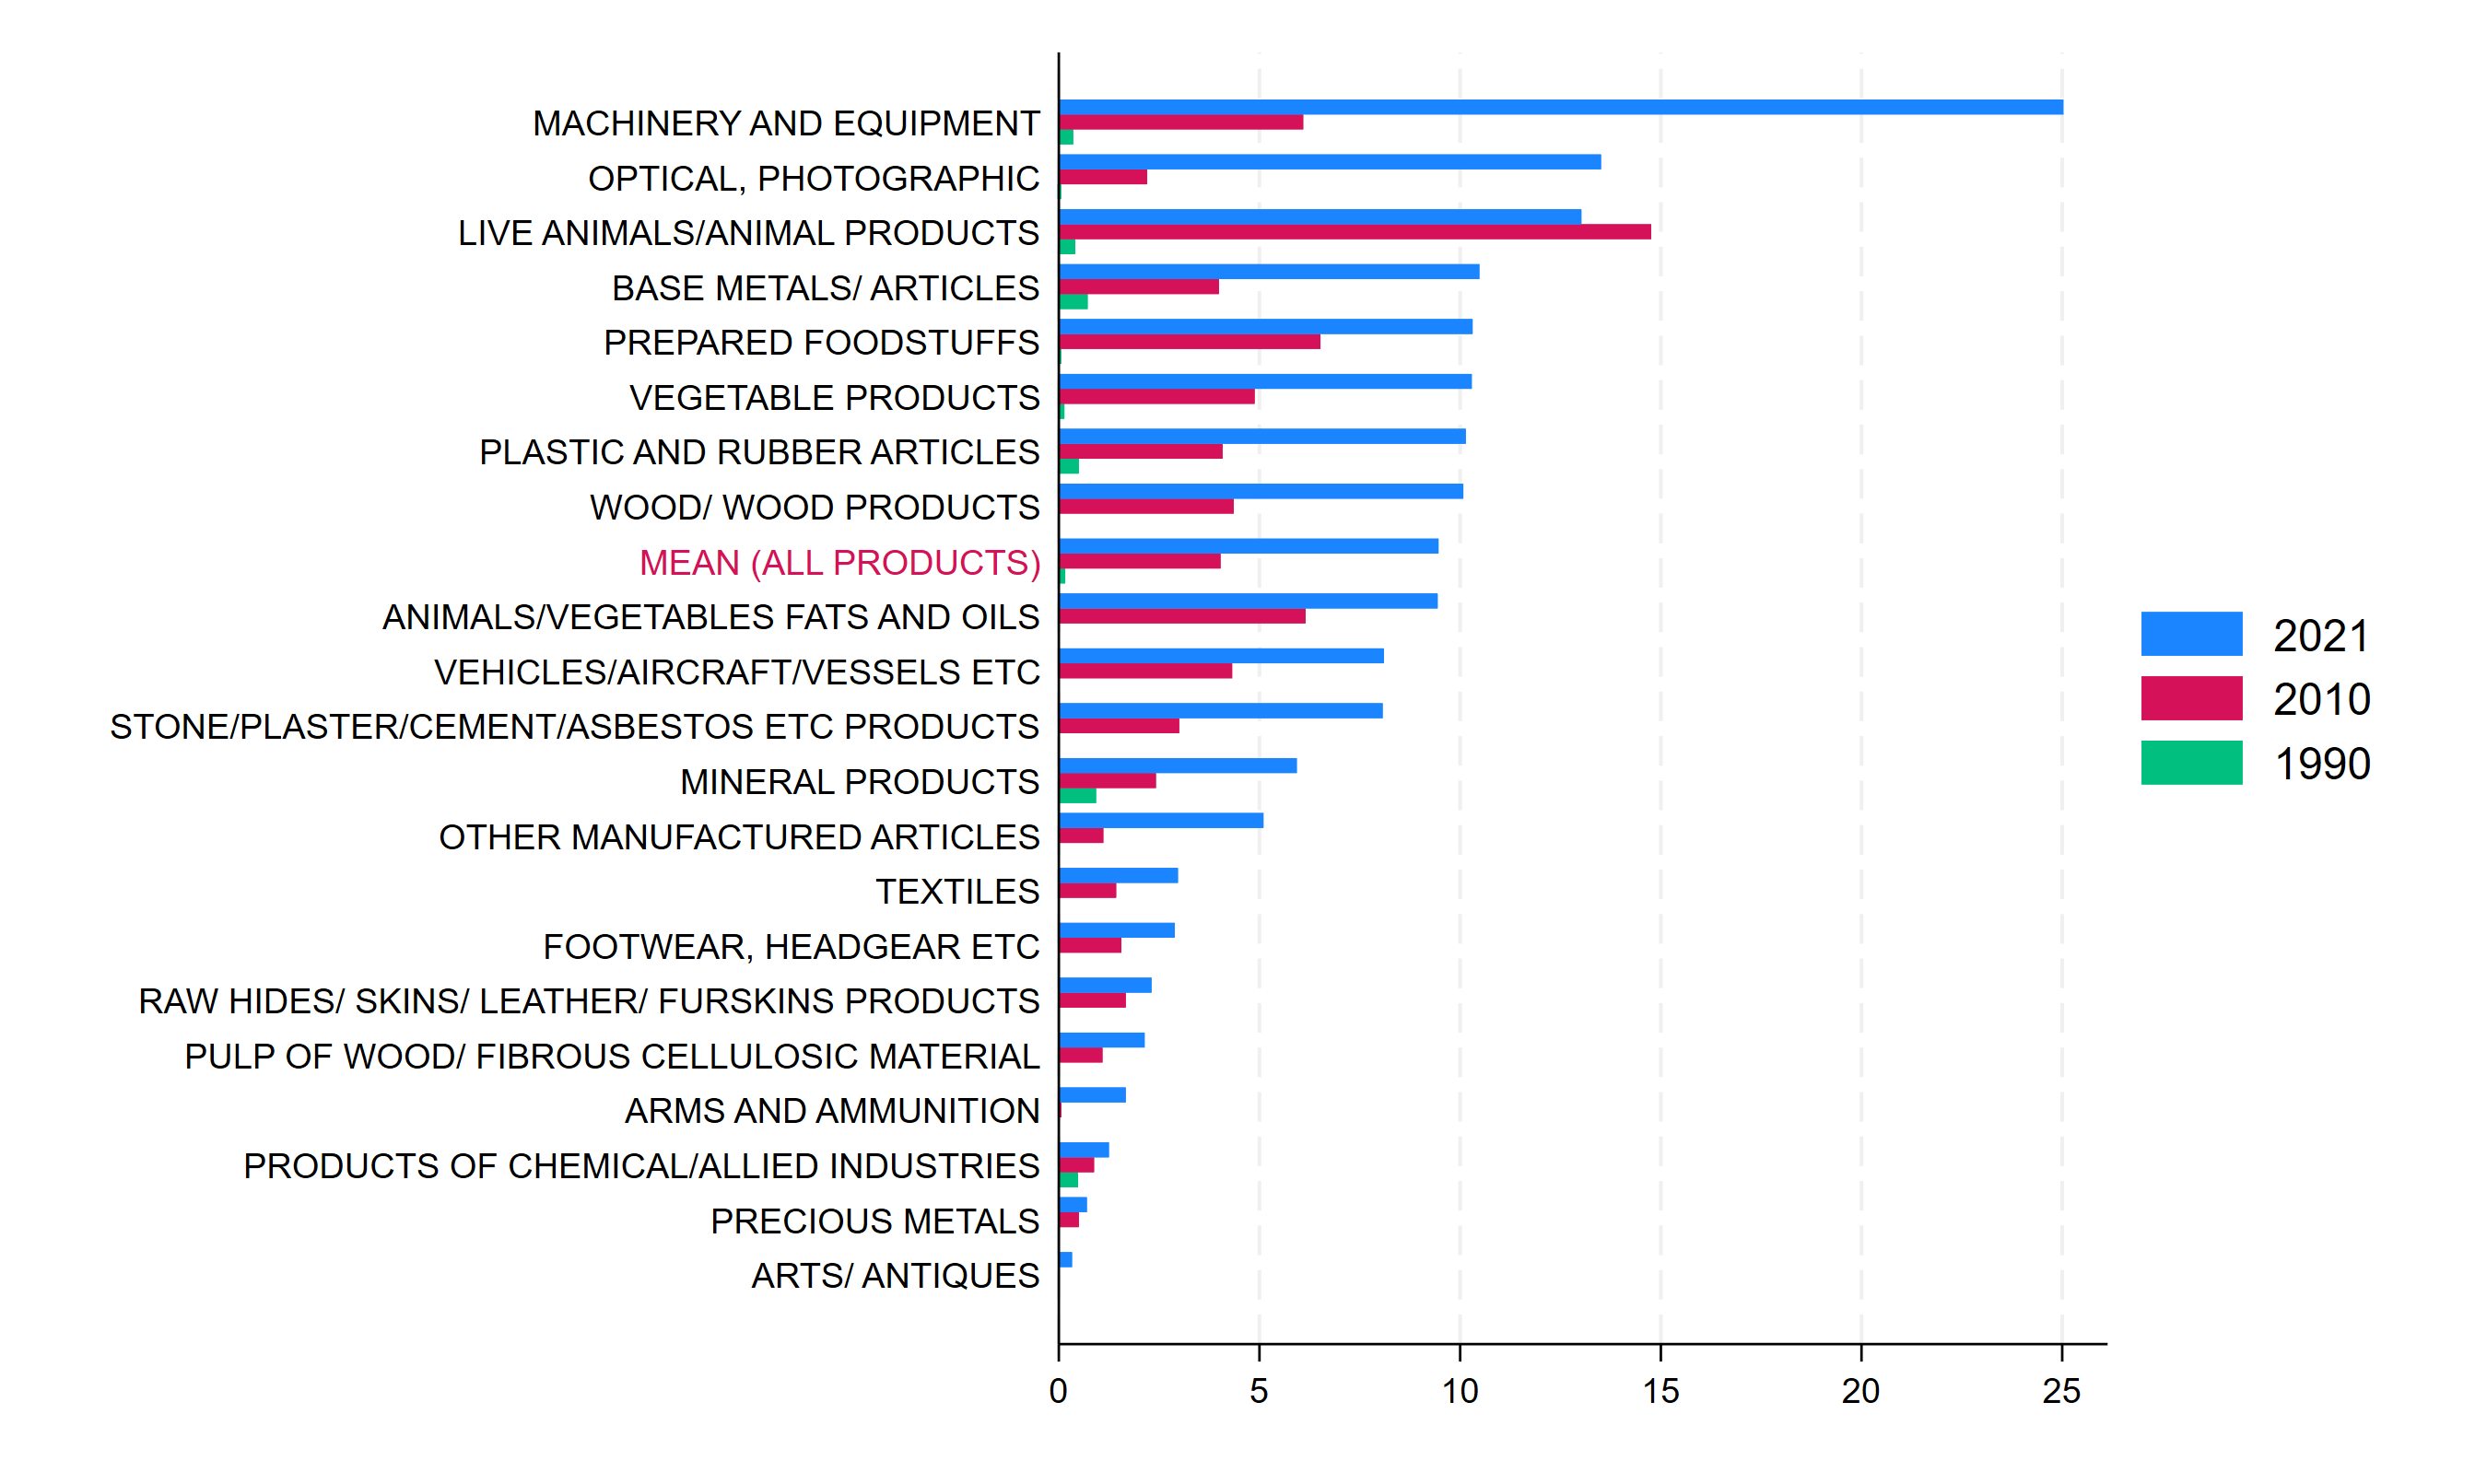
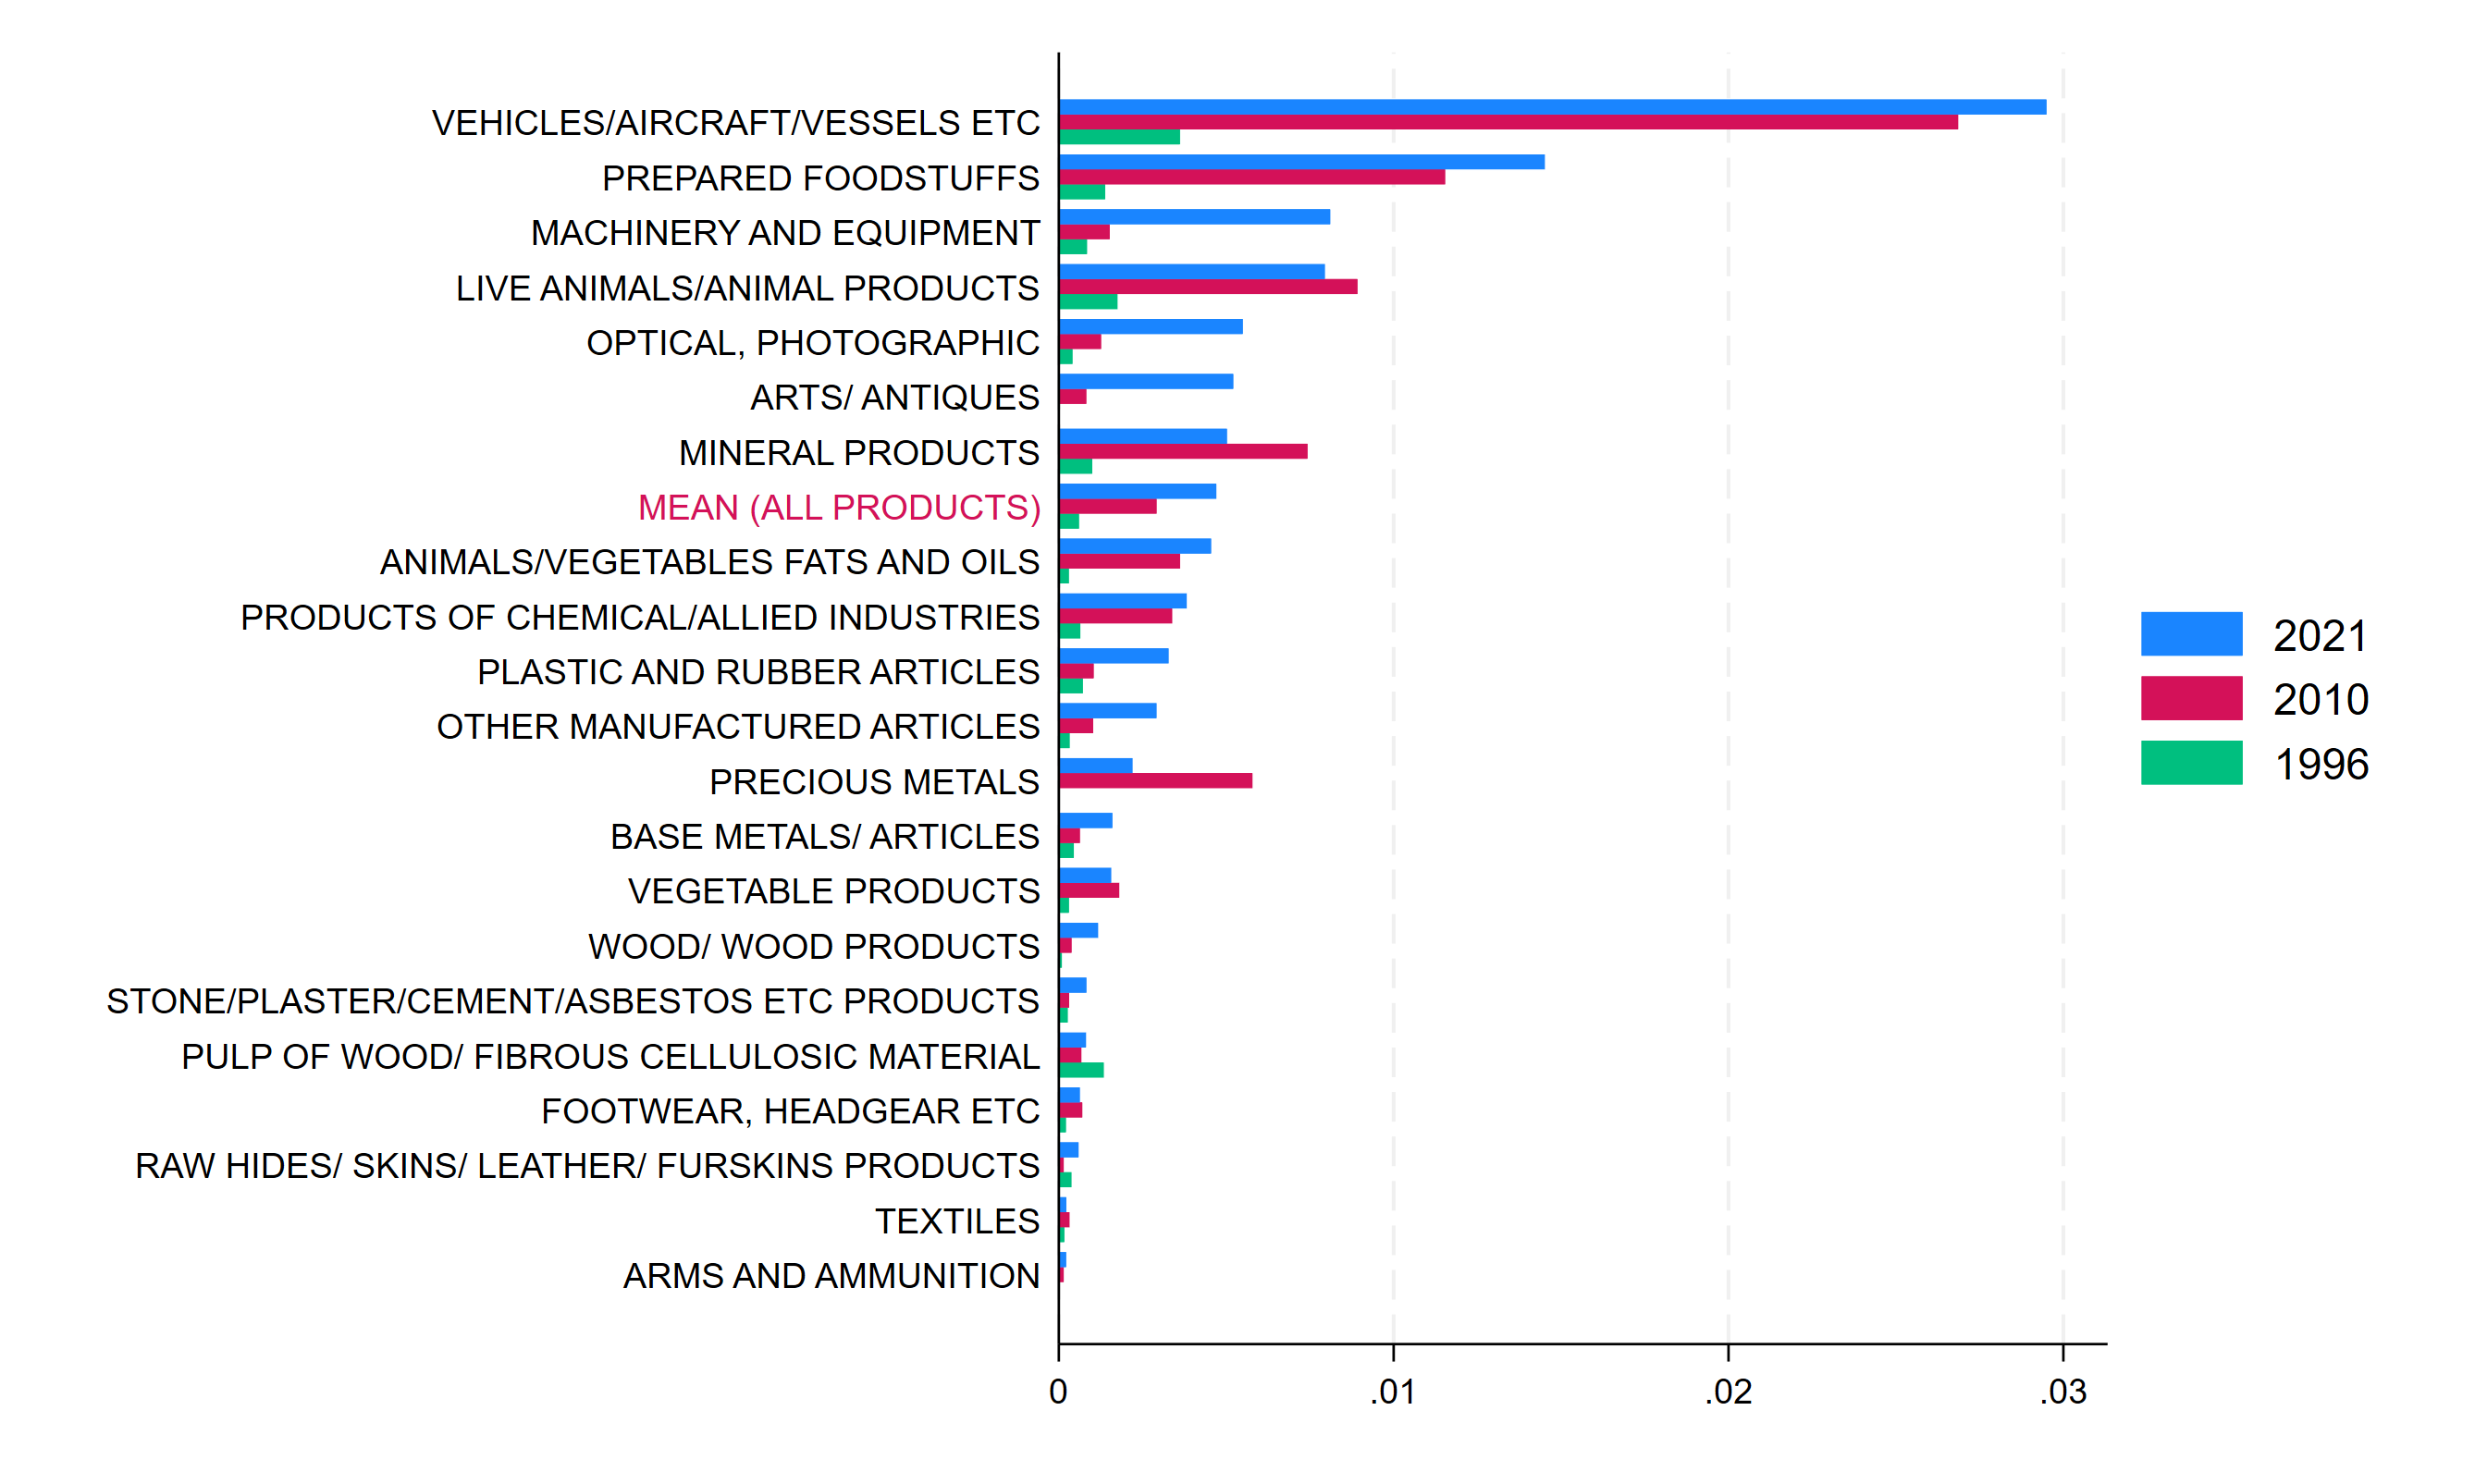
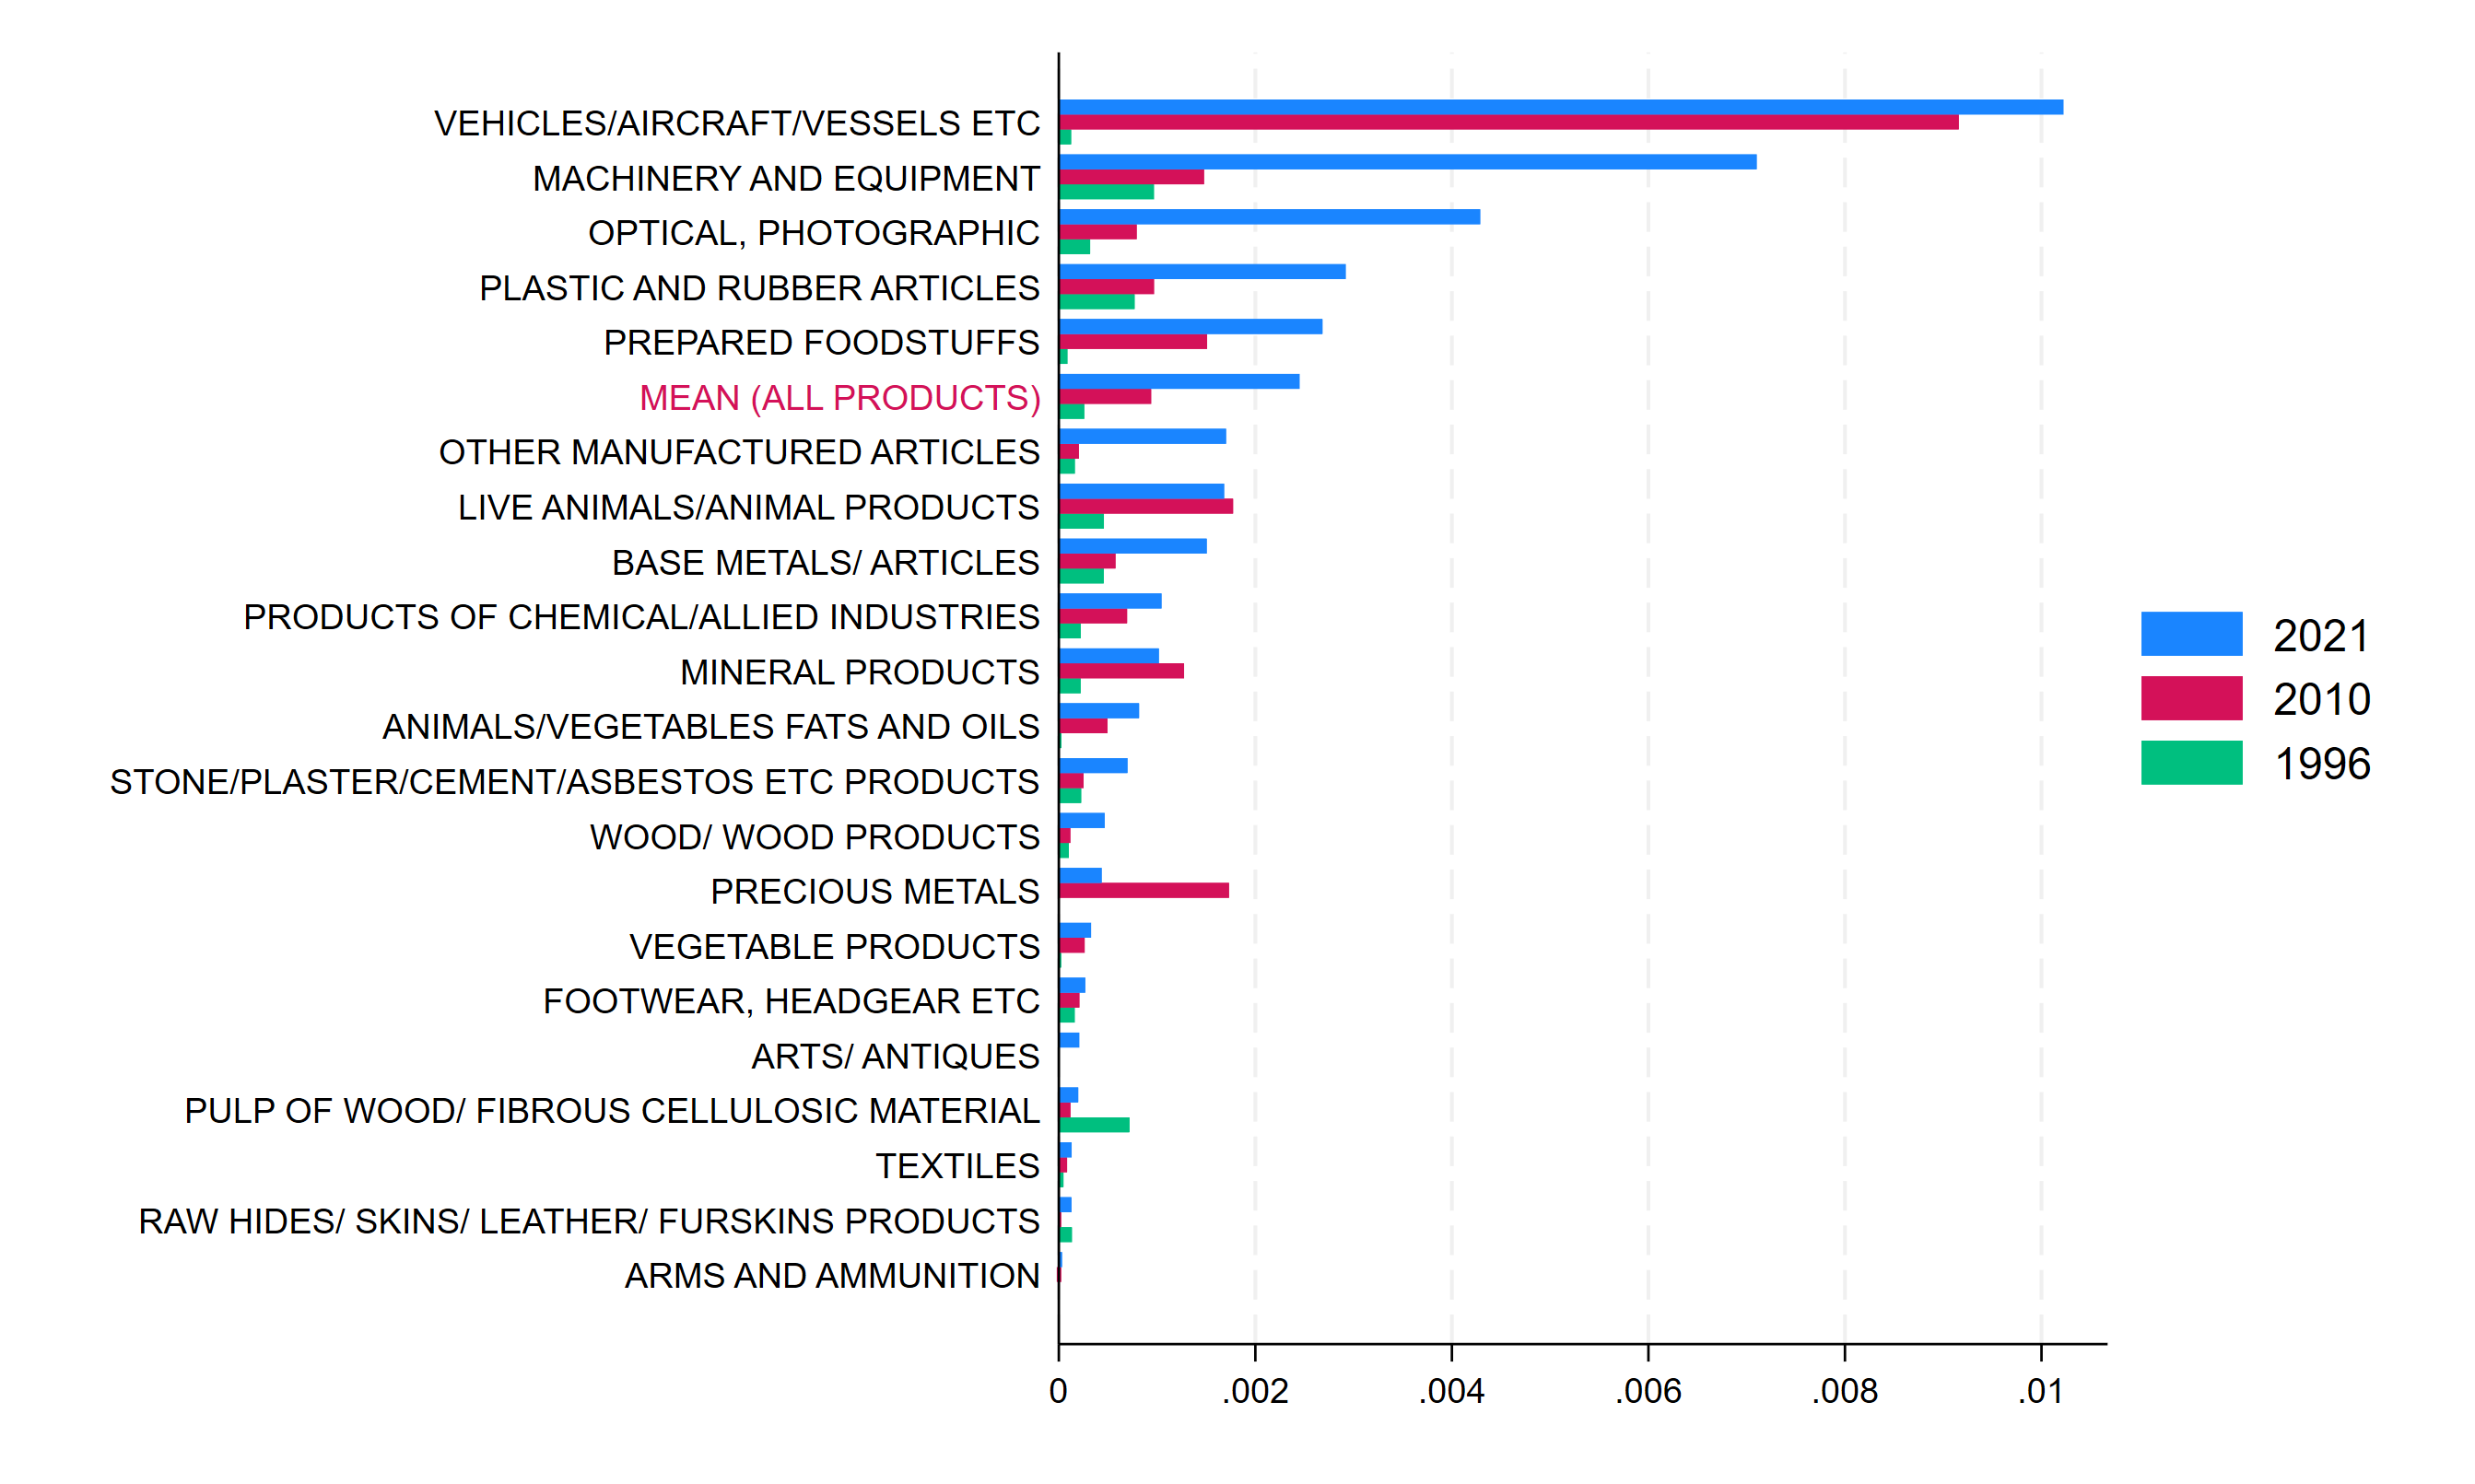
However, to obtain a characterization of these trade barriers (that also considers the amount of trade between the UK and EU), in Figure 5 we show averages of the regulatory indices weighted by each product’s share in UK’s total exports.[29] Hence, the x-axis now reports the average of the weighted Index Count: the low values (compared to Figure 4) are due to most product’s share of total exports being rather small.
The relevance of regulatory obligations and barriers to trade with the EU Single Market is now found to be highest in the Vehicles, Aircraft and Vessels product group, across all three dimensions of Technical Requirements, Conformity Assessment, and Compliance. This is, clearly, due to the high relevance of these products in UK trade. For Technical Requirements, also obligations for Prepared Foodstuffs products become more relevant than in the unweighted indices, while the Animal/Vegetables fats and oil and Vegetable Products groups appear further down in the ranking, due to their small trade shares. Machinery and Equipment, and Optical and Photographic products remain among the most regulated industries in all three areas also in Figure 5 as, other than facing numerous obligations, they also account for a sizeable share of UK’s trade with the EU.
Figure 4: Regulatory Intensity by Product Sections – unweighted means within section
Panel A: Technical Requirements
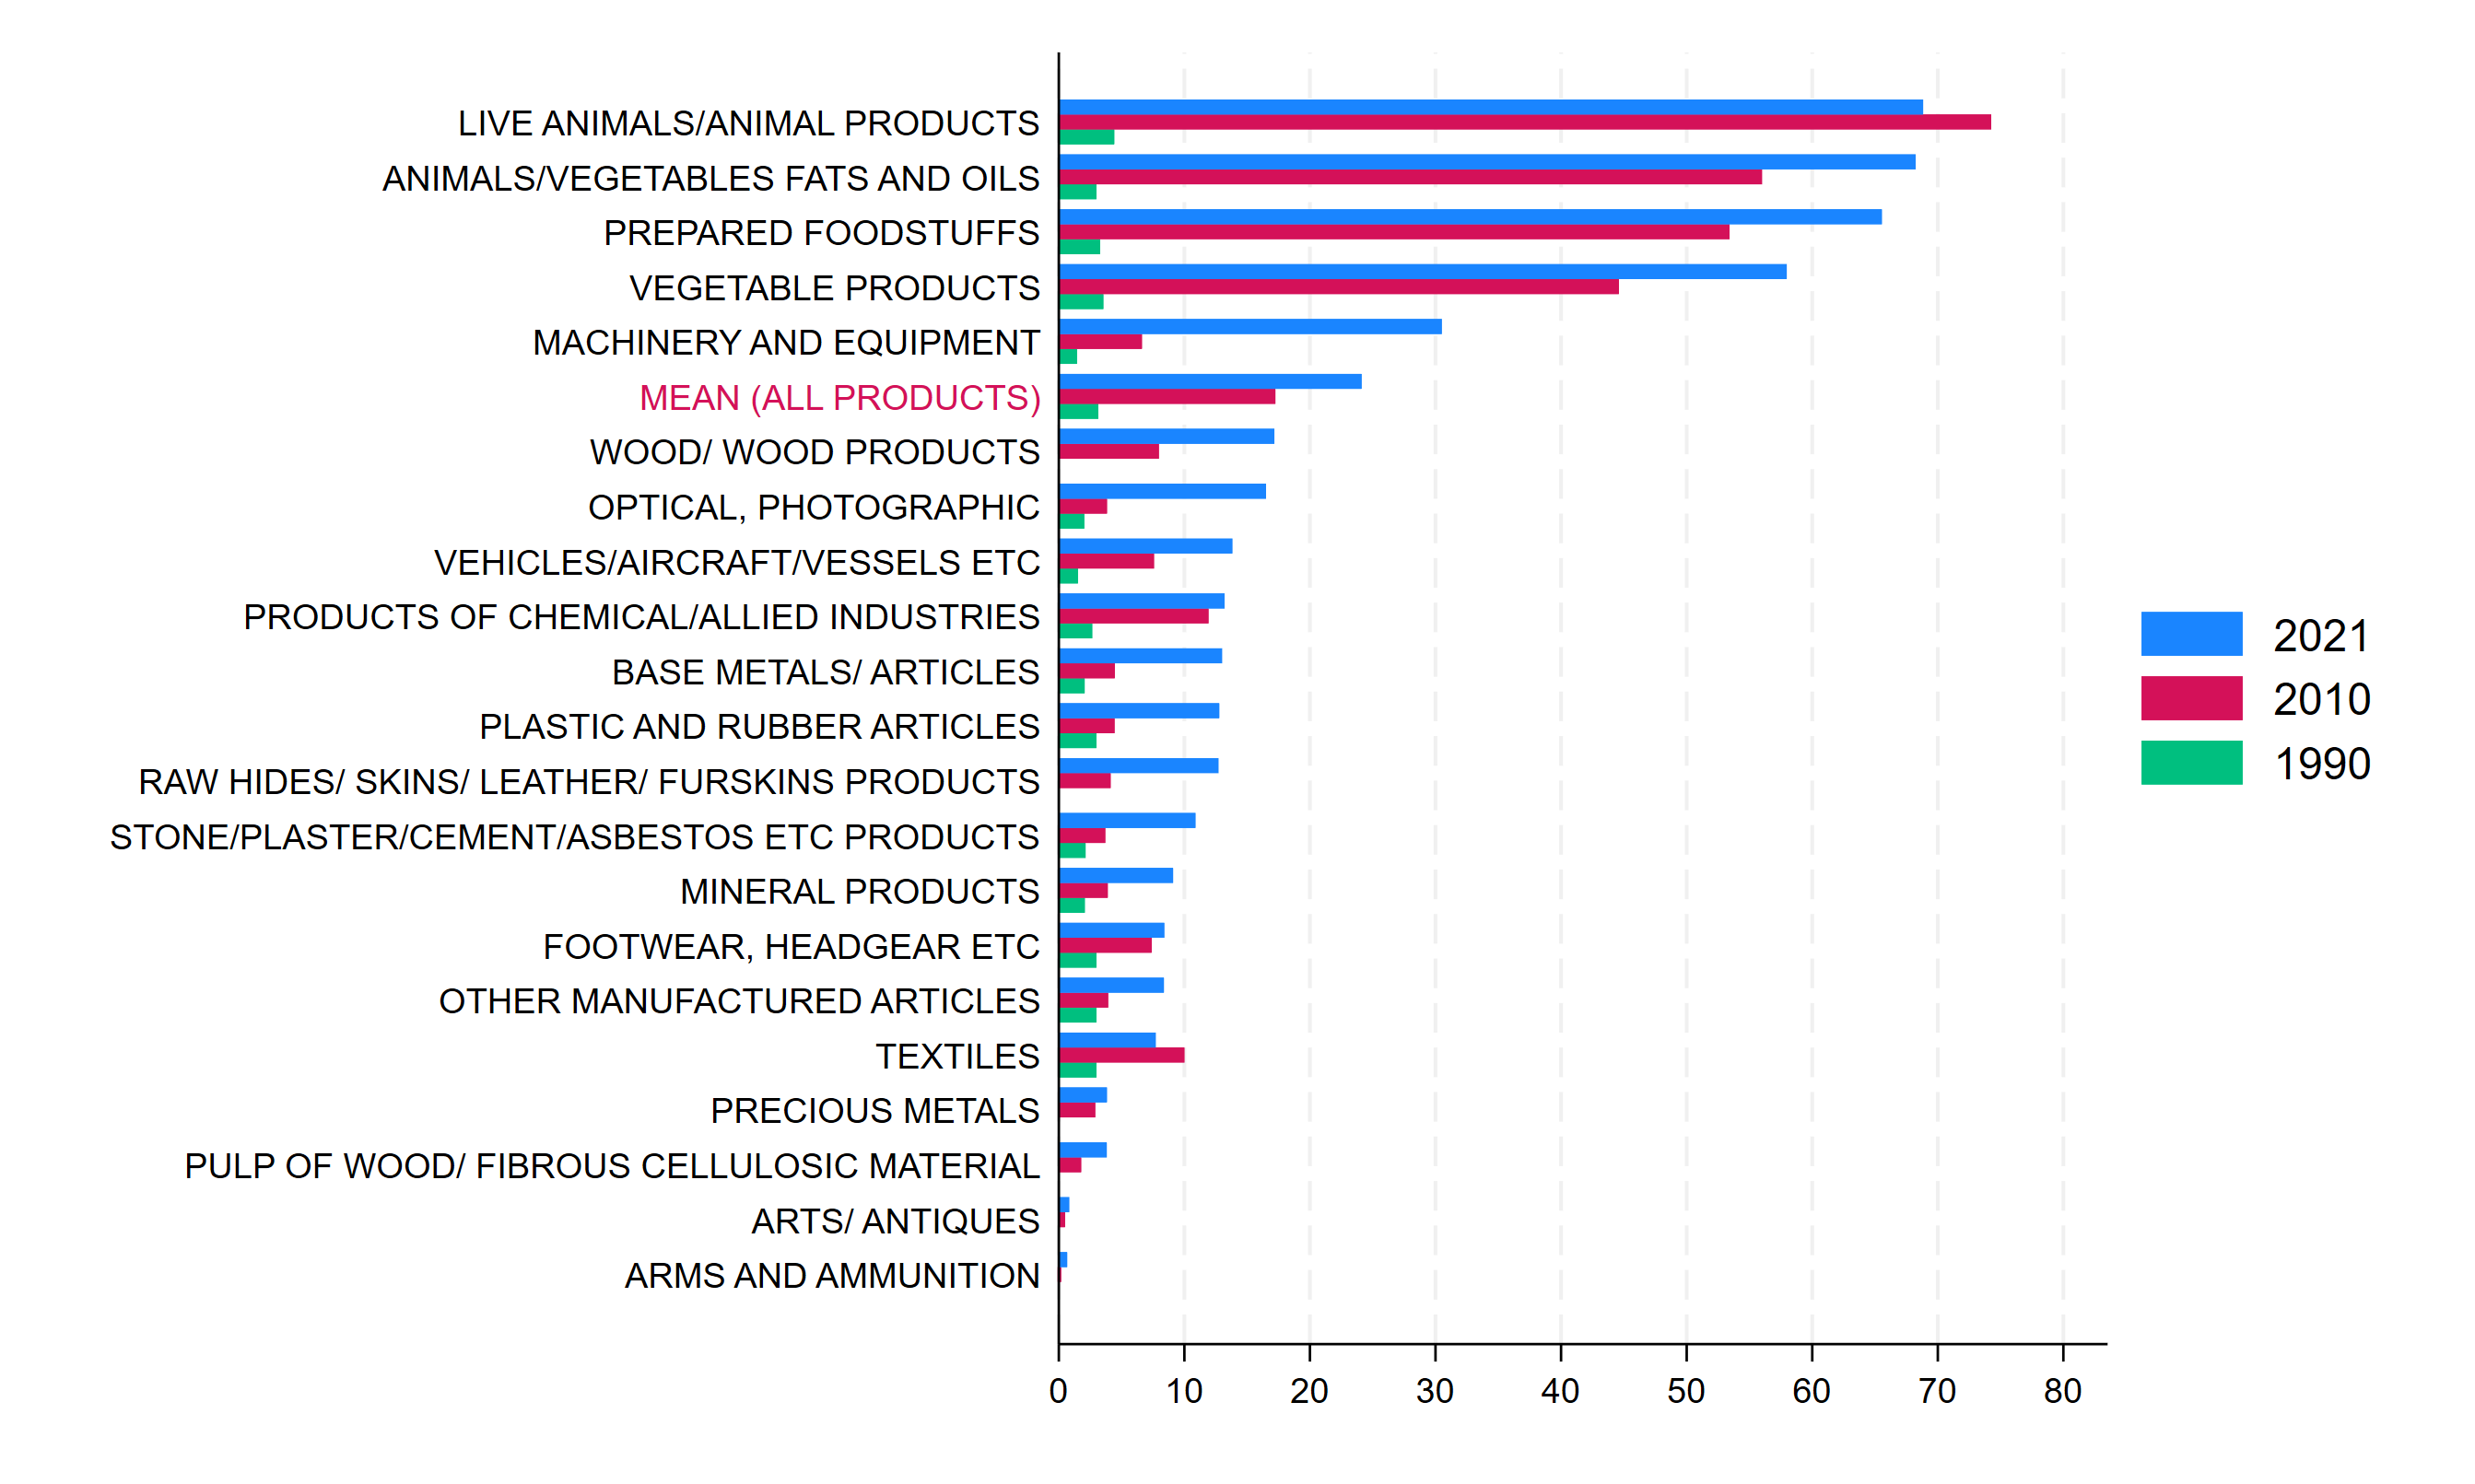
Panel B: Conformity Assessment
Panel C: Compliance
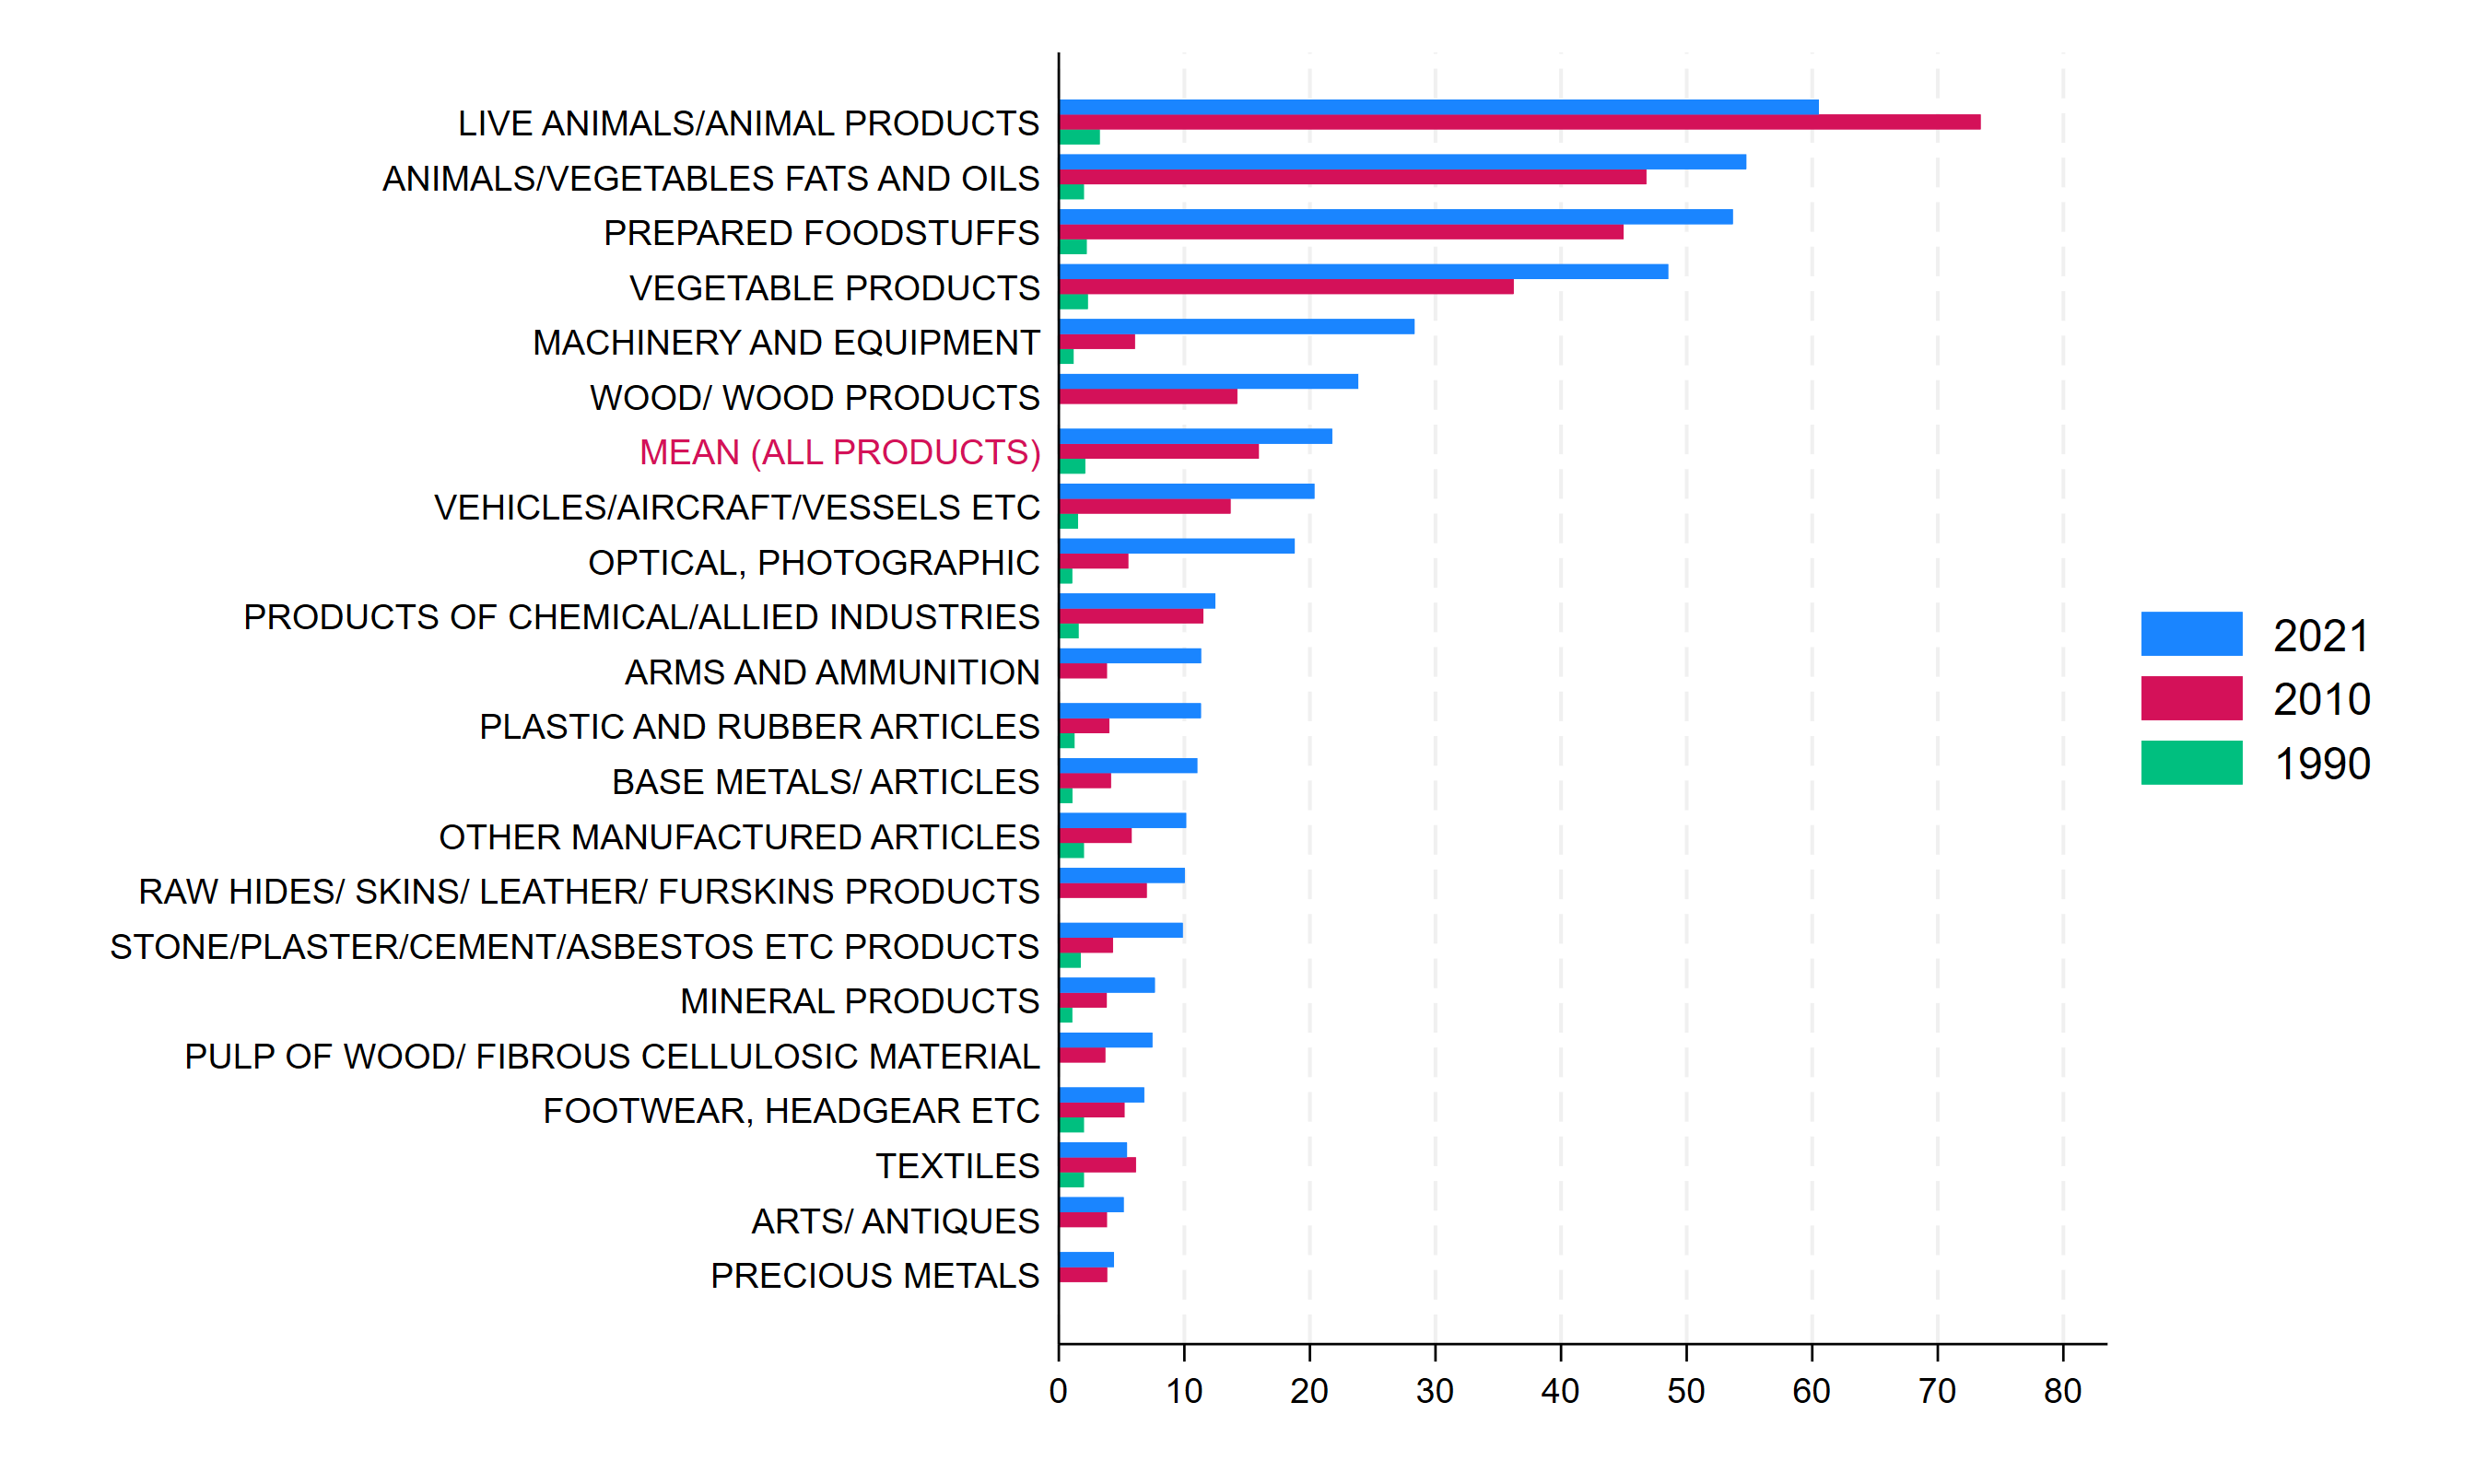
Note: Indices are aggregated from HS6-digits to HS sections by taking the average across
HS6-digits products within sections.
Figure 5: Trade Weighted Regulatory Intensity Indices
Panel A: Technical Requirements
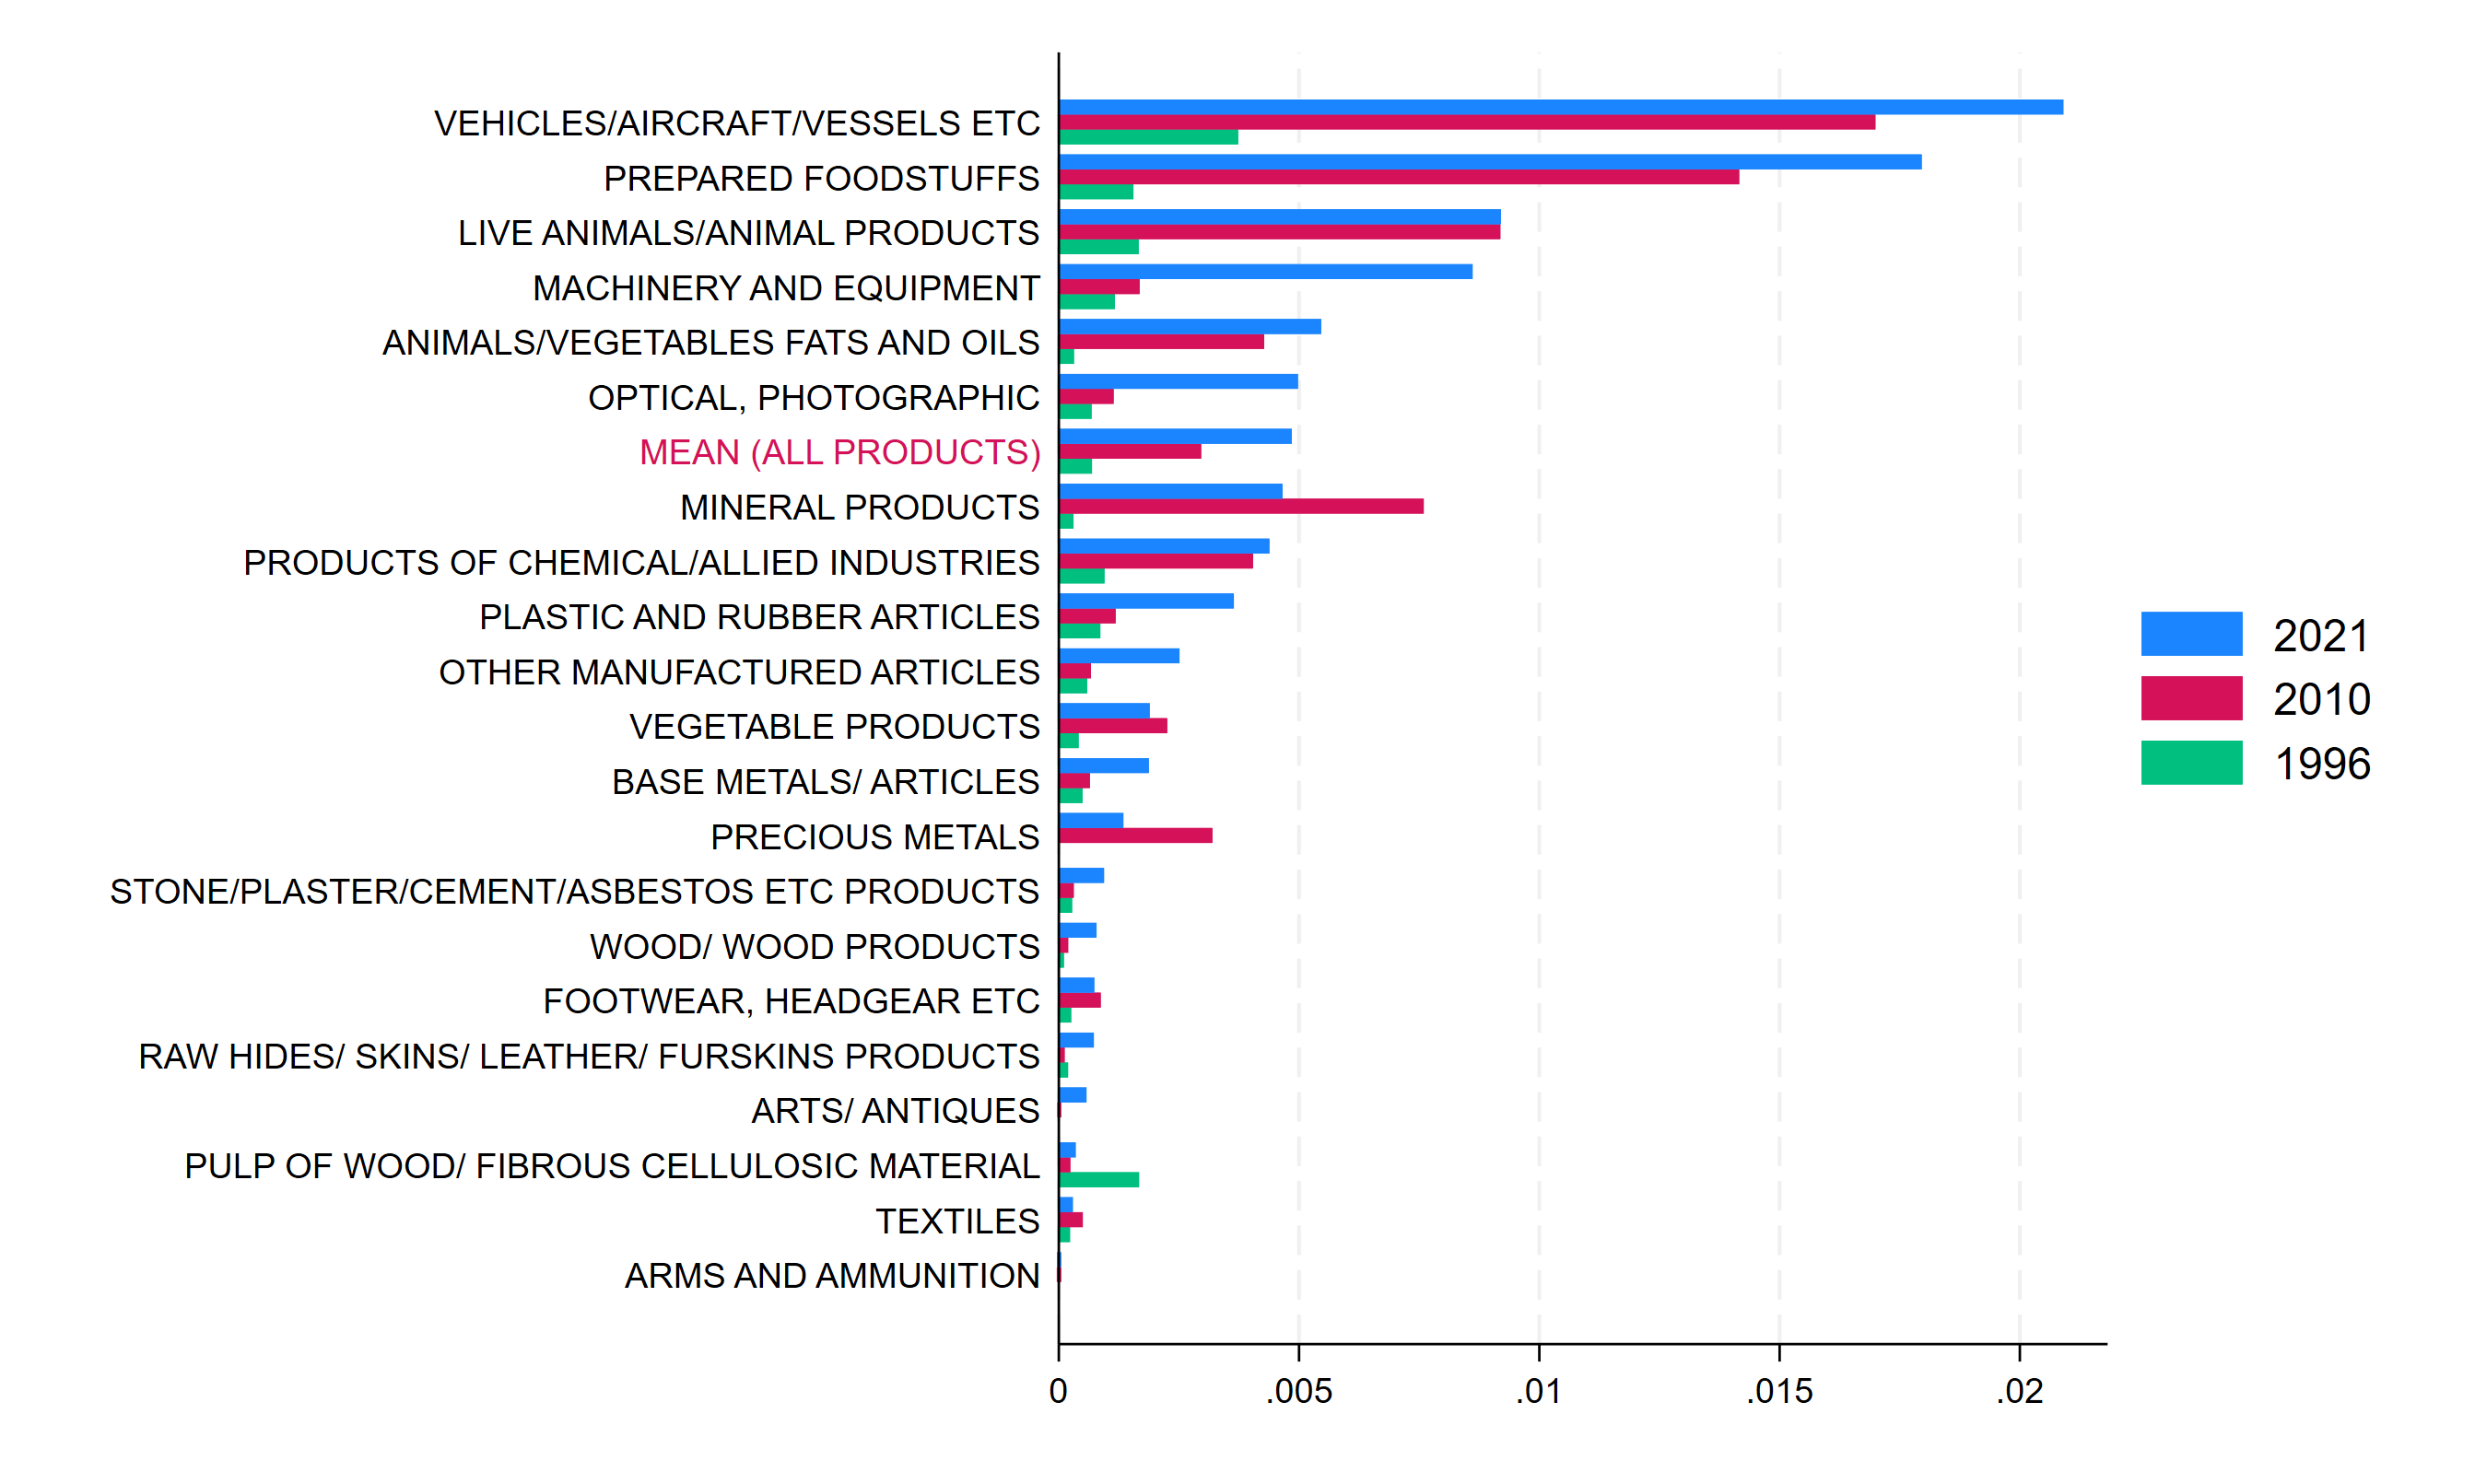
Panel B: Compliance checks
Panel C: Conformity assessment
NB: Indices are aggregated from HS6-digits to HS sections by taking the average across HS6-digit products within sections. Weights are computed as the share of an HS6 products’ exports in UK exports to the EU. Trade data is sourced from UN-COMTRADE through the WITS.
In this briefing paper we introduce a novel set of indices that capture obligations and requirements resulting from compliance with a list of EU Regulations and Directives included in the Northern Ireland Protocol. These key principles apply to products shipped from GB to NI and can be considered fundamental to protect the integrity of the EU Single Market. We use text analysis tools to examine the text of these Regulations and to construct indices capturing obligations in the three areas of Technical Requirements, Conformity Assessment and Compliance checks. We then map the Regulations to the products in the HS classification and obtain indices of regulatory intensity at the detailed 6-digit level.
Regulatory intensity is very heterogeneous, both across Regulations and across products, and has increased rapidly since the 1990s. Currently, the most intensely regulated products are those in Agri-food product groups (Live Animals, Animal and Vegetable oils and fats, Prepared Foodstuffs) and, for Conformity Assessment requirements, in the Machinery and Equipment and Optical and Photographic product sections. By considering the relevance of each product in total UK trade, a number of interesting findings emerge:
Having to demonstrate compliance with EU Regulations and Directives when exporting to the EU Single Market is a consequence of the current post-Brexit trading arrangements, and fulfilling these obligations will result in novel costs that UK firms did not incur (at least in part) pre-Brexit.
[1] More details on the details of the Windsor Framework, and its implications for trade into Northern Ireland, can be found in Zhao and Gasiorek (2023), Introduction to the Windsor Framework, CITP Briefing Paper 5.
[2] We do not currently distinguish between third party conformity assessment and self-reported conformity assessment, though we recognise that these may entail somewhat different obligations on firms. This is part of our on-going research.
[3] Chen, M.X. and Mattoo, A., 2008. Regionalism in standards: good or bad for trade? Canadian Journal of Economics/Revue canadienne d’économique, 41(3), pp.838-863
[4] Maertens, M. and Swinnen, J.F., 2009. Trade, standards, and poverty: Evidence from Senegal. World development, 37(1), pp.161-178
[5] Xiong, B. and Beghin, J., 2014. Disentangling demand‐enhancing and trade‐cost effects of maximum residue regulations. Economic Inquiry, 52(3), pp.1190-1203
[6] Curzi, D., Schuster, M., Maertens, M. and Olper, A., 2020. Standards, trade margins and product quality: firm-level evidence from Peru. Food Policy, 91, p.101834.
[7] Ferro, E., Otsuki, T. and Wilson, J.S., 2015. The effect of product standards on agricultural exports. Food Policy, 50, pp.68-79
[8] Essaji, A., 2008. Technical regulations and specialization in international trade. Journal of International Economics, 76(2), pp.166-176
[9] Murina, M. and Nicita, A., 2017. Trading with conditions: The effect of sanitary and phytosanitary measures on the agricultural exports from low‐income countries. The World Economy, 40(1), pp.168-181
[10] Timini, J. and Conesa, M., 2019. Chinese exports and non-tariff measures. Journal of Economic Integration, 34(2), pp.327-345
[11] Peci, J. and Sanjuán, A.I., 2020. The dual trade impact of non-tariff measures: an empirical assessment of China’s pork imports. European Review of Agricultural Economics, 47(5), pp.1716-1739
[12] Drogué, S. and DeMaria, F., 2012. Pesticide residues and trade, the apple of discord? Food Policy, 37(6), pp.641-649
[13] Fiankor, D.D.D., Curzi, D. and Olper, A., 2021a. Trade, price and quality upgrading effects of agri-food standards. European Review of Agricultural Economics, 48(4), pp.835-877
[14] Kinzius, L., Sandkamp, A. and Yalcin, E., 2019. Trade protection and the role of non-tariff barriers. Review of World Economics, 155, pp.603-643
[15] Fontagné, L., Mimouni, M. and Pasteels, J.M., 2005. Estimating the impact of environmental SPS and TBT on international trade. Integration and Trade Journal, 22(3), 7-37
[16] Crivelli, P. and Gröschl, J., 2016. The impact of sanitary and phytosanitary measures on market entry and trade flows. The World Economy, 39(3), pp.444-473
[17] Fontagné, L. and Orefice, G., 2018. Let’s try next door: Technical Barriers to Trade and multi-destination firms. European Economic Review, 101, pp.643-663
[18] Fiankor, D.D.D., Haase, O.K. and Brümmer, B., 2021b. The heterogeneous effects of standards on agricultural trade flows. Journal of Agricultural Economics, 72(1), pp.25-46
[19] https://ukandeu.ac.uk/the-retained-eu-law-revocation-and-reform-bill/
[20] This was considered necessary to preserve the peace process and comply with the provisions of the Good Friday Agreement.
[21] To make the reading lighter, we will henceforth refer to Regulations and Directives simply as Regulations.
[22] Some Regulations impose requirements on the Member States, or on the EU commission.
[23] Enacted between 1964-2018 and were in force as of 2012. After 2012, Regulations which ceased to apply in the 2012-2018 period were only used up the year they were in force, and any Regulation that amended or repealed the ones in force as of 2012 was added to the list.
[24] Examples of keywords relating to technical requirements are standards, specifications, residues. For conformity assessment: certificate, accreditation, CE marking. For compliance: inspection, authorisation, and customs control.
[25] The drop in the indices observed in the 2016-2017 period is due to the repeal of some Regulations.
[26] The intuition for this is that for the weighted average to fall while the unweighted average stays constant (or rises), the trade share of the highly regulated products must contract while the trade share of the less regulated products expands.
[27] In case more than one Regulation applies to a product, the Index Count has been summed over the Regulations applying to a product.
[28] In 1990, 6 out of the 21 sections had no regulatory obligations imposed on them since no Regulation applied to them (as shown in Table 3) and hence no green bar is shown in Figure 4
[29] To be exact, we take the simple mean within section of the weighted indices at the product level.