
Download Briefing Paper 26
The South East of England and cross-border trade
Sectoral profile, employment patterns and unemployment
Analysing the impact of Brexit on those who are working in Hampshire and Sussex
The impact of Brexit on those who are working in Hampshire and Sussex
The Brexit shock by broad sector
Adjustment of Brexit employment shocks for in- and out-commuting
The impact of Brexit on those who are resident in Hampshire and Sussex
Adjustment for in- and out- commuting: Step-by-step explanation
November and December 2018 are crucial months in the Brexit negotiations. On 13 November 2018, it was announced that the United Kingdom (UK) and the European Union (EU) had agreed the draft text of the Withdrawal Agreement at a technical level. The Agreement was approved by the British Cabinet the following day, but on 15 November several ministerial resignations occurred and, at the time of writing, the political situation remains unclear.
To achieve the UK’s orderly exit from the EU on 29 March 2019, any ‘deal’ must obtain parliamentary approval. The divisions in Government and within political parties suggest that within Parliament the opinions of individual MPs will be central in determining the outcome. In other words, the critical decision on Brexit will be made by Parliament and will therefore ultimately depend on individual MPs and their judgements about the best interests of their constituents. The exact form in which the question will come to Parliament is far from certain,[1] but at one or more of the stages during the approval process, and either explicitly or implicitly, it is inevitable that ‘no deal’ will be one of the options for which British MPs will have to indicate a preference (we advisedly do not say ‘choose’).
In any case, given the complexity of the approval process both in the UK (in particular the ‘meaningful vote’ on the Withdrawal Agreement in the House of Commons) and in the EU (all EU-27 governments, and the European Parliament), the ‘no deal’ Brexit outcome will remain a possibility until this approval process is completed, possibly all the way up to Brexit Day itself, 29 March 2019.[2]
Recognising the centrality of MPs and of ‘no deal’ as a possible outcome, this paper focusses on the economic shocks that a ‘no deal’ Brexit would entail constituency by constituency. We abstract from the immediate disruption of a chaotic ‘no deal’ exit (which on some accounts may be very significant) and thus focus on the effects of an orderly ‘no deal’ over a period of the next few years. We ask how the introduction of new frictions on trade between the UK and the EU27 will affect the demand for labour, and hence the incomes of residents, in the 34 parliamentary constituencies in Sussex and Hampshire.
We take estimates of the effects of a ‘no deal’ Brexit on output and employment in different sectors of the UK economy, and, using the composition of employment in each constituency, estimate how each constituency will be affected.[3] The novel feature of our analysis is that we allow for commuting and so convert the Brexit shock from referring to workers in a constituency to referring to residents in the constituency. For example, some people may live in Southampton but commute to work in London, while some residents of London may commute to work in Brighton. By allowing for such movements, we get a better estimate of the effect of Brexit on local economies and how the Brexit burden will be shared geographically (i.e. after workers ‘take their troubles back home’). While we work at a constituency level and are conscious that the issue of Brexit is essentially political, we are not equating residency and voting – analysing that relationship is for the appropriate specialists in these areas to undertake.
Our economic impact estimates are related to those of Dhingra et al. (2017a, 2017b), but we extend them first by working on constituencies with commuting and second by incorporating more detailed estimates of the effects of Brexit on manufacturing industries from Gasiorek et al. (2018). It is important to remember that any study such as this relies on a number of approximations (see Annex) and so is only a rough guide to actual outcomes. Indeed, our objective is not to make predictions: we aim to identify the size of the economic shocks affecting constituencies in Hampshire and Sussex rather than analyse how they manifest in terms of jobs lost, falling hours or wages or out-migration.
Probably the most important of our assumptions is that we assume that every firm in a given sector in the UK will be equi-proportionally affected by a shock to that sector. But firms all have their own unique features: for example, there are firms whose trade with the EU is either disproportionately large or disproportionately small or firms whose unique features and competitive advantages make them able to withstand negative shocks.
Thus, our results are just broad indicators on which people with local knowledge can base more nuanced analyses. Moreover, we strongly believe that such local refinements should be undertaken as soon as possible, and above all in time for the general public and their MPs to understand more accurately what the ‘no deal’ Brexit outcome might entail for them.
In this paper, we specifically look at the 34 parliamentary constituencies within the counties of Hampshire and Sussex. However, we plan shortly to extend the study to the full set of 632 parliamentary constituencies in Great Britain (data unavailability precludes replicating the result on Northern Irish constituencies). In view of the urgency of the issue, we are today publishing our first stage results for all 632 constituencies – the potential losses of jobs by constituency in the case of a ‘no deal’.[4]
Of all the regions in the UK, South East England is the most heavily engaged in cross-border trade. In 2017, the South East exported £45.3bn worth of goods, of which £22.4bn – 49% – were destined for the EU.[5] By comparison, London was ranked second for exports of goods (£36.2bn). For cross-border services trade, on the other hand, London is by far the dominant region (£117.3bn). Still, in 2016 the South East was ranked second for services exports (£39.2bn), well ahead of the third largest exporter of services, Scotland (£18.5bn).[6]
This large value of cross-border trade, combined with a relatively high exposure to trade with the EU, means that a ‘no deal’ Brexit scenario could be particularly disruptive to the South East’s economy. Moreover, most of the goods destined for, or originating from, the EU pass through the South East via its seaports and airports. Research by Dr Ke Han, at Imperial College London, suggested that a two-minute increase in border check times at the Port of Dover and Eurotunnel in Folkestone could cause traffic queues on the M20/ A20 between Maidstone and Dover to reach up to 29 miles, with delays of nearly five hours at peak times.7 As noted above, our results do not reflect these immediate disruptions, but they reinforce the case we make for undertaking detailed analyses of the possible impact of Brexit on this part of the UK.
Within the South East, there are good reasons for focussing on Hampshire and Sussex: some of the UK’s biggest international seaports are located here – including Portsmouth International Port, the Port of Southampton and Newhaven Port – and Britain’s second busiest airport – Gatwick Airport. Hampshire and Sussex also have good connectivity to London (although this applies to other places across the South East), with potential significant spill-overs from the capital’s labour market to be investigated.
In 2017, Hampshire and Sussex were home to 3.5 million people. Of the total population, 62% were classed as working-age, i.e. aged between 16 and 64, and 21% of retirement age. Hampshire and East Sussex had a higher proportion of working-age population than West Sussex.
Table 1: Age profile of residents in Hampshire and Sussex, 2017
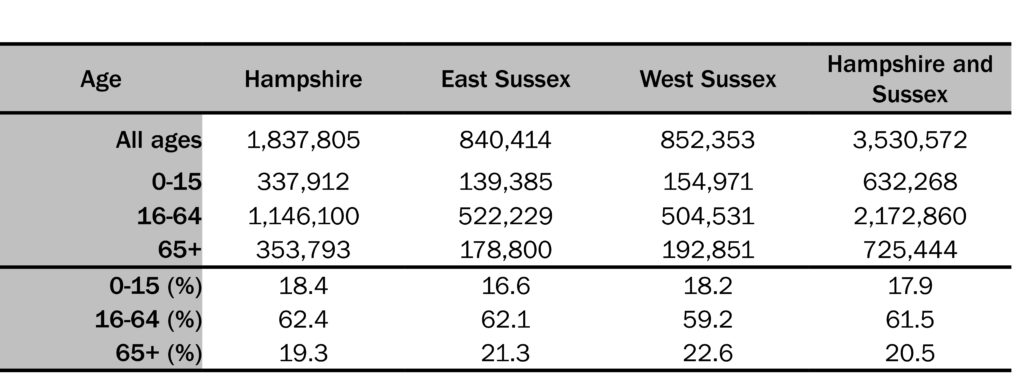
Source: ONS, Parliamentary Constituency Mid-Year Population Estimates in 2017 (Experimental Statistics).
Among the 34 parliamentary constituencies, Basingstoke was the most populous (115,000 residents) and New Forest West the least (see: Figure 1 and the further details in Table A2 in the Appendix). Constituencies with the highest proportion of residents in the working-age group include Brighton Pavilion (75%), Portsmouth South (71%) and Southampton Test (69%) while New Forest West, Bexhill and Battle, and Worthing West (53-56%) are at the opposite end of the scale. The immediate effects of Brexit are likely to be felt via employment, so these differences might be an important source of heterogeneity among constituencies.
Figure 1: Total population in 34 parliamentary constituencies in Hampshire and Sussex, 2017
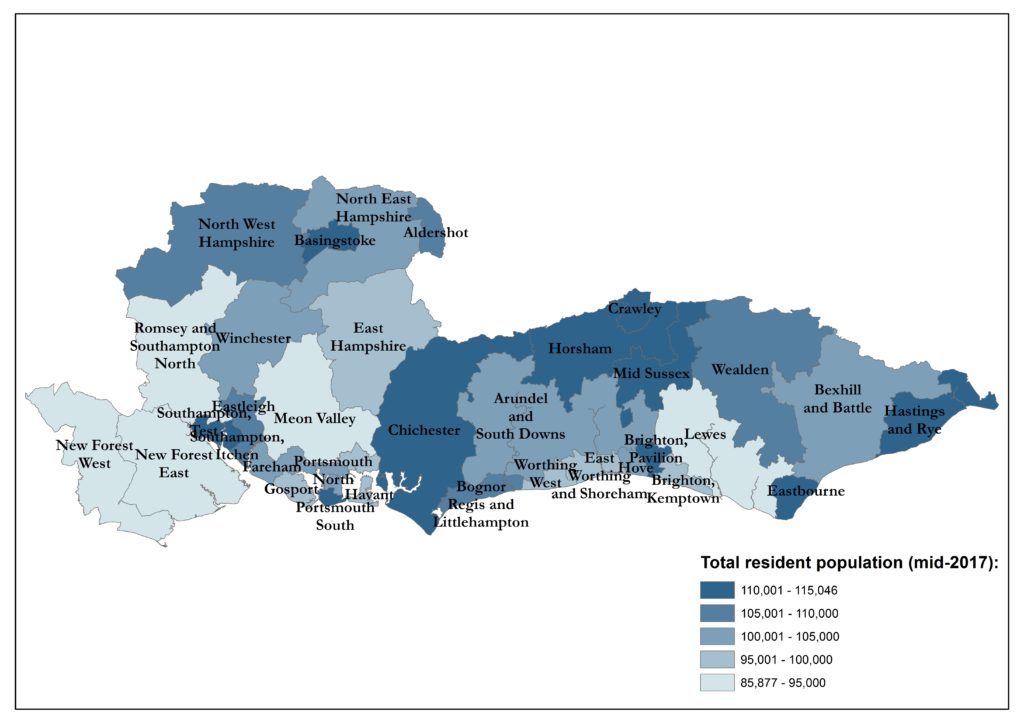
Source: ONS, Parliamentary Constituency Mid-Year Population Estimates in 2017 (Experimental Statistics).
Contains National Statistics data © Crown copyright and database right 2018. Contains OS data © Crown copyright and database right 2018.
In 2016, the base year for our analysis, employment in Hampshire and Sussex stood at 1.5 million, approximately 5% of total employment across Britain.[8] Table 2 summarises county-level employment patterns into seven broad industry groups. Table A3 in the Appendix presents the same data by constituency.
Table 2: Sectoral profile, employment patterns and unemployment in Hampshire and Sussex, 2016
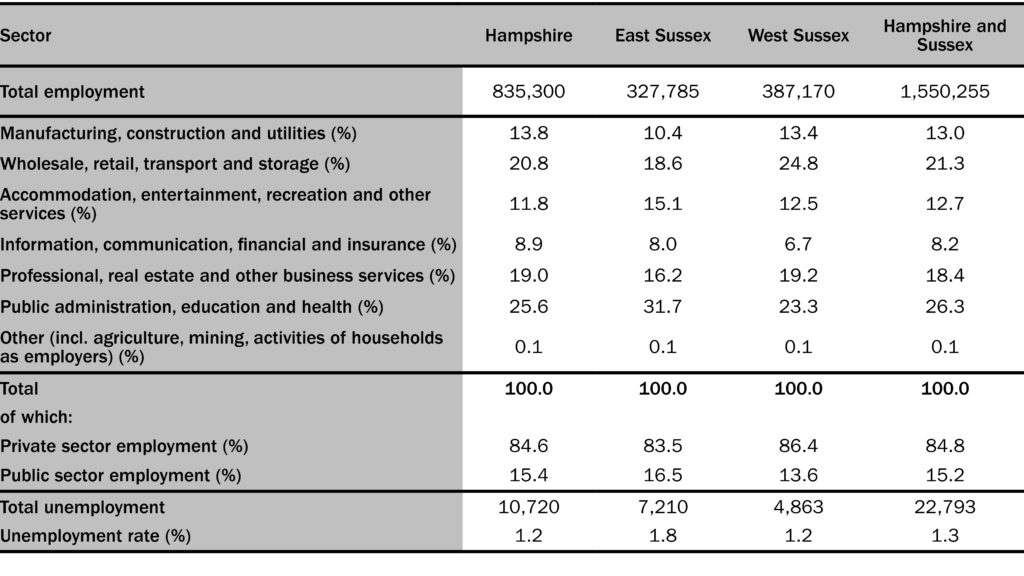
Source: ONS, Business Register and Employment Survey 2016 and ONS, Claimant Count 2016.
Across the three counties, the largest sectoral group was ‘public administration, education and health’,[9] which accounted for more than a quarter of employment (and close to a third of employment in East Sussex). ‘Wholesale, retail, transport and storage’ was the second largest sectoral group.[10] Around 85% of those employed in Hampshire and Sussex work in the private sector, a proportion marginally higher than for Britain as a whole. Table 2 also reports unemployment across Hampshire and Sussex in 2016. It stood at some 23,000 – 1.3% of the resident economically-active population aged 16-64.
As shown in Table A3 in the Appendix, the differences in employment patterns are more marked at constituency level than at county-level. For instance, in Brighton Kemptown close to 50% of employment is in ‘public administration, education and health’ – because it houses two hospitals – whereas in Crawley, only 11% of employment is in that sector. In fact, with 94,000 jobs, Crawley is the constituency with the highest level of employment in the region: over one-third of these are in ‘wholesale, retail, transport and storage’, including 22% in ‘transport and storage’ alone, presumably because of Gatwick Airport. The next largest employment is observed for Brighton Pavilion (69,000) and Basingstoke (66,000).[11] At the other end, constituencies with the smallest employment – fewer than 30,000 – include Gosport, and Bexhill and Battle.
Employment in ‘information, communication, financial and insurance’ activities is often considered valuable because it is said to create more high-skilled and high-paying jobs than other service sector activities.[12] Brighton Pavilion has the highest proportion of employment in these activities (17.4%), followed by Aldershot (17.1%). For the latter, the largest sector – with 27.0% share of employment – is ‘professional, real estate and other business services’. Finally, ‘manufacturing, construction and utilities’ are particularly important for the local economy of East Worthing and Shoreham, where close to a quarter of employment is in the sector.
When the UK leaves the EU, trading arrangements between the UK and the EU will deteriorate. Each of the major options – EEA, a Canada-style Free Trade Agreement or ‘no deal’ – will increase the costs of conducting trade between the UK and the EU and this, in turn, will affect trade and domestic production.[13] Any change in production will have an impact on employment and this is the metric we use to measure the size of the shock in constituencies.
We start with estimates of the sectoral output effects of a ‘no deal’ Brexit (and, in the Appendix, of a ‘soft’ Brexit). Those for the bulk of the economy come from Dhingra et al. (2017a, 2017b), who provide estimates of the medium-term effects of Brexit on UK value added for 31 sectors. In principle, these estimates reflect not just the direct effects of tariffs and non-tariff barriers, but also the ways in which shocks in one sector feed into another via demands for inputs and also via competition for factors of production such as labour and via changes in aggregate income. The high level of aggregation in Dhingra et al. means that they can use only crude indicators of trade frictions, and so we supplement them with the more detailed estimates for changes in manufacturing output from Gasiorek et al. (2018), which defines trade barriers and output effects for 122 manufactured sectors. In a crude attempt to benefit from both the feedback loops on the one hand and the detailed modelling of trade barriers on the other, we estimate our UK output effects for each of the 122 manufactured sectors as the mean of the Dhingra and Gasiorek estimates.
Both sets of estimates carry a ‘health warning’ not to take their specific sectoral results too literally, but when we aggregate them over sectors to reflect the mix of industries in any local economy, we expect the sectoral inaccuracies to average out and render the aggregates somewhat more reliable. More details of the assumed output shocks are given in the Annex and the numbers used are presented in Table A4 of the Appendix.
Given the shocks to output, we estimate the size of potential employment changes across parliamentary constituencies in Hampshire and Sussex. We map this employment vulnerability in Figure 2. Figure 2 is not a prediction about the number of actual job losses that will result from ‘no deal’, but a measure of the negative shock that different constituencies will feel expressed in ‘equivalent jobs units’. People may avoid job losses resulting from lost international trade by accepting lower wages or shorter hours or by moving away – we cannot forecast which – but all such responses are merely different ways of accommodating to the same negative shock. We are trying to measure the shock and are doing so by saying that the Brexit shock is as if it would eliminate a particular number of jobs.
Figure 2: The impact of ‘no deal’ Brexit on parliamentary constituencies in Hampshire and Sussex (potential employment losses, workplace-basis)
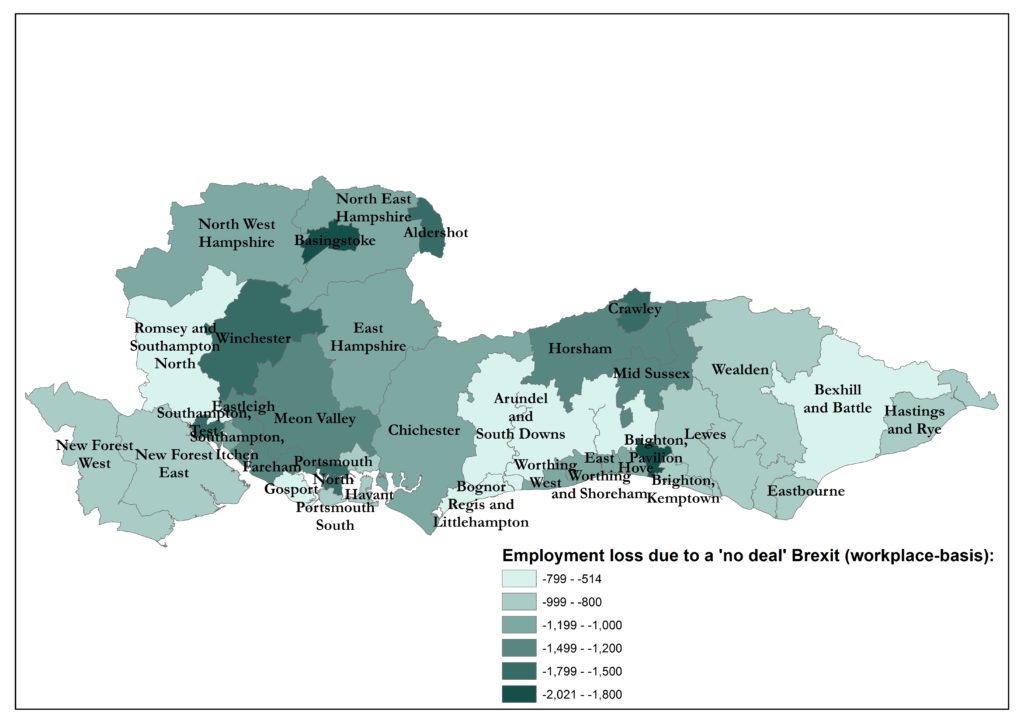
Source: authors’ own calculations using ONS, Census 2011, Gasiorek et al. (2018) and Dhingra et al. (2017a, 2017b).
Digital boundary products and reference maps are supplied under the Open Government Licence. Contains National Statistics data © Crown copyright and database right 2018· Contains OS data © Crown copyright and database right 2018.
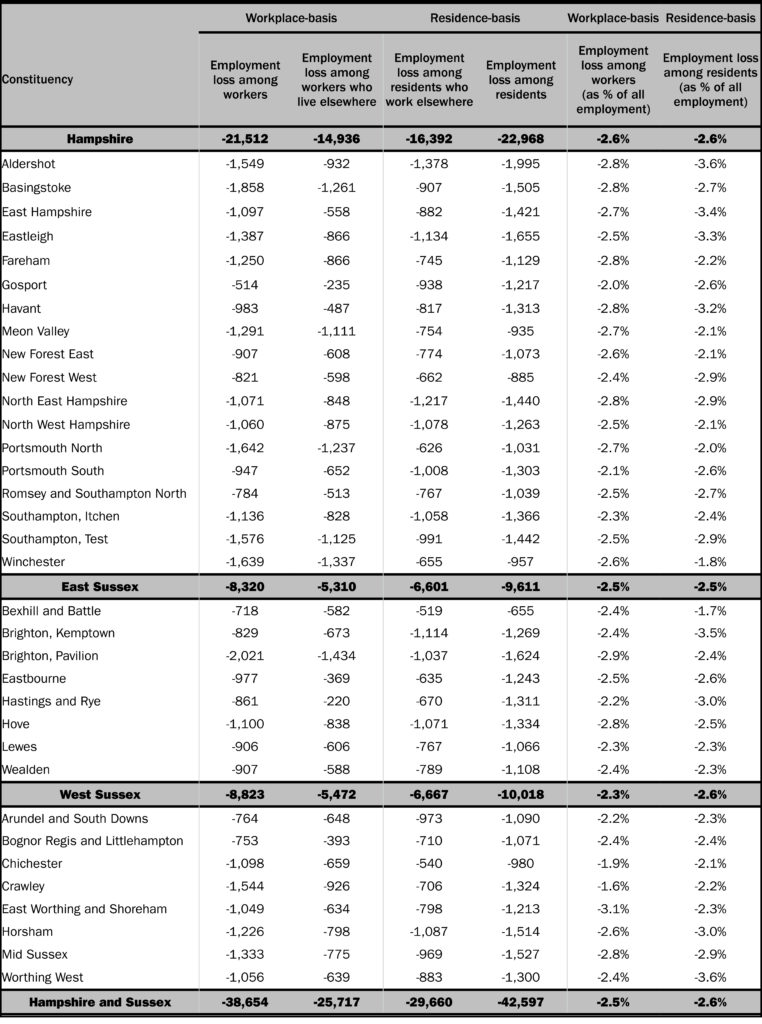
Based on our analyses, the size of a ‘no deal’ Brexit shock to the parliamentary constituencies in Hampshire and Sussex ranges from the equivalent of a loss of 514 jobs in Gosport to a loss of 2,021 jobs in Brighton Pavilion.[14] Other constituencies with large predicted shocks include Basingstoke, Portsmouth North, Winchester, Southampton Test, Aldershot, and Crawley with losses between 1,500 – 1,800 jobs. Those constituencies with relatively small shocks include Bexhill and Battle, Bognor Regis and Littlehampton, Arundel and South Downs, and Romsey and Southampton North. Across the whole of Hampshire and Sussex, the shock is equivalent to some 39,000 jobs lost – about 2.5% of the total employment.
Grouping sectors into the same six broad groups as before, the group with the largest shock is ‘professional, real estate and other business services’ – with a possible loss of some 11,000 jobs across Hampshire and Sussex – followed by ‘public administration, education and health’ (see: Figure 3). At the other end of the scale, the smallest shock appears to be in ‘accommodation, entertainment, recreation and other services’.[15]
Figure 3: The impacts of ‘no deal’ Brexit on employment in Hampshire and Sussex by broad sector (absolute and proportionate changes in employment)
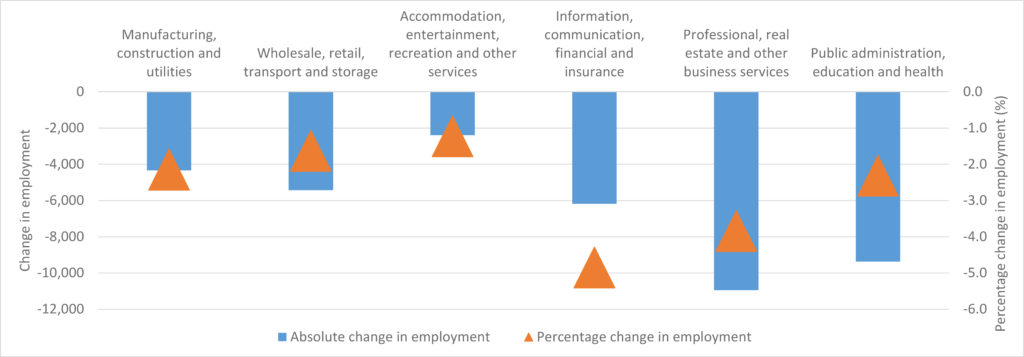
Source: authors’ own analysis using ONS, Census 2011, Gasiorek et al. (2018) and Dhingra et al. (2017a, 2017b).
We do not report the sectoral results for specific constituencies, but they will vary with local employment patterns. Thus, for example, we would expect large shocks to ‘professional, real estate and other business services’ in Crawley (909 jobs), to ‘public administration, education and health’ in Southampton Test (638) and Winchester (531), and to ‘information, communication, financial and insurance’ in Brighton Pavilion (647).
An accurate assessment of the impact of Brexit on different places should account for where people live – not just where they work. This is because people typically spend much of their disposable incomes where they live, impacting on the local economies there. Thus, for example, a Brexit shock, which causes employment in London to shrink, will have wider spatial implications (spill-overs) – as workers who may lose their jobs in London spend less money in their place of residence (i.e. workers ‘taking their troubles back home’).[16]
Section 1 of the Appendix briefly discusses commuting patterns of residents and finds that some 16% of the residents of Hampshire and Sussex work outside those two counties, including around 70,000 people (5.3%) who work in London. Likewise, not all the burden of any jobs lost in, say, Brighton, will be felt in that constituency: they will also affect the areas where in-commuters live.
In modelling these geographic spill-overs, we made use of the ONS Census 2011 origin-destination commuting data, which show the movements of people between their local authority areas of residence and workplace.[17] Unfortunately, however, while we are working with parliamentary constituencies, commuting data are reported for 404 Census merged local authority districts of the UK.[18] This required us to convert the commuting data to a constituency basis. This slightly complicated procedure is explained in the Annex.
These origin-destination commuting flows (now converted to constituency-basis) formed the basis for reallocating earlier estimates of potential Brexit employment losses from areas of employment to areas of residence. To do these reallocations, we looked at the place of residence of workers. For example, commuting data suggested that 29% of Brighton Pavilion workers also lived there, 24% and 19% lived in the neighbouring Hove, and Brighton Kemptown constituencies respectively, and 28% lived further afield. This means that if Brighton Pavilion were to lose some 2,021 jobs (among its workers), then 29% of these losses will affect workers who live in Brighton Pavilion, and remaining 71% of losses will be attributed to other areas (i.e. 24% to Hove, 19% to Brighton Kemptown, etc.).
The same is true for residents of Brighton Pavilion who work elsewhere. For example, we know that such residents comprise 6% of the employment in East Worthing, and 5% of the employment in Lewes. This means that 6% of the shock (equivalent jobs lost) in East Worthing, and 5% of the shock in Lewes will, in fact, impact the residents of Brighton Pavilion. Repeating these calculations for all districts of destination, we can calculate the overall impact on residents of the Brighton Pavilion constituency.[19] Table 3 summarises the calculation, which shows that, despite losing over 2,000 of the jobs in the constituency, the impact on residents of Brighton Pavilion is only around 1,600.
Table 3: ‘No deal’ Brexit employment losses among workers and residents of Brighton Pavilion
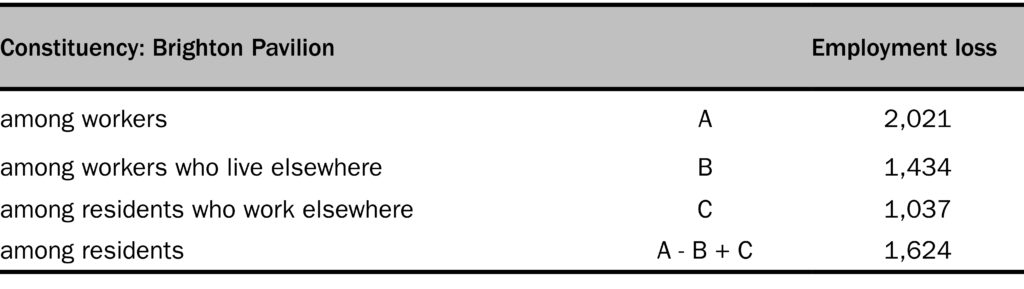
Source: authors’ own calculations
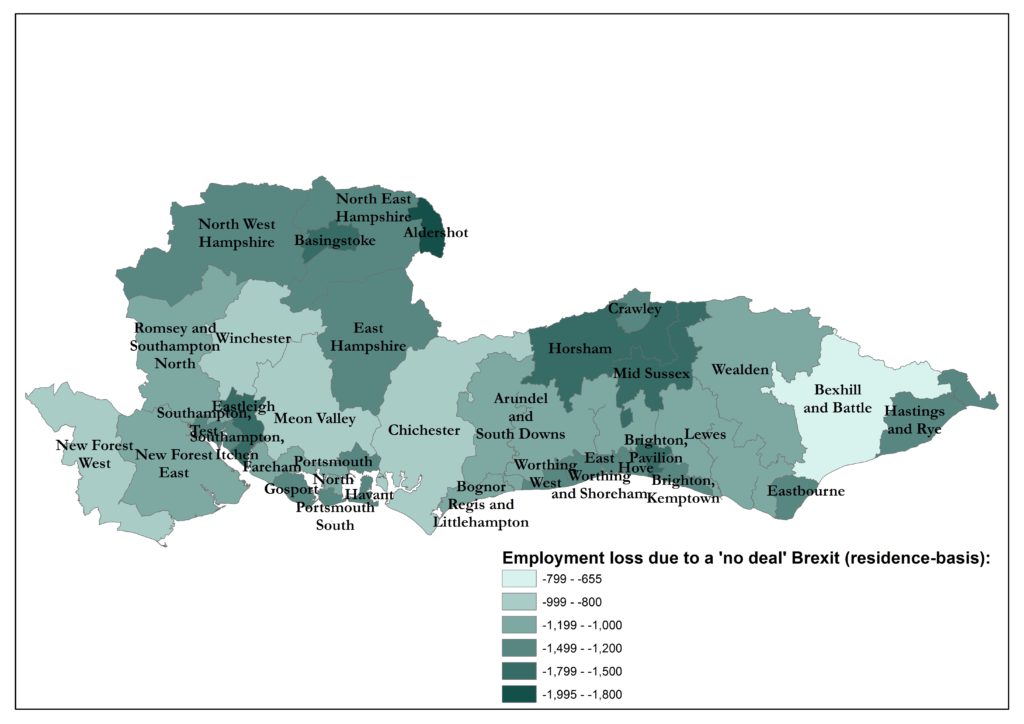
Having made the adjustment for in- and out-commuting from Hampshire and Sussex, we calculated the size of the potential residence-based ‘no deal’ Brexit shock (measured as employment lost among residents) for the 34 parliamentary constituencies. The size of the shock is reported in Table 4 (where we also compare it to the workplace-based Brexit shock) and visualised in Figure 4.
Table 4: The ‘no deal’ Brexit shock on a workplace-basis and a residence-basis
Source: authors’ own calculations using ONS, Census 2011, Gasiorek et al. (2018) and Dhingra et al. (2017a, 2017b).
Contains National Statistics data © Crown copyright and database right 2018· Contains OS data © Crown copyright and database right 2018.
Figure 4: The impact of ‘no deal’ Brexit on parliamentary constituencies in Hampshire and Sussex (potential employment losses, residence-basis)
Source: authors’ own calculations using ONS, Census 2011, Gasiorek et al. (2018) and Dhingra et al. (2017a, 2017b).
Among all the constituencies of Hampshire and Sussex, Aldershot is expected to be the most negatively affected, with some 2,000 jobs lost – around 3.6% of total employment. Eastleigh and Brighton Pavilion are expected to be second and third most negatively affected constituencies respectively with losses in excess of 1,600 jobs.
The workplace-based and residence-based Brexit shocks are far from identical. Portsmouth North’s losses, for example, are among the largest on the workplace-basis (1,642) but among the smallest on the residence-basis (1,031). Other constituencies with a similar pattern include Winchester, Meon Valley, Brighton Pavilion and Basingstoke.
For most constituencies, however, the story is just the opposite: the majority of parliamentary constituencies in Hampshire and Sussex lose more jobs on the residence-basis than the workplace-basis. The three constituencies with the largest differences of this sort are Gosport, Hastings and Rye, and Aldershot.
The size of the Brexit shocks – both workplace-based and residence-based ones – as a percentage of total employment is also provided.[20] For Hampshire and Sussex as a whole the shock to workers is equivalent to about 2.5% of total employment and the shock to residents is equivalent to about 2.6%. The worst affected constituencies (where the shock among employed residents is expressed as the share of total employment) include Aldershot, Brighton Kemptown and Worthing West, with losses equivalent to around 3.5-3.6%.
The differences in the size of the Brexit shock on the workplace-basis and the residence-basis mainly arise from the various roles that different places play – whether they are net importers or net exporters of workers. For example, cities typically provide jobs to the wider surrounding areas, the workers in which can thus enjoy the benefits of agglomeration such as access to the deep pools of workers, infrastructure and knowledge spill-overs that dense urban environments offer. But, as a consequence, shocks that hit a city will spill over into the surrounding towns and villages.[21]
The example of Portsmouth North and Gosport shows that, even within cities, some parts tend to be more residential in nature, while others accommodate more businesses. Portsmouth North – even if less centrally located than neighbouring Portsmouth South – is an important area of employment for both its residents and commuters from elsewhere, with Portsmouth International Port (a major employer) being located there. Gosport, on the other hand, is more residential: there are more residents in Gosport who commute to work elsewhere than there are residents of other places who commute to work in Gosport.
To conclude, measuring the impact of Brexit just by reference to where businesses and jobs are located will miss the effects on residential areas, and will thus provide a less accurate measure of where the impact will be felt by individuals. This, in turn, emphasises the importance of accounting for where people live to better understand the localised impacts of Brexit (and other economic shocks).
As we approach the crucial stage of the Brexit negotiations, the divisions in Government and within political parties suggest that Parliament, and the opinions of individual MPs, will be central in determining the outcome. MPs may shortly have to vote on whether to accept a deal that the Government presents to them. They should approach this vote with a clear understanding of the implications of their decisions for the people that they represent.
In this Briefing Paper, we have outlined the implications of a ‘no deal’ Brexit on 34 parliamentary constituencies in Hampshire and Sussex, quantifying the shock in terms of possible employment loss. Out of all the UK regions, South East England is the most heavily engaged in cross-border trade: ranked first for total exports of goods and second (after London) for total exports of services. With a significant part of this trade being with the EU, a ‘no deal’ Brexit would be damaging for the regional economy.
Our analysis reveals that in the event of a ‘no deal’ Brexit, Hampshire and Sussex will experience a negative economic shock equivalent to an employment loss of around 39,000 jobs among those working in the area. But accounting for in- and out-commuting, the shock is equivalent to a loss of 43,000 jobs.
The difference arises because Brexit involves shocks to the employment of people who live in Hampshire and Sussex but work elsewhere, and who will be affected by what happens to jobs in other parts of the country. This is something that workplace-based measures of Brexit do not capture. For example, 5.3% of Hampshire and Sussex residents commute to work in London, and those residents will be affected by what happens to jobs in London after Brexit.
Out of all the 34 parliamentary constituencies of Hampshire and Sussex, Aldershot is likely to suffer the largest shock from Brexit, equivalent to 2,000 jobs lost among its residents – a loss of 3.6% of its total employment. Eastleigh and Brighton Pavilion also receive large shocks in absolute levels – while Brighton Kemptown and Worthing West have larger proportionate shocks.
We finish with a caveat and a plea. A statistical exercise such as this can only approximate the local effects of Brexit. It will certainly miss all local nuances regarding firms’ particular strengths and vulnerabilities and the ways in which in- and out-commuters earn their living. Thus, while we believe that the results of this Briefing Paper are important inputs into local debates, they are just the starting point. They should be supplemented by residents’, MPs’ and local media’s examinations of their own prospects under different ‘Brexit’ scenarios, using local information.
Brexit is still before us. Thus any attempt to calculate its likely effects is based on a number of simplifying assumptions and approximations, as follows:
Sectoral impacts: we assume that all firms in a given sector will be equi-proportionally affected by Brexit (for example, all firms in the construction sector will experience an output decline equal to -2.6% in the event of a ‘no deal’ Brexit). Naturally, this is not strictly speaking correct: some firms will be in a better position to withstand the negative effects of an economic shock than others. In the context of Brexit, there is also an issue of the degree of exposure of different firms to trade with European partners. However, for this detailed modelling of local Brexit effects we would need to base our analysis on close collaboration with individual businesses and local experts in each constituency.
Proportionality: in our modelling, we assume that a 5% increase (decrease) in output delivers a 5% increase (decrease) in employment, i.e. constant productivity assumption. Of course, this may play out differently in reality: for example, some businesses may opt to cut the number of hours per worker rather than shedding workers, while others may seek technological innovations to increase productivity with a view to maintaining their competitiveness, possibly leading to disproportionately larger employment than output losses. In the absence of detailed information, however, we have to assume that output changes are proportional to employment changes.
Time: there is no explicit time dimension to our Brexit shocks, but given the feedback loops analysed in Dhingra et al., three to eight years seems a reasonable assumption. Given that adjustment takes time, but that trade shocks will arrive quickly, it is likely that shorter-run negative employment effects will be larger than the ones we have assumed here. That is, our estimates are probably rather conservative for the medium-term.
Commuting: Our correction for commuting relies on data from the Census in 2011, and therefore, implicitly assumes that commuting patterns have not changed since. We also assume that, within constituencies, populations are evenly spread across space and that commuters are distributed across sectors in the same proportions as the local population of the district they work in.
None of these assumptions is strictly accurate, but they are not likely to make the analysis misleading. These assumptions abstract from any local specificities, but there is no alternative in a general analysis like this.
We are certainly not claiming that these assumptions will be perfectly vindicated by the actual outcome of Brexit. Equally, however, they are not unreasonable, and it is incumbent on those who prefer different assumptions to be explicit about them, so that the results can be tested.
We must stress that we are not asserting that the number of jobs lost will be equal to our estimates. People may avoid job losses resulting from lost international trade by accepting lower wages or shorter hours or by moving away, all of which will look different in terms of jobs, but these responses are merely different ways of accommodating to the same negative shock. What we are saying is that the Brexit shock is as if it would eliminate a particular number of jobs.
The basic idea for the commuting adjustment is that we identify in- and out-commuting for each district (for which commuting data are available) and then construct constituency data according to how much of each constituency lies within each district.
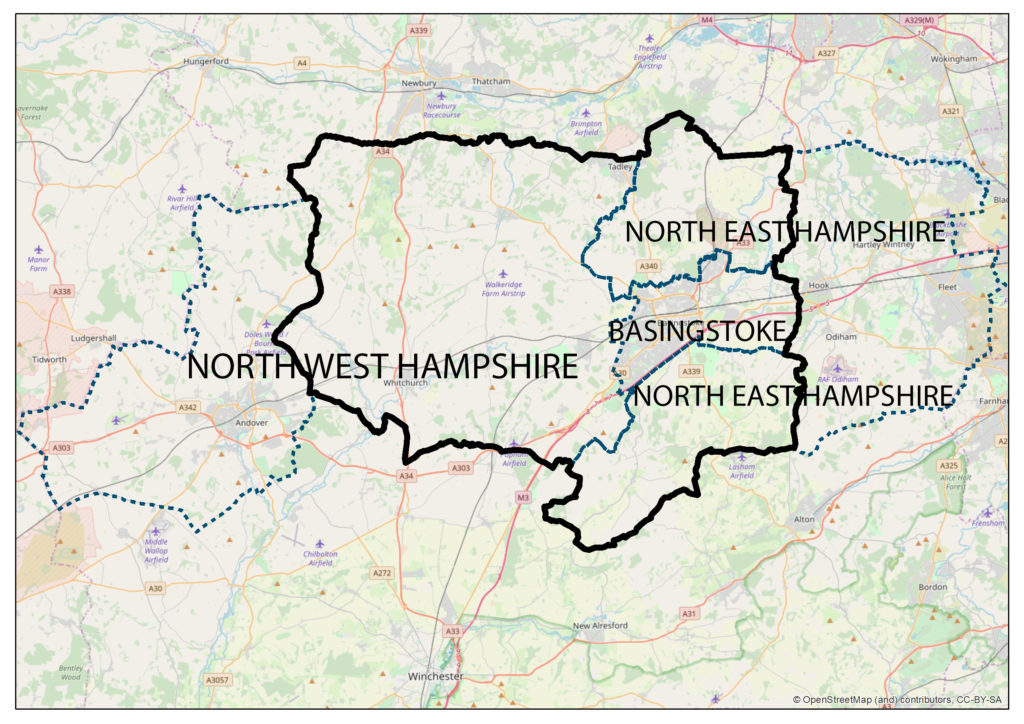
As a starting point for the conversion, we overlaid the boundaries of parliamentary constituencies in Hampshire and Sussex on the boundaries of Census merged local authority districts. Often parliamentary constituencies are nested within the boundaries of local authority districts. For example, the local authority district of New Forest is wholly comprised of two parliamentary constituencies – New Forest East and New Forest West – and the boundaries of local authority district of Crawley match precisely the boundaries of the parliamentary constituency of that name.
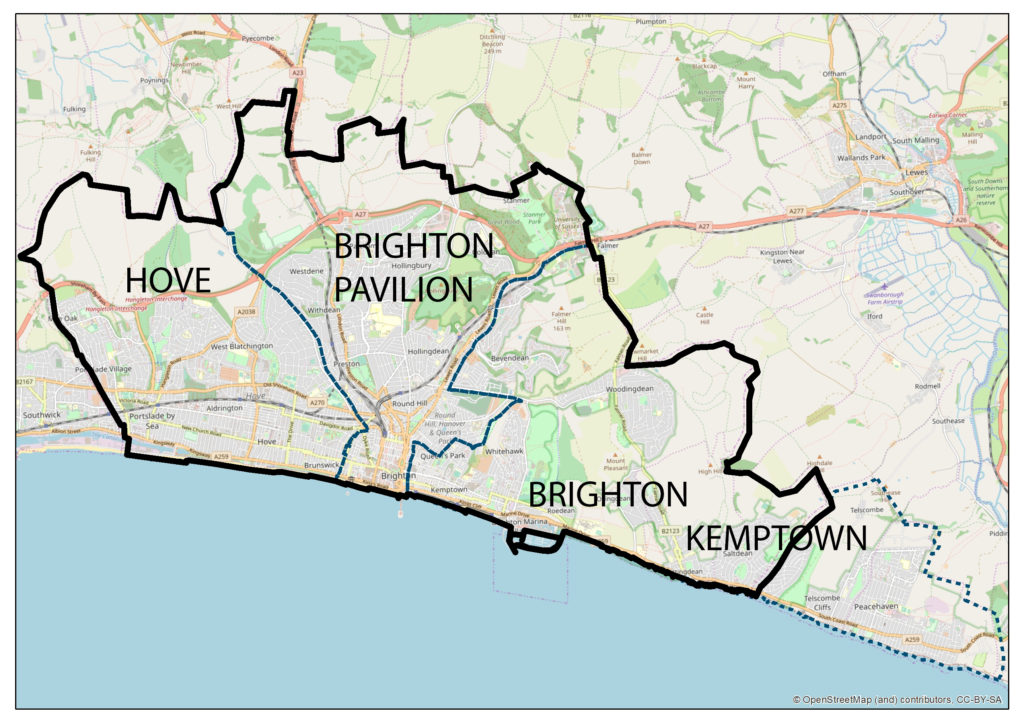
But more often than not, the boundaries of parliamentary constituencies do not match those of the local authority districts, as is illustrated in Figures 1 and 2, which show the parliamentary constituencies in Brighton and Hove, and Basingstoke and Deane respectively. For these constituencies, the adjustment for commuting flows was more complex. It involved the use of geospatial software to calculate the proportion of the geographic area of a given parliamentary constituency that lies within any district, complemented by the use of data on working-age population by parliamentary constituencies to estimate the shares in which parliamentary constituencies account for the in- and out-commuting of a given local authority district.
Annex Figure 1: Parliamentary constituencies in Brighton and Hove local authority district
Annex Figure 2: Parliamentary constituencies in Basingstoke and Deane local authority district
For example, 100% of the geographic areas of both Brighton Pavilion and Hove constituencies – as well as 75% of Brighton Kemptown – lie within Brighton and Hove district. And as far as Brighton Kemptown is concerned, its remaining 25% is within the Lewes district. Implicitly we assume that population is spread evenly across space within a constituency so that the population share attributable to a district is the same as the area share.
In the next step, we collected data on the working-age population of parliamentary constituencies, and using the geographic shares calculated above, calculated the working-age residents of each district in terms of its component constituencies. For example, in Brighton and Hove district there would be 201,000 working-age residents: 84,000 from Brighton Pavilion (100% of Brighton Pavilion’s working-age population), 69,000 from Hove (also 100% of Hove’s working-age population), and 48,000 from Brighton Kemptown (75% of Brighton Kemptown’s working-age population).
Next, we calculated the share of total working-age population of a local authority district that was resident in each constituency and used these to allocate the district’s commuting numbers across constituencies. So, continuing with Brighton and Hove, 42% of commuting flows in and out of this district are attributed to Brighton Pavilion (because 84,000 out of 201,000 working-age residents of Brighton and Hove district live in Brighton Pavilion constituency), 34% to Hove (69,000 out of 201,000), and 24% to Brighton Kemptown (48,000 out of 201,000). To obtain total in or out-commuting for Brighton Kemptown we then have to add the share of Lewes district’s commuting that is attributable to it.
The above shares formed the basis for apportioning commuting data from local authority district basis to constituency basis. Given that the focus of this analysis is on constituencies in Hampshire and Sussex, only those flows involving place of residence and/or place of work in Hampshire and Sussex were apportioned.
Dhingra, S., Huang, H., Ottaviano, G., Pessoa, J. a. P., Sampson, T. and Van Reenen, J. (2017a). ‘The Costs and Benefits of Leaving the EU: Trade Effects’, CEP Discussion Paper No 1478, Centre for Economic Performance, London School of Economics and Political Science, London, UK.
Dhingra, S., Machin, S. and Overman, H. (2017b). ‘Local Economic Effects of Brexit’, National Institute Economic Review, 242(1): R24–R36.
Emmerson, C. and Pope, T. (2018). ‘Risks to the UK Public Finances’. In: Emmerson, C., Farquharson, Ch. and Johnson, P. (2018). ‘The IFS Green Budget: October 2018’, Institute for Fiscal Studies, London.
Gasiorek, M., Serwicka, I., and Smith, A. (2018). ‘Which Manufacturing Sectors Are Most Vulnerable to Brexit?’, UK Trade Policy Observatory Briefing Paper 16, University of Sussex.
Swinney, P., McDonald, R. and Ramuni, L. (2018). ‘Talk of the Town’, Centre for Cities, London.
1. ‘Parliament’s ‘meaningful vote’ on Brexit’, Institute for Government, 9th November 2018.
2. The UK Government’s preparations for a ‘no deal’ Brexit scenario
3. As a comparison with our main results, we also report estimates of the shock implied by a ‘soft’ Brexit in the online Appendix (Table A6).
4. For the full set of results see: Constituencies Full Results
5. Ward, M. (2018). ‘Statistics on UK-EU Trade’, House of Commons Library, Briefing Paper 7851, 31 July 2018.
6. ONS regionalised estimates of UK service exports 2016.
7. Han, K., Graham, D., Ochieng, W. (2018). ‘M20/A20 Congestion Prediction With Post-Brexit Border Delays’, Imperial College London Consultants, London.
8. Source: ONS, Business Register and Employment Survey 2016. Employment data from the ONS Business Register and Employment Survey are also available for 2017, but given that the estimates of the national sectoral effects of Brexit that we make use of use below were based on 2016 data, it is more appropriate to base it on employment patterns in 2016. Employment data for parliamentary constituencies – the spatial unit of analysis that we use – are not available for Northern Ireland.
9. This group includes both public and private sector employment – the term ‘public administration’ does not imply that all employment in this group is public sector.
10. Part of the reason for this small share of agriculture in total employment is because the figures for farm agriculture employment are not available below regional-level in the ONS BRES data.
11. Other large employment centres within Hampshire and Sussex include Portsmouth and Southampton, but since they consist of two (or more) separate parliamentary constituencies they do not come top for employment.
12. The ONS data in table EARN02 show that the average weekly earnings in ‘finance and business services’ are higher than in other broad sectors of the economy: in 2017, mean earnings in this sector stood at £646 per week, rather higher than in construction (£594/week) and manufacturing (£589/week), the next highest paid sections.
13. We are ignoring here any offsetting gains from prospective free trade agreements with non-EU countries, but these are widely believed to be of rather limited significance, see, for example, Gasiorek et al. (2018) or the Government’s own analysis.
14. It is important to note that the size of employment does not equate with the number of jobs: i.e. one person employed may hold two jobs, while one job may involve sharing between several people. However, in our discussion for the ease of exposition, we are going to use ‘jobs’ as a synonym for employment.
15. The results are reported for broad aggregates, but the calculations are conducted at a far more detailed level.
16. The taxation system moves a substantial share of gross income between locations but we do not consider that here. IFS (2018) discusses how Brexit might affect public finances.
17. Source: ONS Census 2011. WU01UK – Location of usual residence and place of work by sex.
18. To be precise on the spatial units, commuting data for the UK that we use are reported for 346 Census merged local authority districts of England and Wales, 32 local authority areas of Scotland and 26 local government districts of Northern Ireland. More detailed commuting data are also available at the level of output areas (OAs), lower layer super output areas (LSOAs) and middle layer super output areas (MSOAs) but for England and Wales only.
19. Because at least one resident of Brighton Pavilion works in most of the local authority district areas of the UK, this exercise requires us to calculate potential job losses in nearly every district in the UK.
20. For total employment, two different data sources were used. For workplace-based Brexit employment shocks we used employment data from the ONS Business Register and Employment Survey, which capture employment among workers in an area. For residence-based Brexit employment shocks we used employment data from the ONS Annual Population Survey, which give employment numbers for the residents of an area.
21. Swinney, P., McDonald, R. and Ramuni, L. (2018). ‘Talk of the Town’, Centre for Cities, London.
Subsequent work repeats this exercise for the full list of 632 Parliamentary constituencies in Great Britain. A discussion of the (very slight) differences between this paper and the full results is here and the full results are in files for ‘no deal‘ and ‘soft deal‘ Brexit.