Is the Global Tariff an Improvement?
Has Signing a Free Trade Agreement Helped?
The UK left the European Union on 31st January 2020 and will leave EU trading conditions with the end of the transition period on 31st December. Following serious political effort, and innumerable crises, the UK and the EU have finally been able to agree what we understand to be a pretty basic free trade agreement to preserve the duty-free, quota-free trade between them that has ruled for three decades.[1] There will still be a good deal of short-term disruption in the new year, but the larger question is ‘how great will be the long-run economic damage of Brexit given that there is now a free trade agreement?’ In this paper, we update our previous analysis of the costs of Brexit to reflect the actual outcome and ask how much economic benefit the UK has gained from signing an FTA. We improve on our and others’ previous analyses by including a more detailed modelling of the costs of doing trade and estimates of the barriers to services trade that the exit from the Single Market will entail.
Any economic projection is subject to uncertainty and the dreadful events of 2020 have enlarged this several-fold. But no matter how economies around the world emerge from COVID-19 we know that trade policy affects economic outcomes and that the rough orders of magnitude and the directions of these effects tend to be similar whether the economy is booming or in recession. Thus this analysis estimates the effects of the trade policy changes that will occur on 1st January 2021 without offering any view about the recovery from COVID. It is assessing the incremental effects of trade policy decisions on top of whatever may happen in other dimensions.
Like all economic modelling exercises, ours starts from a baseline (in our case 2014) and adds changes in policy: first a representation of the free trade agreement (FTA), although with only the details available at present, and second the ‘No Deal’ Brexit we might have ended up with.
The analysis is related to our previous paper (UKTPO Briefing Paper 35, Fusacchia et al, 2019), but it is extended in three substantive dimensions: as well as specifying different scenarios to explore, this paper includes changes in services trade policy and also changes in a wider range of trade costs in goods. In addition, we refine the methodology by improving the estimates of the inter-country input-output linkages – the use of inputs from one country in the production of goods in another, as described in the online Appendix.[2]
In line with our previous analysis, we are still concerned more with value added (the incomes generated by trade) than with the value of imports and exports per se, and use the same model and underlying base year data as in our earlier paper. The model and the methodology used to unpack value chains and trace value added trade flows across countries and sectors is the same as that described in the Appendix to Fusacchia et al. (2019).
In analysing exports, we distinguish between domestic value added and foreign value added, so that we can track who produces the value embodied in UK output, and who, therefore, loses when exports of a particular product are disrupted. In terms of the UK’s participation in regional and global value chains, we consider both backward linkages (that is, the UK’s use of foreign intermediate goods (inputs) to produce exports) and forward linkages (exports of UK value added which is re-exported by the importing country). Because we also model inter-industry exchanges we can analyse trade in value added at the sectoral level.
The data we use are drawn from version 10 of the Global Trade Analysis Project (GTAP) Data Base, a baseline of consistent data on consumption, production, and trade for 121 countries and 20 regions in 2014.[3] For our calculations, we aggregate the 141 countries/regions into 10 regions: the UK (United Kingdom); France; Germany; Italy; the remaining 24 members of the EU[4], the 70 countries (excluding Japan) with which the EU has signed Free Trade Agreements (which we term the TAC countries[5]); China; Japan; the United States; and the rest of the world. In the calculations, we use a relatively detailed sectoral aggregation (55 products out of 65 goods and services included in the GTAP 10 Data Base), but when we present the results we do so for just ten aggregate sectors (see the Appendix for definitions).
Much concern has been expressed about the immediate impact of Brexit in terms of disrupted logistics. This is important, but our focus is long term, asking what the economy will look like once the practicalities of trade have been sorted out. Because our baseline is 2014, we are, in essence, asking what effect Brexit would have had if it had become fully operational by that year. We are not offering predictions for the early 2020s, but rather identifying some of the Brexit-related forces that will shape the future in addition to the trends in and shocks to the world economy and future changes in government policies.
The baseline data are described in Fusacchia et al. (2019). The key features, so far as the current exercise is concerned, are that around 49% of UK trade is with the EU, 10% with the USA and 2% with Japan. The UK depends heavily on imported inputs for its production of exports. They account for around 30 per cent of the gross value of exports, around 10% (one third) of which come from the EU, 5% from the TAC, 4% from the USA and 2% from China. Motor vehicles is one of the sectors most dependent on foreign inputs (50% of gross value of which 21% come from from the EU).[6]
The other way in which the UK is integrated into international networks is through forward linkages, which capture the value contained in the UK’s inputs sent to other economies for further processing and export to other countries. The EU is also the UK’s most important partner in this dimension – so-called ‘Factory Europe’: more than half of the UK’s forwarded value added goes via an EU country.
The calculations here are based on a standard computable general equilibrium (CGE) model of the world economy from the Global Trade Analysis Project (GTAP) Consortium (Hertel and Tsigas, 1997). Traditional CGE models assess changes in trade flows in gross terms and we then use a separate module to calculate the implied changes in value added trade.[7] Thus, just as with other Brexit simulations (for example, Ebell and Warren, 2016 or the UK Government, 2018), we consider changes in trade policies, which are implemented on gross trade flows (e.g. a tariff is levied on the whole value of an imported car), but we then decompose the results to examine their implications for international flows of value added. These will show that conclusions based on gross flows alone may be misleading about some of the effects of Brexit.
Like all models, ours is a simple representation of the actual economy, based on several assumptions – see Appendix to Fusacchia et al (2019). Thus its results are indicative rather than precise. However, given that the main determinants of the results are the structures of each economy (which we know) and the assumed changes in trade barriers (i.e. the shape of the trade agreements which are either known or have to be specified by assumption), they are still informative.
The main innovation here is the way we model trade policy. We distinguish five elements of the costs of doing international trade: tariffs, non-tariff measures on goods, non-tariff measures on services; border costs and rules of origin in FTAs. These vary across countries and with the nature of the UK’s trading relationship with them (the scenarios). On the latter, we explore two scenarios, each relative to the base in 2014: a ‘no deal’ Brexit and a Brexit with an FTA with the EU of the sort negotiated; that is, with tariff-free quota-free trade and some relief on non-tariff barriers to goods and services trade relative to ‘No Deal’.
Tariffs: UK imports from countries with which the UK does not have an FTA, will have to pay the new UK Global Tariff published in May 2020 – see Winters et al (2020). In turn, partners apply their Most Favoured Nation (MFN) tariffs to their imports from the UK. Where we model an FTA, we assume zero tariffs on all goods, although in reality nearly all FTAs have a few exceptions. The EU agreements with the TAC countries have somewhat more exceptions. The UK has managed to roll over most of these FTAs as Continuity Trade Agreements and is aiming to roll over the remainder before January 2021; although the roll-overs do not replicate existing trading conditions perfectly, we assume that they do and that the UK succeeds in rolling them all over.[8] Thus for the TAC we assume no change in tariffs (or indeed other trade policies) from the baseline.
Non-tariff measures (NTMs) for goods: estimates of these are taken from Cadot and Gourdon (2016) and are expressed as tariff-equivalents (i.e. as the tariff level that would have the same effect on trade). Cadot and Gourdon provide separate estimates for trade flows taking place within an FTA and those that do not, which we apply according to whether the UK is assumed to have an FTA with the partner concerned. We assume that base-line NTMs are currently zero within the EU (including the UK). In the ‘no deal’ scenario we set them equal to the average of the FTA and non-FTA rates for UK-EU trade (both ways). This is because the UK’s current alignment with the EU will weaken only gradually as Brexit comes into effect. We assume no changes in the NTMs imposed on or by the TAC and the RoW groups.
Non-tariff measures for services (NTMS): We do not attempt to measure the level of barriers to services trade in the baseline and the scenarios, but merely to measure the changes in UK-EU barriers that Brexit will induce. These are based on Fontagne et al (2016), who estimate the difference that membership of the Single Market makes to services trade flows within the EU. Other than UK-EU trade, we assume services barriers continue at their base levels in all scenarios.
We readily acknowledge that the NTMs estimates are very rough. However, they are more detailed than any of the others that have been used in the literature on Brexit. Dhingra et al (2017), for example, assume a single value for NTMs on all goods and services.
Border costs: Other than within the EU, all goods trade faces border formalities (customs forms, regulatory checks, etc). We assume that after Brexit, all trade does. These costs are not related to the height of the tariff and are not avoided by signing an FTA except an extraordinarily deep one (i.e something close to membership of the Single Market). With little hard information to rely on, we set these at 2% of the transaction value. No change is assumed for trade other than UK-EU trade.
Rules of Origin (ROOs): FTAs grant duty-free access not to goods dispatched from the partner country, but to goods produced in the partner country; hence they must have rules to determine what constitutes ‘made in’ the partner country. ROOs are often quite burdensome and potentially face any trade trying to take advantage of an FTA. We estimate them as adding 3.5% to the cost of a transaction. Imports that cannot prove they meet the ROO face the standard (MFN) tariff, so if the latter is below 3.5% for any commodity, we apply that to the flow, whereas if it is above we apply 3.5% (a preferential tariff of zero plus the 3.5% ROO-cost of claiming it). We assume no change in the cost of ROOs for the TAC.
The Appendix discusses the derivation and treatment of trading costs in more detail, but Table 1 summarises the values we use for UK-EU trade in our various scenarios.
| Trade cost | Base (2014) | ‘No Deal’ | UK-EU FTA |
| Tariffs: goods | zero | UK = UKGT; EU = MFN | zero |
| Non-tariff measures: goods | zero | (FTA+nonFTA)/2 | FTA |
| Non-tariff measures: services | zero | MFN | ¾MFN |
| Border costs: goods | none | applied | applied |
| Rules of origin: goods | none | none | applied |
Brexit will have at least three distinct effects. First, the increase in trade costs between the UK and the EU will lead each party to import less from the other and more from other foreign suppliers and also to increase the use of domestic supplies. Second, all the trade costs except tariffs absorb real resources in things like form-filling, queuing, etc, which can then no longer be devoted to producing products for consumption. Third, the changes in trade costs cause consumers/users to change what they consume/use, which is bound to reduce their welfare.
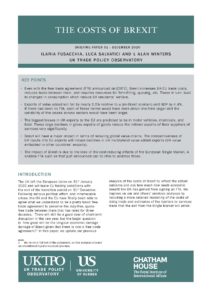
We start by analyzing the effects of Brexit with the negotiated FTA relative to the 2014 base. Even with this trade deal, Brexit still still entails the introduction of significant restrictions on UK-EU trade and hence on the incomes generated by trade. These trade frictions will reduce mutual trade and increase trade with other partners, especially China. The net effect on the UK will be an overall decline in UK trade globally. [9]
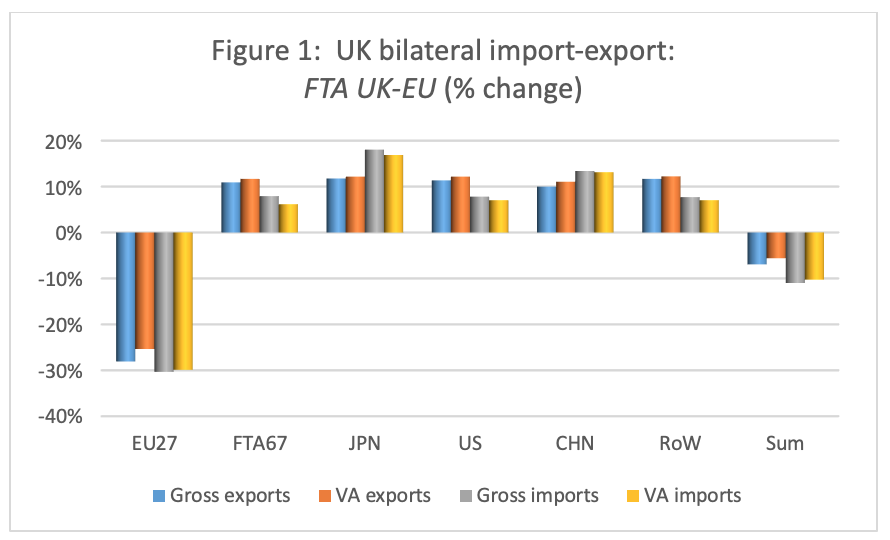
Figure 1 reports the estimated percentage changes in UK trade in terms of both gross value and domestic value added (incomes created in the exporter country). UK exports of both to the EU decline by 26%-28% and imports from the EU by 30%, while exports to elsewhere increase by at least 10% and imports from elsewhere by rather less than 10% (except for Japan, which provides many more motor vehicles than previously to the UK, as EU producers face new non-tariff barriers). For exporters, there are no changes in market access beyond the EU, but the loss of EU sales will induce them to seek, and have the capacity to supply, greater sales elsewhere. For imports, all other suppliers will become relatively more competitive in the UK as EU firms start to face more barriers than they did when the UK was in the Single Market.
The comparison between the changes in gross and value added export flows shows that the latter register smaller reductions and larger increases. This is because, following Brexit, UK exports will include a lower share of foreign value added as a consequence of the weakening of the UK’s economic integration with the EU. This, of course, implies a higher share of UK value added embedded in exports but it is not induced by an increase in employment: overall employment is assumed fixed in this kind of model and so the the higher domestic share reflects, rather, the overall reduction in gross exports.
All sectors will register declines in exports of value added to the EU and increases to other markets – see Appendix Figure A2. The biggest losses in exports to the EU are predicted to be in chemicals, machinery and motor vehicles, all of which have large pre-Brexit exports and face new non-tariff barriers, and in services, a large export sector, even though our assumed barriers to the EU are relatively modest.
Table 2 looks more closely at how the loss of exports as usually measured (gross exports) is allocated across sources of value added (income). Column [1] reports the decline in each sector’s gross exports. This is comprised of foreign and domestic value added (columns [2] and [3] respectively) plus a small amount of so-called double-counted value added ($716 million in the base year), which is not reported in the table. (Double-counted value added is explained in Fusacchia et al, 2019.)
| Gross Exports | Foreign Value Added | Domestic value added | Indirect Exports of VA | Exported Value Added | |||
| total | own sector | other sectors | |||||
| [1] | [2] | [3] | [4] | [5] | [6] | [7] | |
| Agriculture | -1256 | -318 | -930 | -609 | -322 | -373 | -981 |
| Food | -7175 | -2490 | -4641 | -2203 | -2438 | -203 | -2406 |
| Mining, petroleum & coke | -6456 | -3065 | -3361 | -2336 | -1025 | 123 | -2213 |
| Textiles | -2978 | -928 | -2027 | -1371 | -656 | -48 | -1419 |
| Chemicals | -11998 | -4336 | -7525 | -5001 | -2524 | -12 | -5013 |
| Metals | -690 | -31 | -624 | -571 | -53 | -428 | -999 |
| Motor Vehicles | -12168 | -6334 | -5642 | -2391 | -3251 | 50 | -2341 |
| Electronic and Machinery | -6586 | -2576 | -3920 | -3008 | -912 | 72 | -2936 |
| Other Manufactures | -1665 | -593 | -1051 | -766 | -285 | -140 | -906 |
| Services | 4464 | 403 | 4113 | 1584 | 2529 | -7972 | -6388 |
| Total | -46507 | -20268 | -25608 a | -16672 | -8937 a | -8930 a | -25602 a |
a/ The totals in columns [3] and [7] and in columns [5] and [6] differ only because of rounding.
Of the domestic value added, some is provided by the sector itself [4] and some by other UK sectors providing intermediate inputs [5]. For example, of the $12.2 billion decline in UK motor vehicles exports, $6.3 billion is of foreign value added (because the foreign share is large and there is some substitution against foreign inputs) and $5.6 billion of UK value added. Of the latter, only $2.4 billion comes from the vehicles sector itself and $3.3 billion from other UK sectors (so-called indirect exports). These losses of indirect exports are important in policy terms: they arise not because of the barriers raised on the source sectors but because of those applied to motor vehicles.
Column [6] collects up these indirect exports in a different way; for each sector it presents exports of value added via other sectors. Given the increase in gross exports of services, sectors which are important suppliers of inputs into services show small net increases in indirect exports. Conversely, the large declines in gross exports of goods reduce the indirect exports of their services suppliers significantly.[10] The change in UK services sectors’ total exports of value added is shown at the foot of the column [7]. It is the sum of the increase in direct exports ($1.6 billion – column [4]) and the decrease in indirect exports (-$8.0 billion – column [6]). Column [7] shows the loss of export income for each sector, and it is quite different in size and distribution from the loss of gross exports in column [1]. While the largest loss of exports in gross terms is in motor vehicles ($12.2 billion), the largest reductions in terms of total value added are for services ($6.4 billion) and chemicals ($5.0 billion). Overall, the losses in value added terms show less dispersion than those in gross exports. That is, once we move from considering gross exports to considering the sectors and people contributing to their value, the costs of Brexit are spread more widely.
The decline in foreign value added in column [2] of Table 1 demonstrates how Brexit will erode global value chains (GVCs). This arises from both the reduction of UK gross exports, which implies lower demand for inputs, and the reduction in the share of foreign value in the total value of exports, displaced by UK value added. The loss is concentrated on value added from the EU, which falls by 25% – see Figure A3 in the Appendix. These declines show that Brexit will have a major impact in terms of GVC reduction and restructuring, and it is worth noting that such a reshuffling of suppliers will be even more dramatic – and hence more costly – at the firm level than at the level of our aggregated sectors.
Relatedly, the reduction in the competitiveness of UK inputs into EU exports will also induce declines in UK multilateral value added exports – that is, exports of UK value added to one foreign country via transformation in another. UK value added reaching one EU country after transformation in another will decline by a bit over $7 billion and that reaching other destinations via the EU by around $7.5 billion – see Figure A4. With no change in the UK’s access to other markets, there are hardly any offsetting increases in multilateral value added exports via other countries.
Ultimately we are interested in economic welfare not just the level of exports: domestic consumption and incomes are the key variables. Hence in Figure 2, we report the changes in total value added by sector: that is, changes in the incomes that the sectors generate. The largest proportionate declines of income are in textiles (-7.1%), motor vehicles (-6.7%) and services (-4.7%), the last driven as much by indirect export losses as by its own direct loss of exports or consumption. At the industry level, at which the analysis is conducted, some industries suffer from the loss of exports – e.g. clothing, leather and motor vehicles – while others are mainly hit by the decline in overall activity – e.g. construction and public services.
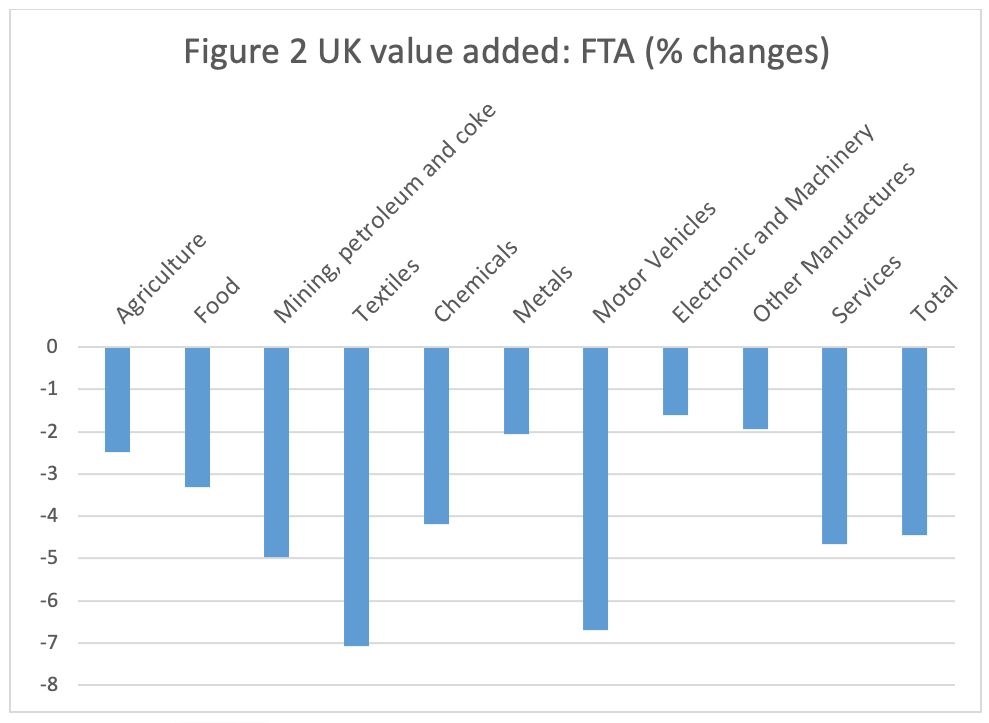
Figure 2 is bad news for UK incomes. Even under our very favourable long-run modelling assumption that all displaced workers and equipment get re-employed somewhere, gross domestic product (GDP), the sum of all value added, falls by 4.4%. The decline is pretty much the same for capital and for both skilled and unskilled labour.
Not only do the inefficiencies created by tariffs and extra trading costs create losses in output and incomes, but they also change the rate at which exports can be transformed into imports through international trade, viz. the terms of trade. Regional integration can improve the partners’ terms of trade relative to the rest of the world, and so undoing it can worsen them. The UK loses about $17 billion of consumption because its exports no longer buy as many imports, while the EU only loses about $4 billion. [11] Such changes in the terms of trade are straight transfers of welfare from the UK and the EU to other countries.
Until now, the literature on the effects of Brexit has been based on the UK adopting the EU MFN rates after Brexit – the rates that the UK has bound (committed not to exceed) in the WTO. In fact, the new UK Global Tariff published in May 2020, which we model, is slightly more liberal than that. Winters et al (2020) show that the weighted average tariff on goods imported from countries paying the MFN tariff falls from 2.1% to 1.5% (excluding non ad-valorem tariffs). Overall, the UK’s tariff reform makes no difference to the aggregate effects of Brexit, even though for some sectors – and hence for some localities – it matters.
In comparison with ‘No-Deal’, a free trade agreement with the EU avoids the tariff increase and entails somewhat smaller increases in non-tariff barriers on goods and services. On the other hand, most non-tariff measures and border costs still apply and rules of origin costs are introduced. Hence the FTA has not delivered anything resembling intra-EU trading conditions. Whereas with an FTA value added exports will fall by nearly 5.5% and GDP by 4.4%, these harms would have been about one-third larger had the UK not obtained an FTA.
Without an FTA, exports of value added would have fallen by about 7% compared to 5.5% and imports of value added by 9.5% compared with 12.5% – see Figure 3. UK exports and imports to and from the EU, both in gross and value added terms, would decline by well over 30% rather than by 30% or less and there would be correspondingly larger changes in trade with other regions – see Figure A5 of the Appendix.
Thus we can see that the new non-tariff barriers, border frictions and bureaucracy account for the bulk of the economic cost of Brexit not the tariffs that the UK narrowly avoided. That is, most of the impact of Brexit is due to the loss of the cost-reducing effects of the Single Market, which largely lie beyond the reach of this shallow FTA. Moreover, comparing the changes in gross and value added trade flows confirms that the FTA does little to redress the erosion of regional value chains with Europe. Brexit, even with an FTA, is basically de-globalising.
The effect is not uniform across sectors, however, because tariffs and non-tariff barriers are not uniform. Table 3 has the same structure as Table 2 but now in terms of the effects of adding an FTA to the ‘No Deal’ Brexit – i.e. the gains to signing an FTA. The table looks at how the change in gross exports Column [1] is allocated across foreign and domestic value added (columns [2] and [3]) and of the latter, how much is provided by the sector itself [4] and by other UK sectors [5].
As expected, most sectors will register an increase in gross exports relative to what we would expect under No-deal. This is especially notable where EU tariffs are high – food, textiles and motor vehicles – but it is also due to the difference between our estimates of FTA and non-FTA non-tariff barriers vary over sectors – see Appendix. Some sectors, however, such as Metals, Electronics and Other Manufactures do not gain from the FTA. Compared with ‘No Deal’ the FTA delivered only relatively small reductions in trade barriers for these sectors. Consequently, some of the factors of production (such as labour and capital) that they would have had access to under ‘No Deal’ will be bid away by sectors that gained more from the FTA. Services are also estimated to be beneficiaries of an FTA because we have assumed that the FTA will mitigate some of the increase in barriers that they will face in EU markets. Services are also the principal beneficiary of the increase in indirect exports (sales that arise from supplying inputs to other sectors’ exports).
Despite these differences across sectors in the effect of the FTA, the basic story relative to the baseline is pretty much the same under an FTA and ‘No Deal’. The FTA mitigates the declines in export performance, but only partially.
| Gross Exports | Foreign Value Added | Domestic value added | Indirect Exports of VA | Exported Value Added | |||
| total | own sector | other sectors | |||||
| [1] | [2] | [3] | [4] | [5] | [6] | [7] | |
| Agriculture | 267 | 68 | 198 | 136 | 62 | 147 | 284 |
| Food | 3033 | 1005 | 2014 | 950 | 1064 | 30 | 980 |
| Mining, petroleum & coke | 607 | 273 | 331 | 240 | 91 | -34 | 206 |
| Textiles | 1793 | 562 | 1225 | 769 | 456 | 36 | 805 |
| Chemicals | 1456 | 550 | 889 | 620 | 269 | 68 | 688 |
| Metals | -744 | -397 | -335 | -96 | -239 | 45 | -51 |
| Motor Vehicles | 3203 | 1769 | 1397 | 462 | 935 | -25 | 437 |
| Electronic and Machinery | -1177 | -358 | -824 | -354 | -470 | -20 | -374 |
| Other Manufactures | -213 | -39 | -174 | -61 | -113 | 72 | 11 |
| Services | 1525 | 244 | 1268 | 1230 | 38 | 1776 | 3006 |
| Total | 9751 | 3676 | 5989a | 3896 | 2093a | 2096a | 5992a |
a/ The totals in columns [3] and [7] and in columns [5] and [6] differ only because of rounding.
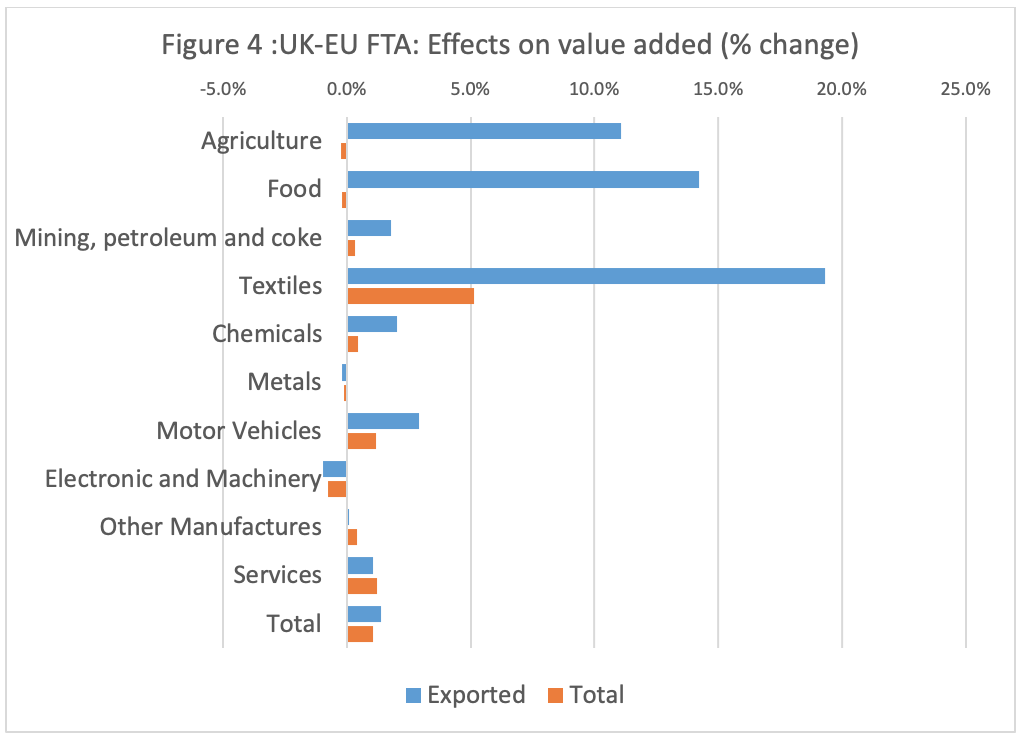
Figure 4 presents the estimated changes in exported and total value added by sector that have been induced by a UK-EU FTA relative to ‘No Deal’. Exported value added is up by 1.4% in aggregate and total value added by 1.1%. As noted above, food, textiles and motor vehicles are among the largest export gainers from the FTA, joined by agriculture when we consider percentage changes. The total value added story is slightly different, however. By far the largest gain accrues to textiles because exports account for such a large share of its output, followed by motor vehicles and services. Food and agriculture both actually record small falls in total value added as a result of the FTA. This is because although avoiding the high tariffs in the EU increases their exports relative to a ‘No Deal’ Brexit, the corresponding loss of protection in their (larger) UK markets reduces their output via increased competition from imports.
In welfare terms, signing an FTA has reduced the losses due to both the allocative inefficiency of levying tariffs on imports from the EU and the worsening of the terms of trade for the UK. Although the FTA has not changed the overall cost of Brexit by very much, it has significantly reduced the variability of the losses across sectors. (This is true both at the level of our 10 illustrative sectors but also across all 57 sectors in the model.) This is arguably desirable from a social point of view, because it tends to reduce the costs of adjustment to Brexit and probably the length of time over which they are worked out. Although we are not able to model these adjustment effects, they are nonetheless of significance. Essentially the FTA reduces the damage that losing access to the EU market would have had on those sectors which have grown up behind the EU protective wall – agriculture, food, textiles and motor vehicles.
It is relatively easy to identify which sectors’ exports and imports will be hardest hit by the Brexit-induced trade restrictions – those that heavily export to or import from the EU, and/or face the largest non-tariff barriers there. However, our study goes further. Foremost, it recognises Value Chains – the links between industries and, via Global Value Chains, that some of the inputs into UK exports come from abroad. Besides, it recognises that less trade means lower incomes and hence lower demand, and it recognises that hindering trade means you pay more for imports and earn less from exports.
Once we allow for these factors we see that, even ignoring the inevitable short-term disruptions, Brexit will be costly for UK society. We have analysed the introduction of trade restrictions on both goods and services and estimated that it will reduce UK GDP by around 4.4% relative to remaining as a member of the EU. This is not as harsh a view as the government’s own analysis (UK Government, 2018) or several others, but it still suggests a high cost of reclaiming ‘sovereignty’ with very little idea of what the UK will do with it.
This research was supported by grant ES/T002050/1, ‘Post-Brexit trade and investment’ from the Economic and Social Research Council.
[1] We do not a full text of the agreement, so this analysis is based on unconfirmed reports received up to now.
[2] See: http://blogs.sussex.ac.uk/uktpo/files/2020/12/Appendix-to-new-BP-for-FTA.pdf
[3] For a description of the GTAP Data Base version, see https://www.gtap.agecon.purdue.edu/databases/v10/index.aspx.
The 121 countries cover approximately 98 % of world GDP and 92 % of world population.
[4] Three EU members are not included in the GTAP database: Bulgaria, Croatia and Romania.
[5] TAC stands for ‘Trade Agreement – Continuity’, the term the UK government uses for the agreements that the UK has struck with these countries to continue trading on the same conditions as prevailed until the end of 2020 via their agreements with the EU. So far, agreements have been concluded with 58 of the 70 countries.
[6] These figures differ from those in Fusacchia et al. (2019), because of a more realistic division of imports from each source between final goods and intermediate goods.
[7] The GTAP-VA (Value Added) module carries out a post-simulation decomposition to derive the sources of value added
[8] On the partial nature of the continuity agreements, see Tamberi and Winters (2019)
[9] We have discussed similar scenarios in our previous Briefing Paper (no. 35, Fusacchia et al, 2019), but the current estimates are different because we are now using new estimates of the changes in trade costs which, in particular, allow us to consider the effects of Brexit on services.
[10] These indirect exports are sometimes known as Mode 5 service exports, as discussed by Borchert and Tamberi (2018).
[11] The UK loses more than the EU because Brexit is proportionately so much larger a negative shock for UK industries than for the corresponding EU industries. Thus UK firms are obliged to reduce their prices by more in order to try to claw back some of the lost exports.