
 Briefing Paper 68 – August 2022
The importance of market power to policy analysis
Import tariffs, import bans or a buyer’s club price cap?
The war in Ukraine drags on and in addition to the military support being given to Ukraine, efforts to halt any further Russian advancements continue to be focused on economic sanctions that would hamper Russia’s ability to finance the invasion. At present, there is increasing consensus among most EU and NATO members (as well as other like-minded countries) – i.e., ‘the West’ – that the best response is to create an Energy Curtain with Russia. This would entail a politically driven economic border, not dissimilar to the Iron Curtain of the Cold War era, premised on an end to trade in energy products with Russia.
BOFIT[1] analysis from May this year shows that the main remaining component of the Russian Federation’s revenue derives from tax receipts on petroleum oil and gas. Hence, policies that aim to dramatically reduce dependency on Russian oil and gas may make a lot of sense, but that will also depend on the impact of the policies on prices and on whether Russia can sell to alternative markets[2]. In the long run, the hoped-for result could be to reduce dependency to zero (decoupling), thus making the Energy Curtain with the Russian Federation a reality; and also negatively impacting on Russian oil and gas revenues.
This Briefing Paper contemplates Western sanctions through such an optic. Current policy actions have the immediate aim of hurting Russian oil and gas revenues foremost by capturing part of Russia’s oil rents. However, this can be a bit of a double-edged sword since there is also the risk that it adds to current concerns about rising consumer prices – especially for energy – but also inflationary pressures in general. We analyse the pros and cons of current trade policy responses in terms of the short-term aim of cutting oil rents and the long-term aim of creating a complete Energy Curtain between Russia and the West.
Specifically, we assess the implication of the actions undertaken and under consideration which includes:
While the focus of the brief is on energy, which includes both oil and gas, it is immediately clear from our shortlist of sanctions above (based on systematic queries with the Global Trade Alert Database) that few Western policy actions concern Russian gas and that most of the action has been in oil markets.
First, we introduce the premises of the various approaches that have been suggested. We argue that existing frameworks fail to allow sufficiently for the concentration of market power on both sides of the oil and gas markets. After covering the main instruments of the sanctions (tariffs, bans and price caps) we discuss some of the differences between the oil and gas markets and examine the effectiveness of the policy approaches.
Overall, we conclude that current interventions may have created more harm than good. While they may go some way in meeting the target of decoupling from Russian oil and gas, they may not be effective in the aim of impacting negatively on Russian revenues, and in the process have served more to raise energy prices. Only if the West could persuade OPEC to increase production quotas would it lead to a dampening response on the world market spot prices. At the same time, all these policies are short-sighted (defensive) and may be ineffective in creating an energy curtain that is consistent with Europe’s sustainability objectives and emissions targets.
The Russian Federation’s GDP is twice as dependent on oil and gas today as it was in 1989. But in both 1990 and 2022 oil and gas accounted for about 80% of hard currency earnings, the major difference today being that Russia is twice as open as the Soviet Union of the 1980s[6]. According to the most recent data from the World Bank (2020)[7], Russia’s oil rent, defined as the “difference between the value of crude oil production at regional prices and total costs of production”, is 6.1% of its GDP, which is low compared to, for example, Saudi Arabia’s at 17% or Kuwait’s, which tops the world, at 31.6%. Nevertheless, Russia’s oil rent is still among the highest in the world, taking into consideration the overall size of the Russian economy.
Not surprisingly, Russia and Saudi Arabia together account for the largest market shares in the World Oil Market – this is approximately one-third of total net exports (see also Appendix Table A1).
Figure 1: Europe in 1990 and 2022 – The Iron Curtain vs The Energy Curtain

Note: map sourced from https://www.cnbc.com/2022/05/19/two-maps-show-natos-growth-and-russias-growing-isolation-since-1990.html; with simple modifications by authors to denote the historical Iron Curtain (left) and the possible demarcation of the Energy Curtain (right).
Like the old Iron Curtain, the Energy Curtain would imply an almost complete cessation of trade in energy products and commercial relations between Europe and the USSR’s successor state, the Russian Federation. The Energy Curtain could run along lines similar to those of the Iron Curtain on the Russia-Finland border in the North, but further Eastward along the Baltic States’ border with Russia, around Belarus (due to its Russian support), and along the border of former Warsaw Pact Members, which are now members of NATO (Figure 1).The outcome of the ongoing war in Ukraine and any possible changes to the Ukraine-Russia border could ultimately determine how far East the Energy Curtain will be erected.
Moreover, this is not just a European issue. The new situation will mirror the Cold War in terms of actual and potential allies in Asia (such as China, India and Turkey) that Russia may be able to turn to as alternative buyers of its fossil fuels. In fact, China and India quickly became Russia’s biggest buyers of oil and gas in the immediate aftermath of the invasion and following Western sanctions.[8]
In 2021, Russia was the largest exporter of petroleum oils with exports amounting to approximately $181bn USD. This figure equates to 12% of world exports of oil that year. In contrast, Russia was the 11th largest exporter of gas in 2021 with exports amounting to approximately $9bn USD, which represented 2.4% of world exports of gas that year.[9] Both oil and gas are two of the most important components of Russia’s exports and foreign currency revenues.
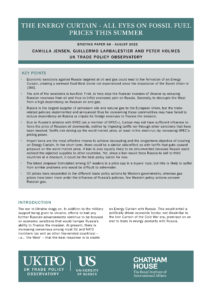
Using trade data for 2021, we find that close to half of Russia’s exports of oil are destined for the EU. The next two most important recipients are China and South Korea, which together with the EU-27 countries account for approximately three-quarters of Russia’s total exports of oil. The USA, Belarus, and Turkey account for an additional 12% and the UK for just over 1%. All remaining countries account for 11% of Russian exports, with individual shares from Japan (1%) downwards. Hence, the seven most important destinations for Russian exports of oil represent almost 90% of its total exports (see footnote 10).
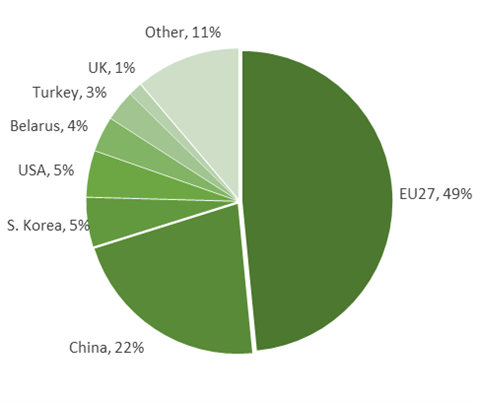
We observe a similar pattern when considering Russian exports of natural gas. Seven different destinations account for as much as 97% of Russia’s exports of natural gas. The three most important destinations (EU-27, Japan, and China), account for almost three-quarters of Russian exports, while other significant destinations include South Korea, the UK, Ukraine and Taipei (Taiwan) representing an additional 20% of Russia’s exports (see footnote 10).
The concentration of the EUs buying power (which economists refer to as ‘monopsony’ power) of Russian oil and gas (49% and 41% respectively of its total exports) is therefore apparently about equal.
Figure 2: Russian exports of oil and gas, 2021
|
Russia’s exports of Oil |
Russia’s Exports of Gas |
 |
 |
|
Note: Calculations are the authors’ own based on data extracted from the ITC Trade Map (see footnote 10). Results are illustrative as some data are suppressed for confidentiality |
|
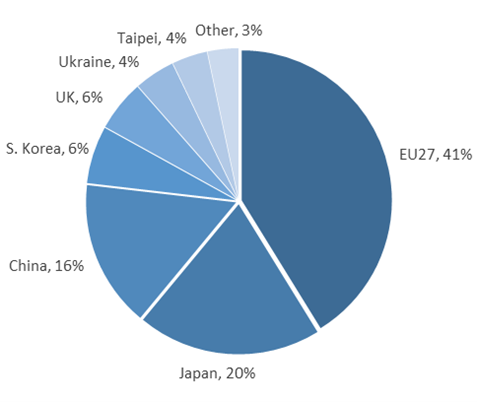
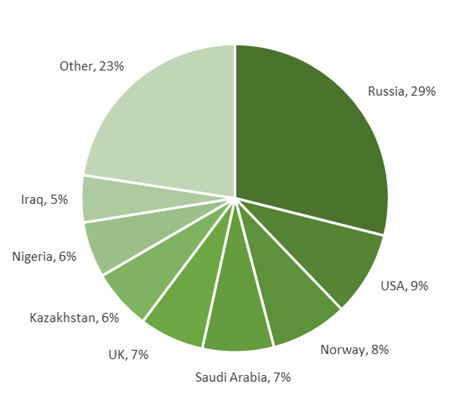
The EU-27 market is the main destination of Russian exports of oil and gas. Russia is also the main supplier of oil and gas for the EU-27 countries. Figure 3 shows that in 2020 Russia accounted for 29% of the EU’s imports of oil and 44% of the EU’s imports of gas from outside the EU. Eurostat, the EU’s statistical agency, quantifies the EU’s energy dependency rate on Russian gas in 2020 at 58%, which means that “more than half of the EU’s energy needs were met by net imports from Russia”.[10] This also suggests that the concentration rates (monopoly selling power of Russia to the EU) are somewhat higher in the European gas market than in the oil market.
The difference in the seller power of Russia on energy markets in Europe – and in combination with the more strategic importance of oil overall to the Russian economy in terms of foreign currency brought in by oil sales – could be the main reason why most economists have focused more on oil than gas in their advocacy. At the same time, the EU may also be more reluctant to target Russian gas with sanctions given the higher dependency on Russia for gas in the short term, especially for some member states such as Germany.
Figure 3: EU’s imports of oil and gas from Extra-EU countries, 2020
|
EU-27 Imports of Oil (from non-EU) |
EU-27 Imports of Gas (from non-EU) |
 |
 |
|
Note: calculations are the authors’ own based on Eurostat data. |
|
In relative terms, the oil and gas markets do not look so very different, but a key difference is that, whereas oil trade is relatively ’footloose’, gas trade is locked-in because of the necessity for a fixed infrastructure of gas pipelines. Around 80% of Russia’s exports of gas to the EU are delivered via pipelines[11], while only around one-third of oil supplies use such infrastructure[12]. For this reason, researchers at Bruegel advocated the use of an import tariff on Russian gas.[13].
A stumbling block for a clear-cut analysis in the case of both oil and gas trade with Russia is that under such monopoly (concentrated seller power) and monopsony (concentrated buyer power) conditions, it is not clear a priori what the implications might be of imposing taxes, tariffs or bans[14].
The difficulty of analysing the European energy situation with traditional trade policy tools – which rely on strong assumptions about the market being perfectly competitive – is that the market is, in fact, characterised by concentrated buyer (monopsony) and concentrated seller (monopoly) power[15]. The assumption that oil and gas markets are perfectly competitive is almost certainly incorrect.[16]
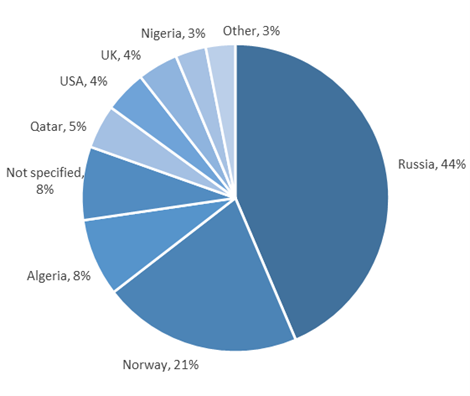
Table 1: Buyer and seller power in the world market for trade crude oil, 2019***
|
Importer (buyers) |
Value in EJ* |
Percent |
Exporters (sellers) |
Value in EJ* |
Percent |
|
European Union |
22.5 |
24.2% |
OPEC** |
55.0 |
56.9% |
|
China |
20.9 |
22.4% |
OPEC+ |
24.7 |
25.6% |
|
India |
8.5 |
9.2% |
Canada |
7.1 |
7.3% |
|
Japan |
7.1 |
7.7% |
Norway |
3.1 |
3.2% |
|
Korea |
5.0 |
5.3% |
Qatar |
2.8 |
2.9% |
|
C3 C5 |
56% |
C3 C5 |
90% |
||
|
69% |
96% |
||||
|
Total imports (net) |
83.1 |
100% |
Total exports (net) |
96.6 |
100% |
|
Source: IEA (2022): Atlas of Energy, International Energy Agency, energyatlas.iea.org |
|||||
|
Notes: *EJ stands for Exajoule and 1 EJ oil is the equivalent of 23884589.66 tonnes of oil |
|||||
|
** Normally OPEC+ signifies OPEC and other associated countries. In this table OPEC+is being counted as in ADDITION to OPEC members. See footnotes 20 and 21 for a list of OPEC and OPEC+ countries. |
|||||
|
*** All numbers are net – i.e. net imports or net exports C3 gives the share of the top 3 countries; C5 gives the share of the top 5 countries. |
|||||
We propose here to analyse Russian oil as one of the largest players in an oligopolistic[17] market where OPEC is the leader or price setter[18].
In Table 1, and using the most recent data available from the International Energy Agency (IEA), we have tallied up the C3 and C5 concentration indexes on both sides of the market and in terms of net trade[19]. These indices measure the sum of the market share percentage held by the three largest and five largest buyers (and sellers), respectively. While the EU boasts the largest concentration of global buyer power, only together with China and India is there likely to be significant concerted buyer power. On the seller side of the market, Saudi Arabia and Russia are the dominant powers (see the extended version of Table 1 in the Appendix). Moreover, Saudi Arabia’s position is enhanced by its leadership of OPEC[20] and Russia and nine other non-Western countries join OPEC in a looser but larger grouping OPEC+.[21]
As Saudi Arabia and Russia are the two largest oil producers in OPEC+, it is unlikely that Saudi Arabia would exclude Russia from negotiations about oil production quotas (that determine the oil price both in the short- and long-run) despite the war and the sanctions. Fundamental control over prices in OPEC rests on the continued collaboration between OPEC and other major oil-producing countries included in OPEC+.
There has been some debate about the extent to which OPEC really has monopolistic power in world oil markets, and the result can depend on the period under scrutiny[22]. In addition, broader recent analysis[23], suggests that we need to understand OPEC as embedded in a global political economy power struggle between Western economies, emerging economies and poorer developing countries, and not simply in economic terms.
In some periods, OPEC has determined world oil prices, in others, it has lost some of its monopoly power due to factors that were often beyond its direct influence. Among these has been the relative reduction in dependency on OPEC oil among Western nations, notably the US, which has, over the last two decades, largely decoupled itself from world oil markets.[24] One additional factor that has given OPEC increased market power now is the combination of Western countries outsourcing more production of manufactured goods to fossil-fuel intensive countries in Asia and large emerging economies (i.e., China and India) having a high import dependency on oil from the OPEC and OPEC+ countries.
Therefore, we can think of OPEC as the market leader that effectively exerts a tight discipline over the prices applied by its own members, by setting the quantity sold in world markets. In relation to the outer members (as in a hub and spoke constellation) OPEC then coordinates with each individual country in OPEC+ (see also footnote 20) – which also includes Russia.
In the simplest case, assume that OPEC has monopoly power in its markets and sets the quantity in a way that maximises its own profits. The quantity set then strongly influences the world price of oil. The auxiliary assumptions for this analysis are that each of the markets in the spokes (i.e., the OPEC+ countries) adopt the world price determined by OPEC production levels (OPEC is the hub -because it provides such a large share of supply so it is effectively the market leader). Each of the OPEC+ sellers is embedded in their own localised markets, partly locked in due to the dependence of oil trade on infrastructure such as pipelines[25], but also partly locked in due to customs and established trade relations.
Perhaps, a slightly more realistic view is that OPEC recognises that non-OPEC supplies respond to the quantity it sets and the resultant impact on the world price, and OPEC allows for this when deciding and setting its quantities. That is, OPEC operates a residual demand after non-OPEC suppliers at the given price have been netted out. Hence, the non-OPEC countries in the spokes effectively act individually as price-takers.
In either of the two scenarios set out above, if one of the localised markets (such as the impact on Russia and the Eurasia region) is heavily disrupted a demand shock spills out into OPEC’s residual market and changes OPEC’s optimal quantity and consequent price. We can view the current situation in these terms as sanctions (in either direction) that disrupt localised trade ties in the Eurasia region.
Figure A1 in the Appendix offers a more detailed version of this argument and provides the context for our subsequent comments about the different policy proposals on decoupling from Russian oil and gradually driving Europe towards establishing an Energy Curtain with Russia.
Economists Pisani-Ferry and Blanchard[26] have advocated the use of an EU import tariff on Russian oil based on the EU’s concentrated buying power argument.
If we take into account the analysis in the preceding section, the market outcome (i.e., the change in market equilibrium resulting from a policy intervention such as a tariff or a ban) would actually depend on the relative balance between buyer and seller power in the market.
While a tariff could be well directed in the world of a competitive market (such as these authors assume), we suggest that the underlying premise is incorrect. Table 1 suggests that Europe does not have sufficient buyer power to force the Russian oil price downwards either by using a tariff or (most) other sanction. Instead, there is a real danger that tariffs will drive up the world market price, at least in the short run, because it increases OPEC’s power over prices further.
It could be for this reason that the European Commission has instead proposed a ban on Russian seaborne oil. But our analysis (in Appendix Figure A2) suggests that the impact of a ban could be similar to that of a tariff and perhaps even worse for European consumers. A ban would similarly lead to potential upward pressure on the world market price. Moreover, a ban may be circumvented because Russia could redirect the rejected supplies to other countries.
Overall, the result then is solely to shift buyers of oil from Russia between the EU and other world markets. As these prices across markets are integrated due to OPEC+, Russia will receive prices close to those that prevail on world markets. The result of the ban could be argued to be possibly even worse for Europe as a ban does not give the implementing nation(s) control over who gains the revenue that a tariff normally raises (in the case of the tariff it has been argued the tariff revenue could be used to, at least partially, compensate European consumers). Instead, with a ban, profits could be shifted both to Russia in the form of higher prices and/or in exchange for a compensating lower price or rebate for other buyers of Russian oil. On the other hand, Josep Borrell Fontelle (the EU Commission’s Vice-President in charge of coordinating the external action of the European Union) argues that sanctions, such as a ban, will be effective in reducing Russia’s oil rent because Russia would only be able to sell large quantities of oil on to other third markets (such as for stock taking by China and India) at a discount[27].
It is in this context of the perceived and possible futility of the previously proposed policies and their anticipated outcomes for the world price, that we should understand the latest proposal being formed among the G7 leaders. This initiative is close to the ideas of Fishman and Miller,[28] – who argue for implementing a price cap in a buyers’ club of countries – as the most effective kind of sanction in the current scenario. But, instead, it puts a price ceiling when buying oil from Russia.
In a certain sense, the idea of a price ceiling is a way to deal with the problems of previous policy proposals as discussed above. G7 leaders seek to drive down the price of Russian oil from above and tie in sales to insurance of the freight being conditional on the adherence to the price ceiling. But as several commentators have suggested this will only be possible if the policy cannot be circumvented by alternative buyers and insurers in other countries. The price cap plan is, therefore, likely to suffer from similar problems and may be very cumbersome to administer and implement in practice. There may also be a certain reluctance in the West to apply the policy.[29]
Meanwhile, and in light of the significant impact that Saudi Arabia has on quotas and the functioning of OPEC and OPEC+, the White House has initiated negotiations that could result in a loosening of current OPEC quotas. This may help to reduce the current upward pressure on the world’s oil prices. We also argue that the upward pressure on prices could have been caused by the protectionist and defensive trade policies that have been deployed against Russia over the last couple of months.
What this analysis shows is that there are no easy solutions to meeting the dual objectives of decoupling from Russia, and also impact on Russian revenue from energy sales. Given the nature of the market structure, existing policies are unlikely to achieve both these outcomes and it is important to recognise this.
Looking at outcomes in the markets for oil and gas, we now consider what it suggests about the efficacy of the policies and their consequences for consumers and Western decoupling from Russian oil and gas.
According to Figure 4, (which shows spot prices of oil and gas since the beginning of the year) mainly oil prices have responded to the different trade policy actions by Western governments (whereas gas prices have been more under the influence of Russia’s policies). The second hike in oil prices after the war started coincides with the implementation of an import tariff on 11 March, 2022 by the UK, Japan and several (if not most) EU countries. Spot markets did not react similarly when the tariff was followed by a ban in early April. By 14 June, 2022 (when the White House announced Biden’s projected visit to Saudi Arabia on 15-16 July) it did seem to have a dampening effect on the oil price, perhaps in anticipation of a successful outcome of the visit. It remains to be seen how the ban on seaborne oil from Russia will affect world market prices when implemented towards the end of the year and if the ban could put downward pressure on the price and revenue Russia fetches on its oil.
Conversely, the situation in the gas market has mainly been affected by Russian arm-twisting on the exchange market, which has been going on since late April when Poland and Bulgaria were cut off from supplies[30] (because Russia demanded to be paid in Rouble for its gas and had threatened to cut off its gas supplies to individual buyers in Europe otherwise).
The recent spike in the European gas price that coincides with the White House’s announcement of Joe Biden’s visit to Saudi Arabia is more likely caused by Russia, as on the same date, (14 June 2022) Gazprom announced its intention to cut gas from Nordstream 1.

More detailed time-series analysis would be necessary to fully disentangle the policy effects from the underlying general trends (such as controlling for the business cycle and seasonality trends) in the price series shown in Figure 4.
Russia is among the world’s largest oil-producing and exporting countries. It participates actively in the formulation of oil prices through its membership of OPEC+. While Europe also has market power on the buying side of the market, this power appears to be markedly weaker due to Europe’s inability to obtain concerted action from other important buyers of Russian oil such as India and China.
The outcome of different trade policy instruments and the timing of defensive instruments such as tariffs, bans and price caps, will depend on which side of the market exhibits the most power. However, our analysis suggests that, at the moment, Russia has more seller power (though indirectly as a member of OPEC+) than Europe has buyer power of Russia’s fossil fuels. Therefore, we conclude that these policies may well not work as well as intended in terms of inflicting economic pain on Russia. However, the West may wish nevertheless to continue in part because it is morally correct to decouple and the very act of decoupling is likely to speed up the longer-term transition to alternative energy sources and less dependency on Russia.
The data broadly support our analysis, namely that misplaced policies could, in large part, be behind the recent oil price hikes. In contrast, the same has not been the case for gas price developments, which seem more decoupled from Western trade policy at the moment (but not Russian policies). Moreover, Russia’s oil supplies have not declined but have rebounded despite the many sanctions imposed (according to BOFIT analysis).
The main differences between oil and gas markets are:
Perhaps for these reasons Russian policies have focused more on the gas market in retaliation towards the West whilst Western economies have targeted oil markets foremost in their sanctions packages and policy responses.[31] However, the current series of initiatives in oil markets might end up harming European and world consumers and hamper the green transition towards renewable energy forms.
While high prices on fossil fuels are beneficial for the green transition, this is only true when there are viable alternatives to fossil fuels available. In fact, high prices on fossils in the form of increased producer profits send the wrong market signals about the long-run profitability of investments in fossil fuels.
The irony of the situation demonstrates the difficulty of the green transition towards renewable energy. The price of fossil fuels may not matter as much for consumer choice as long as there is nothing to switch to in terms of sufficient renewable energy sources and accompanying infrastructure.

Figure A1: A simple sketch of oil price formation with OPEC monopoly and Russia in OPEC+

Figure A1a shows the Russian market where we make the simplifying assumption that Europe is the sole consumer of Russian Oil. Most analysis assumes that the European countries have sufficient buyer power in the Russian market to affect the price Russia fetches on its fossil fuels.
But the equilibrium oil price and quantity in the Russian market could be determined by the World Oil Market which is dictated by the monopolistic price-setting behaviour of the OPEC countries, as the largest united cartel of oil-producing countries.
For simplicity, we have assumed that, in the short run, the demand curve in Europe for Russian oil is near vertical. This has to do with the fact that oil is a necessity good with few substitutes (due to the systemic and mechanical lock-in of infrastructure and machines to different fuel forms).
The concentration of seller power in OPEC (i.e. OPEC countries acting in a concerted price-setting effort as a cartel and thereby effectively setting the world market price) is sketched in Figure A1b. The monopoly behaviour of OPEC determines the world equilibrium price on oil Pw, where we have assumed that all other players (including Russia) relative to the OPEC inner circle are price-takers and will offer their oil at the same price as OPEC offers. This collaboration is officially coordinated in the larger OPEC forum of OPEC and OPEC+ countries[32]. (All the other non-OPEC countries will also be spokes and price-takers as Russia in this hub-and-spoke setup and OPEC+ is the forum that ensures the collaboration of the spokes.)
We next use this simple framework to discuss the likely impact of the different trade policy instruments proposed. However, given these simplifying but still more realistic assumptions about the World Oil Market, we note that any signal of an increase in demand for the OPEC part of the world market would lead to an increase in the world market price Pw which would also feed over into the Russian market as PR = Pw.
In Figure A2, we added the tariff on top of Russia’s marginal cost from producing oil. Again assuming for simplicity that at the outset Europe is the sole buyer with a perfectly inelastic demand curve for oil in the short run. The immediate result would be to capture part of the Russian oil revenue with the tariff (marked with the area A in Figure A2a). However, if Russia has enough seller power to redirect part of its oil to third country markets outside Europe (such as India and China), this could lead to the tariff placing an upward pressure on the World Oil Market price Pw (because the redirected Russian oil towards other countries sends a signal to OPEC that the world market is expanding due to the now unsatisfied demand from Europe in the Russian market). In the end, the area A would then just be shifted as a rebate to buyers in other country markets paid by European and World consumers. Under these different assumptions, the tariff on Russia may therefore not have the impact that was initially anticipated.
Our framework suggests that the impact of a ban could be similar to that of a tariff and perhaps even worse for European consumers. Because a ban would (Figure A2a) work towards shifting inwards the curve we have labelled DEurope. But again, would the unsatisfied demand in Europe lead to a signal in world markets that pushes outwards the downward sloping demand curve to now D1?
Figure A2: Imposing a tariff on Russia in OPEC+ may lead to an upward pressure on the world price

SHAPE \* MERGEFORMAT
[1] The Bank of Finland Institute for Emerging Economies (BOFIT). 25 May 2022. “Russia’s economic downturn is felt in government budget revenues; military spending soars.” https://www.bofit.fi/en/monitoring/weekly/2022/vw202221_2/
[2] See: Martin Sandbu’s blog on ‘Why ending energy imports from Russia remains essential’ (also reproduced in the Financial Times on June 8th, 2022): https://publicnewstime.com/market-news/why-ending-energy-imports-from-russia-remains-essential/
[3] According to the GTA Database: https://www.globaltradealert.org/data_extraction.
[4] According to the latest plan, all Russian oil imports via sea will be banned from the end of 2022, whereas pipeline crude will be exempt for the time being. For a full analysis of the 6th package of EU sanctions on Russia see: https://oilprice.com/Latest-Energy-News/World-News/EU-Greenlights-Embargo-On-Seaborne-Russian-Oil.html
[5] According to Reuters (https://www.reuters.com/business/energy/g7-leaders-agree-study-russian-energy-price-caps-officials-2022-06-28/): “The idea behind the cap is to tie financial services, insurance and the shipping of oil cargoes to a price ceiling. A shipper or an importer could only get these if they committed to set a maximum price for Russian oil.”
[6] See Sergei Ermolaev’s 2017 working paper entitled ‘The formation and Evolution of the Soviet Union’s Oil and Gas Dependence’ (https://carnegieendowment.org/2017/03/29/formation-and-evolution-of-soviet-union-s-oil-and-gas-dependence-pub-68443#Oil%20and%20Gas%20in%20Soviet%20Foreign%20Trade):https://carnegieendowment.org/2017/03/29/formation-and-evolution-of-soviet-union-s-oil-and-gas-dependence-pub-68443#Oil%20and%20Gas%20in%20Soviet%20Foreign%20Trade
[7] As published by the World Bank in the World Development Indicators series: https://data.worldbank.org/indicator/NY.GDP.PETR.RT.ZS.
[8] Sales of Russian oil and gas to China and India reportedly amounted to $24 billion USD – almost double and five times the amount a year earlier, respectively – in the first three months since the start of the war, but they have now fallen by 30% since its peak (July 2022). See, for example, reports by Business Standard (6 July 2022), and Bloomberg (18 July 2022).
[9] Values on Russian exports were extracted from the ITC Trade Map (trademap.org), which is based on Federal Customs Service of Russia statistics and UN COMTRADE statistics. Export values of gas are approximated by commodity code HS 2711, and export values of petroleum oils are approximated by the sum-total of commodity codes HS 2707, HS 2709 and HS 2710. Note that shares should be interpreted with caution as some bilateral data are suppressed or not disclosed. Alternative sources, such as The World Factbook (CIA), or BP’s Statistical Review of World Energy, quantify Russia’s exports of natural gas to be much larger than those suggested by Trade Map.
[10] https://ec.europa.eu/eurostat/cache/infographs/energy/bloc-2c.html
[11] This was in 2021 according to a recent report from the European Commission: https://ec.europa.eu/energy/sites/default/files/quarterly_report_on_european_gas_markets_q2_2021_final.pdf
[12] https://lloydslist.maritimeintelligence.informa.com/LL1141073/EU-oil-ban-compromise-sidelines-Russian-seaborne-imports
[13] See for example: https://www.bruegel.org/wp-content/uploads/2022/04/WP-05-280422.pdf
[14] For example, Stiglitz shows that depending on the shape of the demand curve the imposition of a tax on a (natural) monopolist can lead to a pass-through greatly in excess of 1 and a large decline in output. See Stiglitz, J. E., & Rosengard, J. K. (2015). Economics of the public sector: Fourth international student edition. WW Norton & Company. Figure 18.9.
[16] An example of an analysis of the problem cast in the standard context can be seen here – https://voxeu.org/article/simple-economics-tariff-russian-energy-imports
[17] In economic analysis of different market structures, oligopoly is defined as a market under limited competition as a small number of sellers dominate the market and hold effective power over central market conditions such as the ability to determine a specific price.
[18] See for example: Asker, J., Collard-Wexler, A., and De Loecker, J. (2019). (Mis) allocation, market power, and global oil extraction. American Economic Review, 109(4), 1568-1615.
[19] For simplicity we focus on crude oil, crude oil is the main component of Russia oil exports with more than two thirds – see also https://www.weforum.org/agenda/2022/04/which-petroleum-products-does-russia-supply-to-world/
[20] OPEC currently counts the following member states: Algeria, Angola, Congo, Equatorial Guinea, Gabon, Iran, Iraq, Kuwait, Libya, Nigeria, Saudi Arabia, United Arab Emirates and Venezuela. The information is taken from OPEC’s homepages: https://www.opec.org/opec_web/en/about_us/25.htm
[21] Add to OPEC the following ten countries to get to OPEC+: Azerbaijan, Bahrain, Brunei, Kazakhstan, Malaysia, Mexico, Oman, Russia, South Sudan and Sudan. According to the latest information available from Bloomberg: https://www.bloomberg.com/news/articles/2021-11-02/opec-plus-start-thinking-opec-minus-oil-strategy
[22] See for example Alhajji, A. F., and Huettner, D. (2000). OPEC and other commodity cartels: a comparison. Energy Policy, 28(15), 1151-1164 or the review of economic models and OPEC price setting behaviour by Al-Qahtani, A., Balistreri, E., and Dahl, C. (2008). Also the literature review on oil market modeling and OPEC’s behavior. Paper, Division of Economics and Business, Colorado School of Mines).
[23] Such as this working paper from the University of Kassel by A. Madita Rabe (2021). Why did OPEC lose its price setting power during the 1980s. https://kobra.uni-kassel.de/bitstream/handle/123456789/13009/New_Research_in_GPE_2_2021.pdf?sequence=3&isAllowed=y. Or, Thompson, H. (2022). Disorder: Hard Times in the 21st Century. Oxford University Press.
[24] For example, during the period 2005-2020 US net imports of oil has been driven to an all time low acording to the US Energy Information Administration: https://www.eia.gov/energyexplained/oil-and-petroleum-products/imports-and-exports.php).
[25] 1/3 of oil supplies between the EU and Russia depend on pipelines.
[27] See the blog by Borrell on EU sanctions here – https://www.eeas.europa.eu/eeas/sanctions-against-russia-are-working_en
[28] Fishman and Miller (2022). The Right Way to Sanction Russian Energy. Foreign Affairs. May 17, 2022, https://www.foreignaffairs.com/articles/russian-federation/2022-05-17/right-way-sanction-russian-energy?
[29] See Financial Times, “West eases efforts to restrict Russian oil trading as inflation and energy risks mount”; West eases efforts to restrict Russian oil trading as inflation and energy risks mount | Financial Times (ft.com)
[30] https://www.bloomberg.com/news/articles/2022-04-27/four-european-gas-buyers-made-ruble-payments-to-russia
[31] See: If Putin is using gas prices to fight Europe, how can it fight back? https://www.theguardian.com/world/2022/jul/29/if-putin-is-using-gas-prices-to-fight-europe-how-can-it-fight-back?
[32] See also https://www.themoscowtimes.com/2019/12/04/6-things-opec-russia-a68409.