
Download Briefing Paper 22
Mode 5 services exports by region
Foreign services, international integration and exports
This Briefing Paper highlights the importance of services inputs—domestic as well as foreign ones—for UK manufacturing exports. We provide a detailed picture of individual UK regions and nations’ usage of domestic services inputs, and we describe the conducive role of foreign services inputs for export success.
The UK is one of the most services-oriented economies in the world, both in terms of production and exports. The overwhelming majority (80%) of the UK’s Gross Value Added consists of services. The value of direct cross-border services exports is nearly as large as the value of merchandise goods exports; they account for 45% of total exports, a share that is not attained by any other major economy. By comparison, the United States’s share of services in its total exports is below 35%, and the EU-28’s share is about 27%. Given the salience of services trade for the UK economy, the virtual absence of services in the current discussion about contours of the future UK-EU trade deal is stunning.
Whilst such a prominent position of services exports in the UK is impressive in international comparison, it still underestimates the significance of services. This is because there are multiple ways of exchanging services internationally, and trade statistics for services typically only refer to the ‘disembodied’ sales of services that are directly sold abroad by UK firms, often via the Internet.[1] In WTO parlance this is called ‘Mode 1’ services trade, and UKTPO Briefing Paper 14 provides a detailed account of precisely this kind of services trade across UK regions.
In this Briefing Paper, however, we focus on a different aspect of services trade. Specifically, a sizable share of the value of manufacturing products sold abroad, in fact, consists of services inputs that either become part of the product (such as software), or that facilitate the manufacturing process or the product’s distribution, such as R&D or branding. As such, these services inputs are the result of a long-term trend in advanced economies that sees an increased use of bought-in services in production, thereby leading to a higher share of value added originating from services sectors. This tendency has aptly been described as “servicification of manufacturing.”
The value of services thus traded is also known as the ‘fifth mode’ of services trade, in order to distinguish this channel from the conventional four modes of services trade as set out in the WTO’s General Agreement on Trade in Services (see Footnote 1). In a nutshell, “Mode 5 services can be simply defined as the services content embodied in goods exports. Typical mode 5 services include, inter alia, design, engineering and software that are incorporated and traded as part of manufactured products” (Antimiani and Cernat, 2018). The services inputs referred to as ‘mode 5 exports’ do not encompass services that are sold as part of a package of goods and services as these services remain separate despite the commercial bundling.
Mode 5 exports will clearly be impacted by whatever consequences Brexit has for trade in goods. The ultimate outcome of the Brexit trade deal negotiations—whether it is staying in the Customs Union or even in the Single Market, some form of ‘Facilitated Customs Arrangement’, or a looser form of free trade agreement—will, in any event, change the conditions under which UK manufacturing goods can be exported, and with it the derived demand for all the services that go into UK manufactures.
Since it is the Government’s stated goal to create an economy that works for everyone, it is pertinent to go beyond the aggregate national level and to try and gauge the regional dimension of Brexit impact. We, therefore, compute estimates of mode 5 services exports for each of the 12 UK regions and nations (at the NUTS 1 level), taking into account the sectoral specialisation of each region. In addition, we disaggregate exports towards EU and non-EU destinations, respectively.
We first focus on domestic services inputs into manufacturing exports as they vary across regions and industries, respectively. This is in the spirit of gauging the potential exposure, or vulnerability, of individual regions. We then look at the other constituent part of mode 5 trade, namely foreign services inputs, and link this to manufacturing export performance.
The Trade in Value Added (TiVA) database, jointly compiled by the WTO and OECD, provides information on the value added shares of a country’s gross exports, e.g. the share of services value added across exports of various manufacturing sectors.[2] In TiVA these statistics are provided at the national level, but we combine information from TiVA with HMRC trade statistics to compute mode 5 exports at the level of individual UK regions.[3] The two principal assumptions required to do so are (1) applying the share of services value added in manufacturing exports as observed at the national level equally to all regions, and (2) assuming that all services embodied in a region’s manufacturing exports are sourced from that same region.[4] This is a plausible approximation, though it cannot account for the fact that certain services are traded across UK regions; for instance, financial services embodied in a car exported from the North East might actually have been procured from Edinburgh or London.
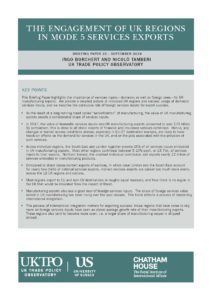
The share of domestic services value added in manufacturing exports does not vary much over time because it represents a structural input-output relationship. This share stood at about 25% in 2005 and has since declined slightly to 22.6% in 2014. At the same time, the domestic services input share varies across manufacturing industries. We draw on the most detailed sectoral information available in TiVA to compute an individual region’s mode 5 exports by taking into account its actual distribution of exports across manufacturing sectors. For instance, ‘Food and beverages’ is the sector with the highest share of domestic services value added whereas the same share is, unsurprisingly, much lower in an industry such as ‘Coke and petroleum’ (Figure 1). It is thus evident that a region that exports mainly food and beverages and other transport equipment will tend to have a larger value of mode 5 exports than a region that specialises in, say, fabricated metals.
Source: OECD – WTO TiVA Database
Table 1 shows the value of total domestic mode 5 exports from each region for years 2011-17. For the UK as a whole, embodied services inputs accounted for almost £71 billion in 2017. Compared to the value of cross-border services exports, the distribution is less skewed across regions. The two largest exporting regions are South East and London, accounting for 25% of UK’s total together, followed by West Midlands (10.6%) and North West (9.1%).
Over time, the value of embodied services value has experienced a modest decline in most regions between 2011 in 2014/15, but has generally picked up considerably in the two years leading up to 2017. The two most notable exceptions to this pattern are the West Midlands and Northern Ireland, respectively, as both regions exhibit a strong and continuous growth in mode 5 exports over the entire period.

Manufacturing export statistics by region—published by HMRC—offer the split between EU and non-EU destination. Under the assumption that there is no structural difference for a given manufacturing product across alternative destinations, we can compute regions and nations’ domestic mode 5 services exports directed towards EU and non-EU countries, respectively. The estimates thus derived reflect both the underlying value of trade with each destination as well as each region’s sectoral specialisation in terms of manufacturing exports.
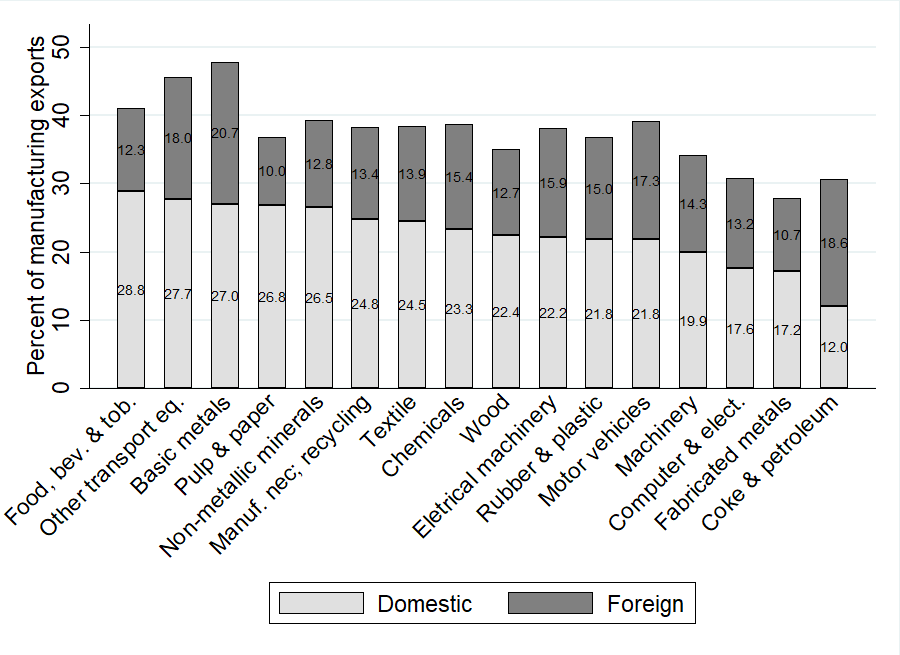
By and large, most UK regions export similar amounts of mode 5 services inputs to EU and non-EU destinations in 2017 (Figure 2). The two exceptions are London and West Midlands, i.e. the second and third largest mode 5 exports, which both export slightly more services via mode 5 to non-EU destinations. The converse is true for Wales, Yorkshire and the North East, which are more oriented towards EU markets.
Source: authors’ calculation based on TiVA and HMRC data.
The market orientation of mode 5 services exports is driven by a mix of distance elasticities, comparative advantages and barriers to trade of the manufacturing products in which the services are embodied. For instance, chemical products—which is the largest single manufacturing sector by export value—is relatively more oriented to the European market, which presumably reflects the close alignment with the EU Single Market in this highly regulated sector. The same is true for ‘Food, beverages and tobacco.’
The relatively even distribution across destinations of mode 5 services exports shows that there is not one region that would be overly reliant on EU markets and would, therefore, be particularly exposed to frictions induced by Brexit. At the same time, however, there is also no region that would appear to be insulated from Brexit ramifications. Some might prefer the conclusion that “the glass is half full” whereas others might say “the glass is half empty.” In any event, the fact is that all regions and nations engage in exporting services embodied in manufacturing products to a considerable extent, and so the ripple effects will be felt throughout the entire UK. It should also be noted that mode 5 exports used to be oriented more towards the EU, especially prior to the financial crisis. Considering that many EU economies experienced a longer recession compared to other non‑EU countries, the fairly even split between EU/non-EU destinations could be a temporary phenomenon associated with the fallout of the financial crisis.
Apart from their EU orientation, there are distinct differences across UK regions in terms of sectoral specialisation, i.e. the kind of manufacturing products that absorb services inputs. Nationally by far the largest value of embodied services is used in chemical products (£18bn in 2017); correspondingly, the two biggest mode 5 services exporting regions—the South East and London respectively—provide the most services to the chemical industry (Figure 3, upper panels). At the same time, Transport Equipment is the largest ‘vehicle’ of indirect services exports by a wide margin in the West Midlands because of the prominent location of the automotive industry there, and in Scotland a third of the region’s mode 5 services exports go to the Food and Beverages industry (Figure 3, lower panels). These spatial differences in local economic services activity can be informative about the potential impact on individual regions of specific sectoral provisions in the future UK-EU trade agreement or of trade deals with third countries that the UK hopes to conclude post-Brexit.


Source: authors’ calculation based upon TiVA and HMRC data.
The previous sections described features of the evolution of domestic services value added in manufacturing exports across UK regions; we now turn our attention to the other component of mode 5 services exports, namely the foreign services value added in UK manufacturing exports. In the value chain literature, such usage of foreign value added is referred to as ‘backward linkages.’ The share of imported services value added has been rising in the UK for the majority of manufacturing sectors, and particularly vigorously over the 2006-12 period. Services imported from abroad made up 11.2% in 1995 but rose to 16.5% by 2012 on average for all manufactures, based upon TiVA data. The same upward trend characterises the total foreign value added embedded in UK’s manufactures exports. The rise of both measures—the share of foreign goods and services embodied in UK exports—can be interpreted as reflecting ongoing production fragmentation (Timmer et al., 2014). In a nutshell, the UK economy has become ever more integrated internationally over the past two decades.
In fact, every single UK region exhibits an increase in international integration thus measured of 3-5 percentage points. Whilst it is notable that all regions participate in this kind of economic globalisation, those in the North (North East, Yorkshire and Humber, and North West) show the strongest increase in foreign services embodied in their manufacturing exports since 2000.
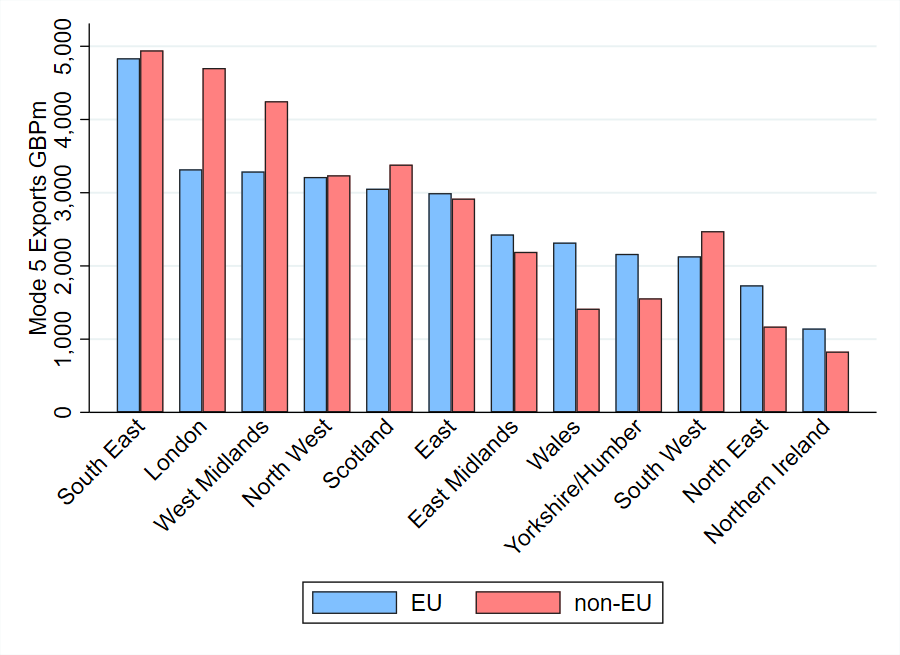
Yet the speed by which the share of foreign mode 5 services exports grow differs across regions, and it is interesting to note a positive correlation between the growth rate of manufacturing exports and the rising share of foreign services value added across regions (Figure 4)[5]. What we observe is that the regions that engaged more intensively with international inputs suppliers have seen their exports increase more rapidly. Clearly, this positive association may partly reflect an accounting identity to the extent that, ceteris paribus, more foreign inputs automatically increase the value of exports. However, the accounting relationship is unlikely to drive the observed association because of the magnitudes involved. For instance, consider London or the East Midlands, for which a 4 percentage point increase in foreign services value added is associated with an overall growth in manufacturing exports of about 40% over the period 2000-14. The North East, a small but open region, increased the use of foreign services by 5 percentage points and saw the value of its manufacturing exports grow by more than 80% over the same period. This is quite plausible against the backdrop of the North East being a major exporter in the automotive sector, an industry that features one of the world’s most internationally integrated value chains.
The same positive correlation across regions holds for total foreign value added in manufacturing exports, i.e. comprising foreign goods and services. As such, the observed correlation makes a general point about vertical integration and the reaping the benefits of globalisation insofar as manufacturing export growth is regarded as a desirable outcome. Of course, we do not know whether foreign services are driving this export success in a causal sense, but at a minimum, the evidence presented here highlights the salience of services for goods exports, and the integral role of foreign services in particular, i.e. international integration, for export success.
Source: authors’ calculation based upon TiVA and HMRC data.
The more intense use of foreign services inputs is also associated with more openness at the regional level. It might well be the case that economically more prosperous regions record higher export growth, but this should leave openness—defined as a region’s share of manufacturing exports over gross value added (GVA), roughly unchanged.[6] Instead, spatially detailed analysis suggests that the secular trend of embodying more and more foreign services over the 2000-14 period is associated with a higher share of exports relative to a region’s GVA. Put differently, the composition of value added is related to the degree of openness (Figure 5).
In Figure 5, each observation (dot) is a region in time, and the shading of markers indicates the passage of time: the lightest grey for initial years which intensifies to black in the run up to 2014. Red dots indicate the financial crisis year of 2009.[7] Again, part of the positive correlation could arise because using more foreign services automatically raises the value of exports whilst leaving regional GVA unchanged. Yet the association is much steeper than could be warranted by such an accounting identity. In terms of the underlying economic forces at work, it is plausible that more manufacturing exports and higher openness drive up the demand for foreign services, thereby increasing vertical integration, which may potentially reinvigorate exports success.
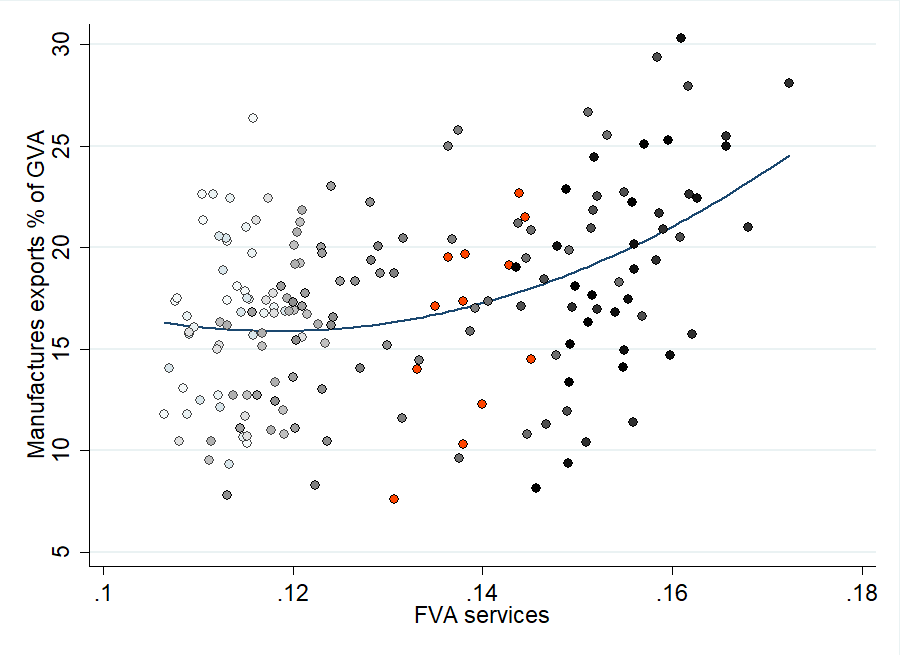
Source: authors’ calculation based upon TiVA, ONS and HMRC data.
Finally, we turn to the industry perspective and look at the evolution over time of mode 5 exports of foreign services by destination. Figure 6 depicts the Chemical Industry since it is one of the largest users of foreign services. As before, the intensity of colours represents the passage of time, and blue dots represent exports to the EU whereas those in red are for non-EU destinations. In the case of chemicals, the EU is a more important destination than all other non-EU markets combined. Presumably, the split is driven by harmonisation of sector-specific regulation, the absence of tariffs, and proximity. As such, Figure 6 reflects the fact that the Single Market should be most beneficial for trade in products that are regulation-intensive, which arguably is the case for chemicals. By contrast, Machinery products are shipped predominantly to non-EU destinations (Figure 7). Generally, though, the share of foreign services value added often rises over time when export growth is buoyant, lending further support to the beneficial impact of international integration.

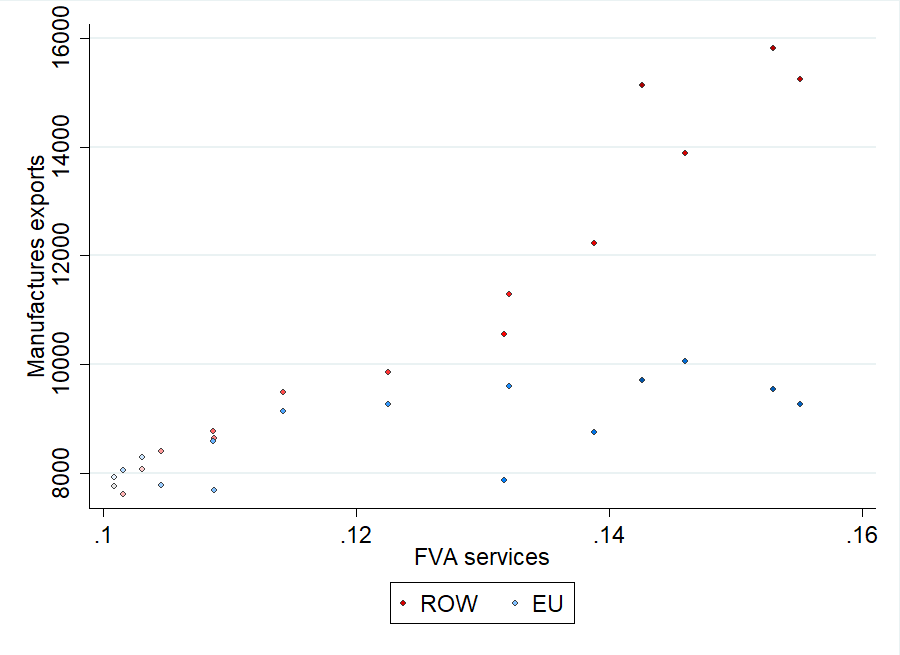
Source: authors’ calculation based upon TiVA, ONS and HMRC data.
Services inputs embodied in manufacturing exports constitute an important but under-appreciated kind of services exports, so-called mode 5 services trade. This Briefing Paper provides the first estimates of mode 5 services trade disaggregated by UK region and industry, respectively, and over time. Domestic services value added in manufacturing exports alone amounted to over £70 billion in 2017. These services play an integral role in the competitiveness of UK manufacturing exports. Since these services are produced locally, changes in the trading environment for manufactures have direct implications for domestic employment in services sectors. The impact of Brexit, via the future UK-EU trade agreement as well as potential future third country Free Trade Agreements (FTAs) will likely play out along sector lines and will, therefore, present different challenges and gains for different industries. Because of the servicification of manufacturing sectors, policies on goods trade will have an impact on service sectors too. Our figures show which regions export services in which industries and to which destinations, thus enabling a sensitivity analysis for alternative Brexit scenarios for spatially disaggregated areas.
By contrast, foreign services embodied in UK manufacturing exports are not linked to domestic jobs; instead, this kind of mode 5 trade reflects the degree of international integration via backward linkages. Thus, it is informative about the extent to which regions have participated in, and benefitted from, globalisation. We find that those regions that have come to rely more on foreign services inputs have seen an above-average growth rate of their manufacturing exports. These regions have also become more open, i.e. export more relative to local production.
The description of domestic and foreign services inputs in manufacturing exports, respectively, helps in gauging the exposure of regions and nations with regard to Brexit-induced changes in trading conditions. A number of simplifying assumptions are required to derive figures as detailed and disaggregated as presented here. In addition, two principal caveats are in order. First, trade in value added statistics do not account for ownership information in services sectors. That is, the subsidiary of a French bank that is locally incorporated in London will count as a domestic UK entity for the purposes of recording value added if it provided financing or other services to a UK car maker, which then ships its cars abroad. Put differently, the four freedoms of the Single Market (in this case the movement of capital) may facilitate the provision of services in the UK and potentially mode 5 services exports as well in ways that are not apparent from TiVA statistics. If these freedoms fell away, or the attractiveness of the UK for investment in services sectors declined, there would be ramifications for the local availability and variety of services inputs.
Second, estimates of mode 5 services exports, overall or by region, may provide a first indication of what is at risk in a services-oriented economy post-Brexit. But the implications of breaking away from the Single Market are potentially much more far-reaching for services.[8] The provision of services, both of domestic or foreign provenance, may rely on broader policies and regulations that cut across all sectors; for instance, cross-border data flows or the protection of intellectual property. It is not inconceivable that changes brought about by Brexit in these policy realms have consequences for mode 5 services trade as well.
Antimiani, Alessandro and Lucian Cernat (2018), “Liberalizing Global Trade in Mode 5 Services: How Much Is It Worth?” Journal of World Trade 52(1), pp. 65–83.
Timmer, Marcel P., Abdul Azeez Erumban, Bart Los, Robert Stehrer, and Gaaitzen J. de Vries (2014), “Slicing Up Global Value Chains” Journal of Economic Perspectives 28(2), pp. 99-118.
[1] These four modes are “direct cross-border services trade” (mode 1), “consumption abroad” (mode 2), “sales through establishment of commercial presence abroad” (mode 3), and the temporary “presence of natural persons as service suppliers abroad” (mode 4).
[2] As of July 2018, the OECD – WTO Trade in Value-Added dataset stops in 2011, although “nowcast estimates” are available for years 2012-14. We employ TiVA’s nowcast statistics to compute mode 5 values for 2012-14, and we apply the latest available services value added share as of 2014 to manufacturing exports of years 2015-17 so as to be able to compute mode 5 exports for the most recent years as well.
[3] Because international trade is recorded on a product basis whereas the TiVA database provides information on an industry basis, various concordances have to be applied in order to eventually match trade data with TiVA information.
[4] Compared to the regional estimates of ‘mode 5’ services trade presented in UKTPO Briefing Paper 14, the computation of embodied services value added has been refined by taking into account each manufacturing industry’s individual share of embodied services, rather than an average share across all industries. Since UK regions specialise in different manufacturing industries, this allows us to derive more precise estimates of regional ‘mode 5’ values that reflect a specific region’s manufacturing export pattern.
[5] We believe that this is the first time that estimates of foreign mode 5 exports have been calculated for individual UK regions.
[6] Because GVA and trade are measured in different terms, the actual values of the ratio depicted should not be taken too literally; that said, the variation across regions in this ratio should be roughly indicative of openness as long as productivity differences for tradable goods are not too stark.
[7] Interestingly, this year is not an outlier, which testifies to the crisis resilience of services trade.
[8] See UKTPO Briefing Papers No. 6 (“Services Trade in the UK: What is at Stake?”) and No. 18 (“Can CETA-Plus Solve the UK’s Services Problem?”).