
 16 October 2019
Julia Magntorn Garrett is a Research Officer in Economics at the University of Sussex and Fellow of the UK Trade Policy Observatory.
In March 2019, Theresa May’s Government published a set of ‘No deal’ tariffs, designed to apply for up to 12 months in the event that the UK left the EU without a deal. The UKTPO described them in a blog and a Briefing Paper. On October 8, the new Government published an updated ‘No deal’ tariff schedule. This blog outlines the main changes, and recalculates various statistics, on the basis of the new tariff proposal.
First, it is useful to reiterate what the UK’s current tariff structure looks like. Currently, all imports from the EU come in tariff-free. In addition, as a member of the EU, the UK has over 40 preferential trade agreements in place with around 70 countries, whose products are imported largely tariff-free, as are most products from developing countries that trade under the EU’s Generalised System of Preferences (GSP) or Everything But Arms (EBA) programmes. All in all, as specified in Table 1, currently around 87% of UK’s total imports come in to the UK tariff-free.
The ‘No deal’ tariff proposal would see the overall percentage of tariff-free imports remain roughly unchanged. However, the distribution between EU and Non-EU imports would change. A considerably larger proportion of the UK’s Non-EU imports would be tariff-free, but a smaller share of the UK’s imports from the EU would be tariff-free.
| Table 1: Percentage of the value of UK imports facing 0% tariffs under the current and the proposed UK ‘No Deal’ tariff schedules | |||
| Currently | UK ‘No deal’ tariff schedule | UK Bound Tariff Schedule | |
| Imports from non-EU countries | 72% | 95%1 | 60%2 |
| Imports from the EU | 100% | 81% | 32% |
| Overall | 87% | 88% | 46% |
| 1 Assumes zero tariffs on all UK imports from countries which have signed a continuity agreement with the UK, and for all imports from GSP/EBA countries. 2 Assumes zero tariffs on all UK imports from countries which have signed a continuity agreement with the UK, and assumes the tariff-free shares of imports from GSP/EBA countries remain unchanged from their current (2016) level. |
|||
| Source: Current import shares: data from Eurostat. UK ‘No deal’ and Bound tariff shares: import data from HMRC, excluding any trade values that are undefined by tariff line. All values are based on 2017 trade data. | |||
Overall, the October tariff proposal replicates most of the March tariff schedule. As in March, the proposal would mean that, at the very detailed (8-digit) level, around 95% of all tariff lines would be zero, compared to around 26% currently (under the EU’s Most Favoured Nation (MFN) tariffs).
The UK’s simple average MFN tariff would be around 0.8% under the October ‘No deal’ proposal, slightly higher than the average under the March proposal (0.7%). The weighted average MFN tariff, based on total UK imports, would be around 1.6%. This compares with a simple average MFN tariff of around 7.7% and a weighted average MFN tariff of around 4.4% if the UK had applied EU’s MFN tariffs to all trade.[1] Thus, we see that the UK’s average MFN tariff, facing countries with which the UK does not have a preferential trade agreement, would be considerably lower under the ‘No deal’ proposal than the current MFN tariff.
However, we can also calculate the average weighted applied tariff, which takes into account any preferential tariffs that apply to certain countries, most notably the EU. This gives a weighted average of around 1.3% under the no-deal tariffs, compared to below 1% under the UK’s current applied average tariff.[2] So, when accounting for the fact that currently all imports from the EU are tariff-free, but under the ‘No deal’ proposal there would be tariffs on around 19% of the UK’s imports from the EU (making EU imports more costly), the average applied tariff under the ‘No deal’ proposal would be higher than the current level.
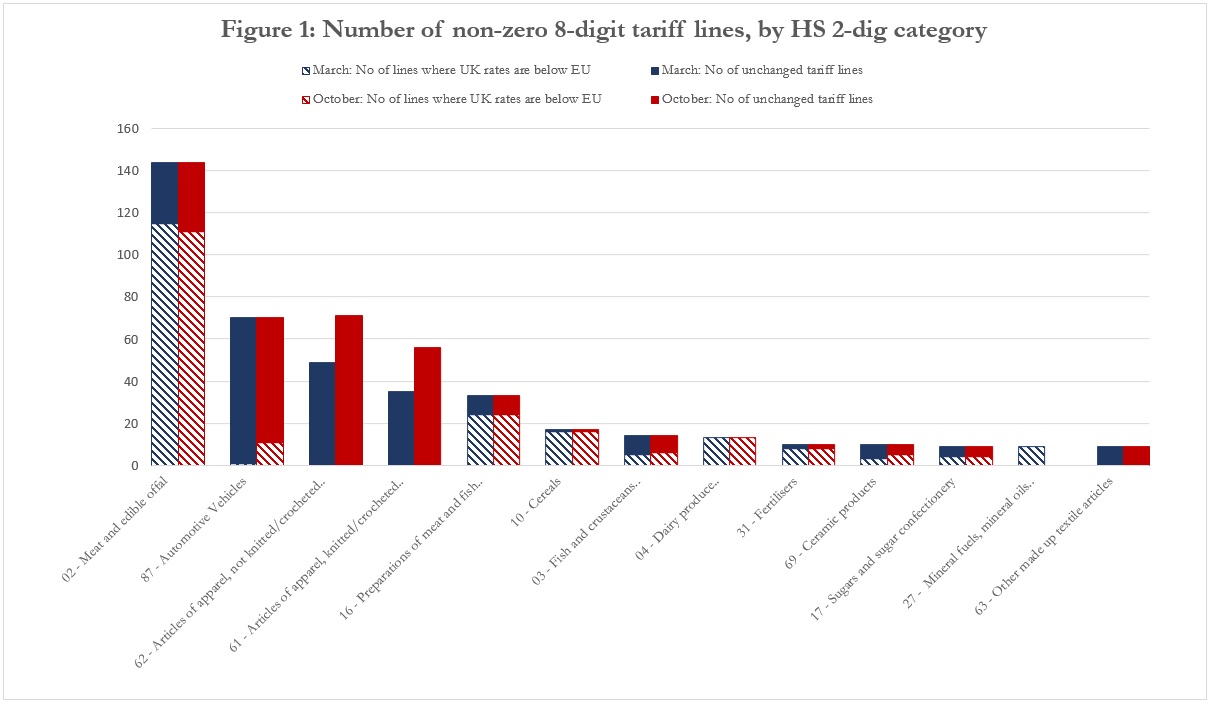
Figure 1 gives the number of remaining, non-zero, 8-digit tariff lines summarised into broad (HS 2-digit) sectors. The chart gives the 13 largest sectors in terms of remaining tariff lines, it excludes a further 15 HS 2-digit sectors which have only a few remaining positive tariffs. The blue columns are for the March proposal, whereas the red columns are for October. The striped parts of the columns indicate the number of remaining non-zero tariff lines that are lower than the current EU MFN tariff; the solid parts refer to cases where the UK has adopted the EU current MFN tariff.
The March and October tariffs are very similar. For example, the sector with the highest number of remaining tariffs is still the meat sector. However, in other sectors there are some significant changes:
1. In the automotive sector a number of tariffs, for vehicles transporting goods, have been reduced, from 22% to 10%, in the October proposal.
2. The October schedule contains tariffs for around 40 additional textile products, covering everything from women’s jackets and trousers, to baby clothes and men’s shorts. Most of these products would face tariffs of 12%.
3. A number of changes have been made to fuel and oil tariffs. The March proposal contained tariffs for a number of motor spirit products, within HS sector 27. These have been eliminated in the October schedule. On the other hand, the October schedule increases tariffs on some biodiesel products, within HS chapter 38.
4. Some further changes have been made, for example with respect to some ceramics, glass fibres, aluminium foil, beef and pork products.
Clearly, some of the changes in the October update were a result of representations made by business groups worried about the potential impact of the March tariffs. One example is the haulage industry, which expressed their concerns in March about the proposal to keep tariffs of 22% on HGVs, claiming that this would be damaging for an already struggling industry with small profit margins. As discussed, tariffs on some of these vehicles were subsequently reduced to 10% in the October update. Similarly, tariffs on bioethanol products were adjusted as a response to concerns about how the March tariffs would impact on UK refineries.
However, not all lobbies were able to head off liberalisations. The National Farmers Union expressed frustration that the October tariffs did not go further in protecting domestic farmers, and the ceramics industry also voiced concerns about the impact on domestic producers from removing most ceramics tariffs.
Other tariffs may have been changed out of practicality. According to the Government, the new tariffs on clothing products were applied with the aim of supporting preferences for developing countries, by reducing the scope for circumvention. For example, the March proposal had a 12% tariff on product 61072200 “Men’s or boys’ nightshirts and pyjamas of man-made fibres, knitted or crocheted (excluding vests and singlets)”, but a 0% tariff on product 61072900 “Men’s or boys’ nightshirts and pyjamas of textile materials, knitted or crocheted (excluding of cotton or man-made fibres, and vests and singlets)”. These products are so similar that it might have been possible for an exporter to re-engineer, or perhaps re-label, products so that they fall under product 61072900 rather than 61072200, thereby avoiding the 12% tariff. The October schedule addresses this issue by applying a 12% tariff on both of these products.
Whether or not these tariffs will actually come into force remains uncertain. However, since many of the changes in the October proposal were the result of lobbying by concerned industries it raises the question of whether they could have been avoided by a more extensive consultation process before the first set of ‘No deal’ tariffs was published. Constructing a tariff regime involves making sometimes difficult trade-offs between consumer and producer interests. As these tariffs are the first concrete glimpse we have of how an independent UK trade policy might be determined, it seems clear that a priority for the UK Government should be to devise a clear and equitable process for public consultations, including both producer industries and other affected parties.
[1] These averages are calculated at the 8-digit level. For the EU we use tariff data from UNCTAD TRAINS for 2017, including AVEs. Calculating the average at the 8-digit level yields higher results than if it is done at the HS 6-digit level, which would give a simple average EU MFN tariff of 5.61 and a weighted average of 3.13.
[2] This calculation assumes zero tariffs on all UK imports from countries which have signed a continuity agreement with the UK, and for all imports from GSP/EBA countries. In addition, for the UK’s current applied tariffs, we take into account that all of the UK’s imports from the EU are currently tariff-free.
Disclaimer:
The opinions expressed in this blog are those of the author alone and do not necessarily represent the opinions of the University of Sussex or UK Trade Policy Observatory.
Republishing guidelines:
The UK Trade Policy Observatory believes in the free flow of information and encourages readers to cite our materials, providing due acknowledgement. For online use, this should be a link to the original resource on our website. We do not publish under a Creative Commons license. This means you CANNOT republish our articles online or in print for free.