

 20 April 2021.
Michael Gasiorek is Professor of Economics and Director of the UKTPO. Yohannes Ayele is Research Fellow in the Economics of Brexit at the University of Sussex and Fellow of the UKTPO.
A decline in trade with the EU was expected following the coming into force of the Trade and Cooperation Agreement between the UK and the EU on the 1st of January. Nevertheless, when the UK January trade figures were released in early March, almost unanimously commentators were surprised by the extent of the decline. We now have the data for February and so in this blog we update the numbers and discuss their significance.
The February 2021 trade data shows some signs of recovery from the January 2021 slump, but trade is still significantly lower than that observed in the previous years. This can be seen in Figure 1 below. In February 2021, the UK’s export to the world were down by 13% (relative to the average of February 2018-20), whereas the January figures showed a decline of 25%. Exports to the EU were down by just over 17% in February, in comparison to over 44% January. The decline in exports to the EU is around twice the decline in trade to non-EU countries.
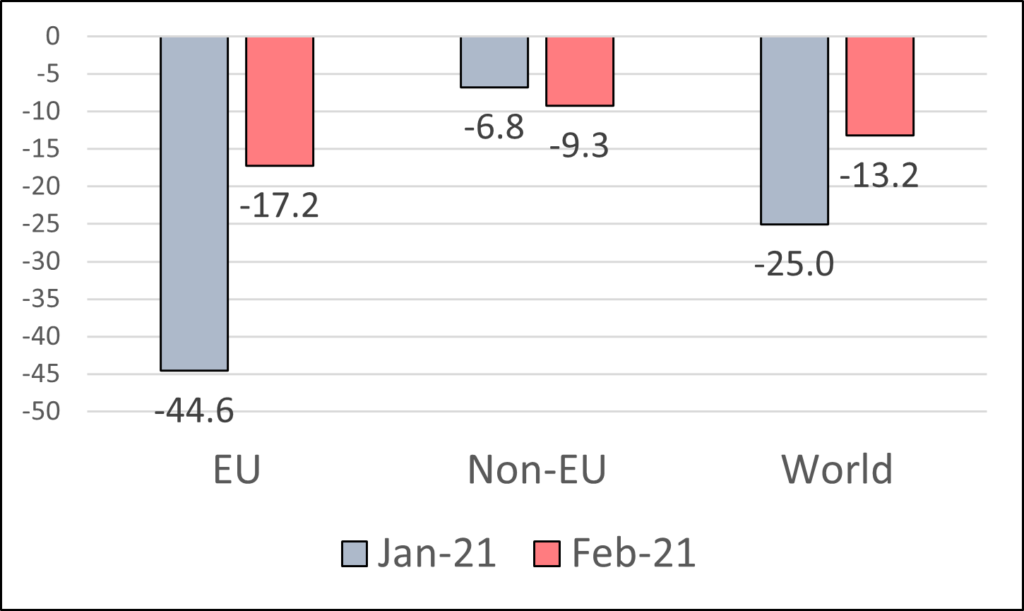
What this shows is that there has indeed been a considerable rebound in February relative to January – which is surely good news. Nevertheless, a decline in exports of over 17% remains substantial, and if the January figures been at this level, much would have been made of this level of fall in trade.
Figure 2 provides the same analysis, but this time for imports. While there is again some rebound in the decline in imports, this is much smaller than with regard to exports. Hence, imports from the EU were down by nearly 26% in January, and were still down by over 19% in February. In contrast imports from non-EU countries recovered sharply in February and were nearly 23% higher than the corresponding months over 2018-20.
If we combine the first two months and look at the cumulative changes, the UK’s export to the world, EU and Non-EU were down by 19.3%, 31%, and 8%, respectively. Similarly, in the same period, the UK’s import from the world and the EU were down by 7.6% and 22.6%, respectively, while imports from non-EU countries were up by 9%.
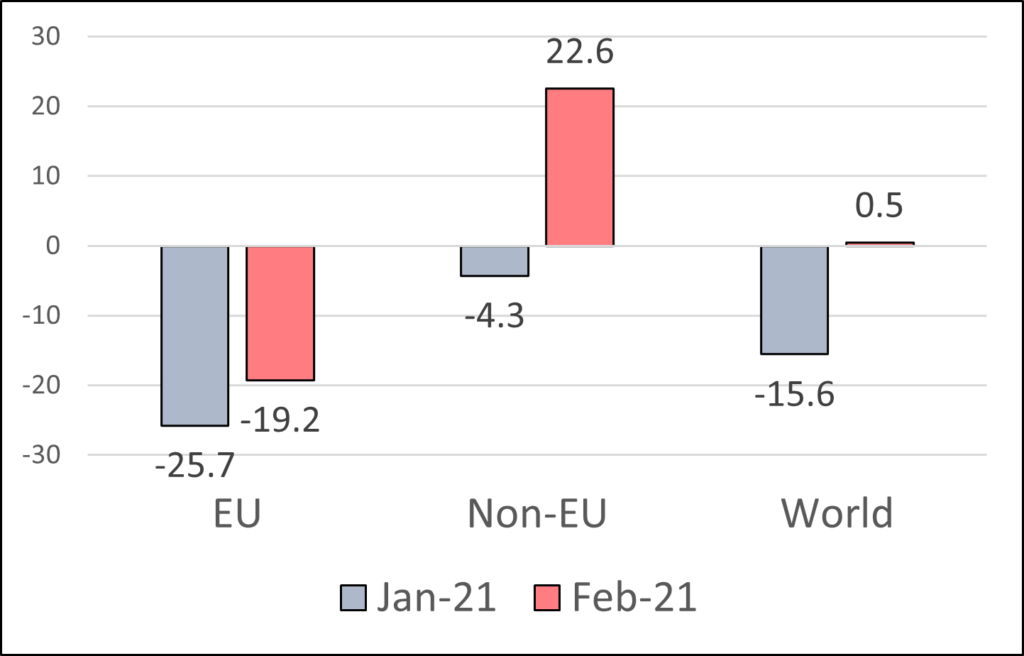
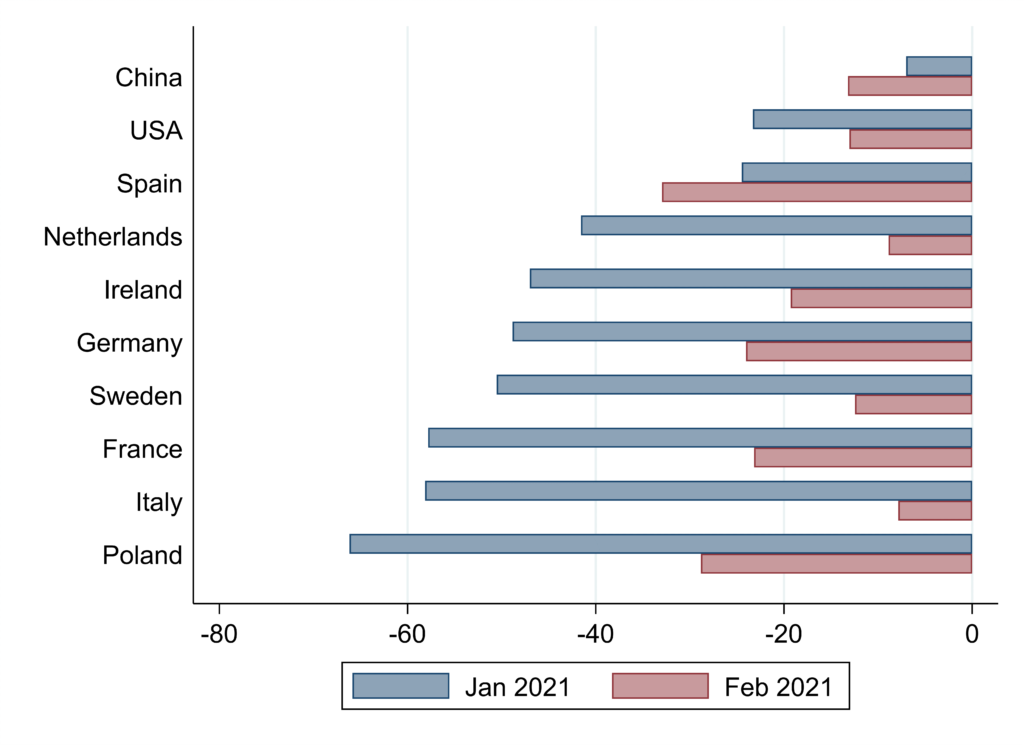
Figure 3 decomposes the changes in exports by principal EU and non-EU destinations. In line with the aggregate trade recovery, exports to major trading partners partially recovered from the January slump, except for to China and Spain. Despite February’s improvement, the UK’s exports to these major trading partners is still significantly lower compared with the last three years’ average. For example, UK exports to Germany and France in February is down by 24% and 23% while imports for the same countries and the same period is down by 28.9% and 37%, respectively.
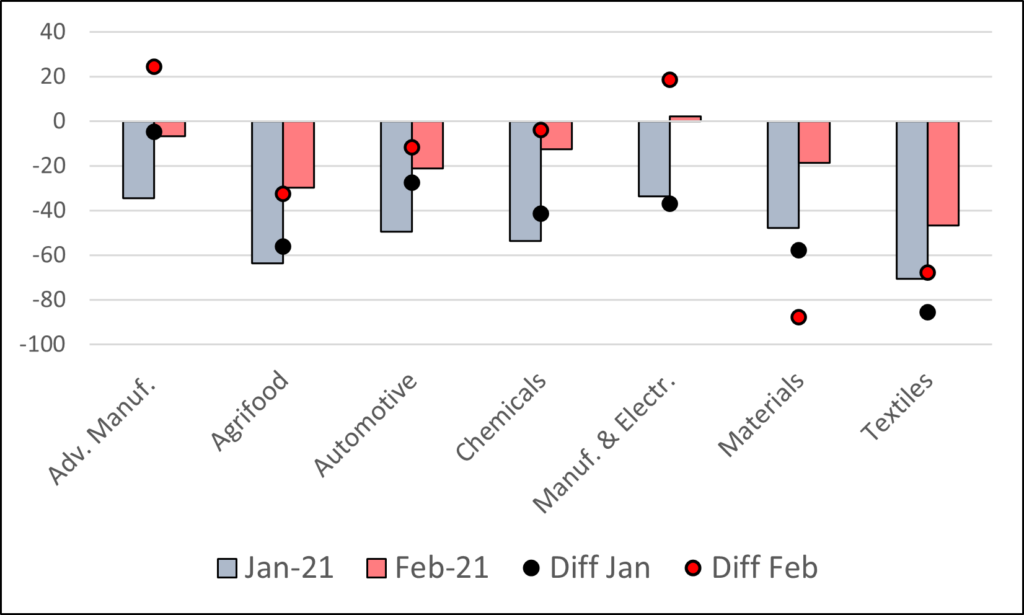
While looking at total trade levels is important, it also hides the heterogeneous impact of Brexit on different sectors. Figure 4 depicts the changes in UK exports to the EU in February and January 2021 for seven broad sectoral groupings. Of course, the decline in exports will have also been driven by COVID induced effects. However, one way of trying to ascertain the relative importance of the ‘Brexit’ effect is to compare the change in exports to the EU, with the change in exports to non-EU countries. That comparison is given by the dots in Figure 4 which give the difference in the change in trade between the EU and non-EU. Where the dot is negative this indicates that exports to the EU declined by more than to the non-EU, and conversely where the dot is positive trade to the EU performed better.
Hence, if we take textiles, we see that in February 2021 UK exports to the EU were 46.5% lower than the average of Feb 2018-20, and that this was 67 percentage points worse than exports to non-EU countries. And this is because exports of textiles to non-EU countries rose by by over 20% in February.
So what do we learn from this figure? Overall, there are signs of recovery for all sectors from the January slump and with some sectoral variation. In almost all cases the level of exports to the is EU substantially lower than the average of the last three years for the same month. It is slightly higher in ‘manufacturing and electronics’ where exports to the EU performed better than to non-EU countries. Textile and agrifood sectors’ exports to the EU in February are the most significantly lower – down by 46.5% and 29.6% respectively. Taking January and February combined, exports to the EU in these two sectors were down by 46.86% and 59.1% respectively. Relative to exports to non-EU countries, two sectors appear to have done better in February – ‘advanced manufacturing’ and ‘manufacturing and electronics’.
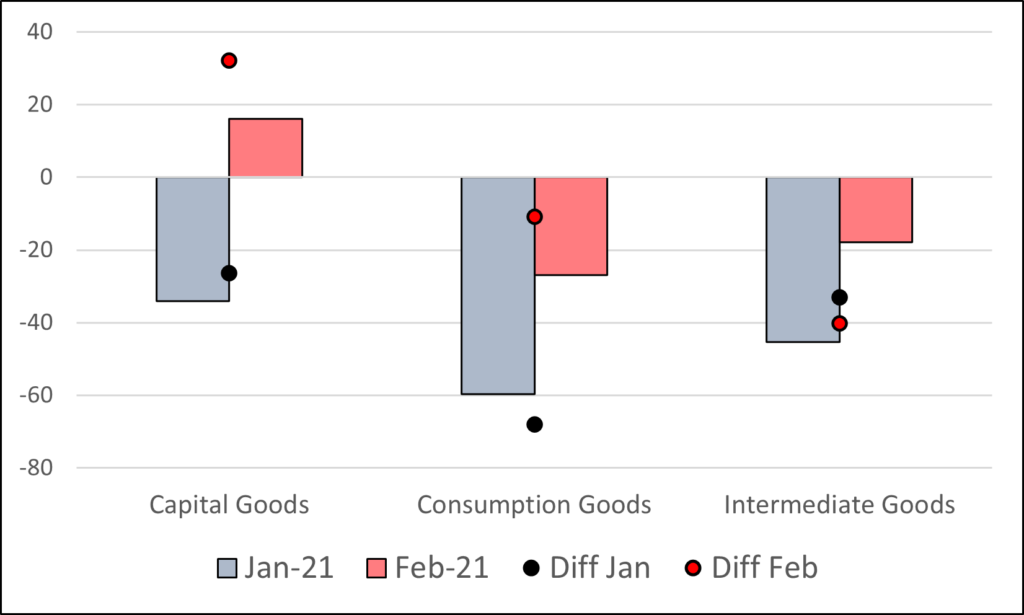
Finally, we consider the change in UK trade where we distinguish between capital goods, consumption goods and intermediate goods. Figures 5 and 6 show the changes in trade with the EU, and also relative to the changes with non-EU countries.
With regard to exports, Figure 5 shows that it was particularly UK exports of capital goods to the EU that rebounded and performed better than the exports of capital goods to non-EU countries in February. In contrast, exports of consumption goods were nearly 27% lower, and intermediate goods nearly 18%. In both of these categories the change in exports to the EU was worse than the change in exports to non-EU countries (by 11 and 40 percentage points respectively). If we take the combined January and February changes, UK exports of consumption goods to the EU were down by 43.3%, followed by exports of intermediate goods by 32.1% and then exports of capital goods by 9.16%.
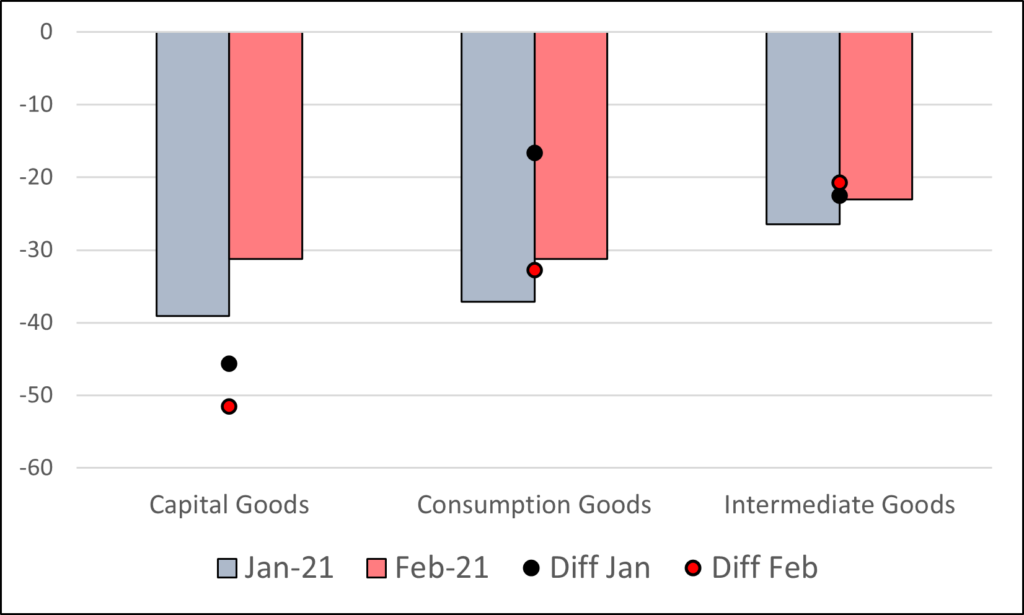
The story on the import side appears even worse. As we saw earlier there is a smaller rebound in imports from the EU, but with imports still down by more than 30% for both capital goods and consumption goods, and by over 20% for intermediate goods. In all three categories the decline in imports from the EU was significantly more than the change in trade from non-EU countries.
In summary, it has to be recognised that all these changes are early indications and there is naturally a high degree of fluctuation in monthly trade statistics, so one should be cautious in drawing conclusions. While there has been some rebound in February, nevertheless, there appears clear evidence of a continuing negative significant impact from leaving the EU Customs Union and Single Market on UK trade with the EU. This is particularly pronounced for some sectors (agrifood and textiles), and to date there is much less evidence of a rebound in imports from the EU which are also considerably lower. We will continue to update these numbers in the months to come.
Disclaimer:
The opinions expressed in this blog are those of the author alone and do not necessarily represent the opinions of the University of Sussex or UK Trade Policy Observatory.
Republishing guidelines:
The UK Trade Policy Observatory believes in the free flow of information and encourages readers to cite our materials, providing due acknowledgement. For online use, this should be a link to the original resource on our website. We do not publish under a Creative Commons license. This means you CANNOT republish our articles online or in print for free.
[…] volumes fell sharply in January before rebounding in February. But the UK Trade Policy Observatory at the University of Sussex says UK exports to the EU were still down by 17.2% in February compared to an average of February […]
[…] volumes fell sharply in January before rebounding in February. But the UK Trade Policy Observatory at the University of Sussex says UK exports to the EU were still down by 17.2% in February compared to an average of February […]
[…] volumes fell sharply in January before rebounding in February. But the UK Trade Policy Observatory at the University of Sussex says UK exports to the EU were still down by 17.2% in February compared to an average of February […]
[…] volumes fell sharply in January before rebounding in February. But the UK Trade Policy Observatory at the University of Sussex says UK exports to the EU were still down by 17.2% in February compared to an average of February […]
[…] volumes fell sharply in January before rebounding in February. But the UK Trade Policy Observatory at the University of Sussex says UK exports to the EU were still down by 17.2% in February compared to an average of February […]
[…] volumes fell sharply in January before rebounding in February. But the UK Trade Policy Observatory at the University of Sussex says UK exports to the EU were still down by 17.2% in February compared to an average of February […]
[…] volumes fell sharply in January before rebounding in February. But the UK Trade Policy Observatory at the University of Sussex says UK exports to the EU were still down by 17.2% in February compared to an average of February […]
[…] volumes fell sharply in January before rebounding in February. But the UK Trade Policy Observatory at the University of Sussex says UK exports to the EU were still down by 17.2% in February compared to an average of February […]
[…] volumes fell sharply in January before rebounding in February. But the UK Trade Policy Observatory at the University of Sussex says UK exports to the EU were still down by 17.2% in February compared to an average of February […]
[…] volumes fell sharply in January before rebounding in February. But the UK Trade Policy Observatory at the University of Sussex says UK exports to the EU were still down by 17.2% in February compared to an average of February […]
[…] marked by shorter, sharper fluctuations in trade flows. More recently, UK exports to the EU were down markedly in the first months of 2021—and not simply because of the COVID-19 […]
[…] marked by shorter, sharper fluctuations in trade flows. More recently, UK exports to the EU were down markedly in the first months of 2021—and not simply because of the COVID-19 […]
An excellent and clear analysis but please make it clear that the figures only refer to trade in physical goods and does not include services.
Do you prepare a similiar analysis for export and import of services ?.
Do the export figures to the rest of the world include non – monetary gold sales ?.
Finally do you produce this analysis on a regular monthly basis as it would be most helpful.
[…] commerce with the European Union has slumped this yr and the meals business and textile sectors, specifically, have complained that […]
[…] trade with the European Union has slumped this year and the food industry and textile sectors, in particular, have complained […]
[…] trade with the European Union has slumped this year, and the food industry and textile sectors, in particular, have complained […]
[…] trade with the European Union has slumped this year, and the food industry and textile sectors, in particular, have complained […]