

 16 June 2021
Michael Gasiorek is Professor of Economics and Director of the UK Trade Policy Observatory at the University of Sussex. Guillermo Larbalestier is Research Assistant in International Trade at the University of Sussex and Fellow of the UKTPO.
Indications of a trade deal between the UK and Australia first surfaced soon after the Brexit referendum. This week it was announced that the two nations had agreed on the broad terms of the deal. The news was accompanied by images of PM Boris Johnson and his Australian counterpart, Scott Morrison, bumping elbows (the new handshake, if you will) and exchanging chocolate bars over baskets of British and Australian products.
The deal has significance for several reasons. First, it is the first trade deal outside the EU that was designed from scratch. So far, UK trade agreements with other non-EU countries have been “continuity agreements” that were almost entirely based on pre-existing deals between the EU and the other nations (we include UK-Japan as de facto in this category). Secondly, it signifies the UK’s continued commitment to liberalising and opening trade, particularly with those countries with shared values, as part of its post-Brexit and Global Britain campaign.
The true costs and benefits of the deal will take some time to materialise and it is too early to provide a full assessment, if nothing else, given that the full text of the agreement has not yet been agreed let alone released. Nevertheless, in this blog, we provide a brief overview of the potential significance of the Free Trade Agreement (FTA) on various aspects and sectors of the UK and Australian economies.
The aggregate economic significance of the deal is small. This is because of:
In total trade value (i.e., goods and services), Australia is the 14th most import destination of UK exports, or 7th excluding EU members; whereas it is the 24th most important supplier of UK imports, or 13th among non-EU countries. [1]
Table 1 shows that in 2019 the UK’s goods exports to Australia amounted to £4.6 billion, or 1.3% of the UK’s total goods exports. In comparison, exports of services were £7.3 billion, or 2.3% of the UK’s total exports of services. Conversely, the value of goods imports was £3.9 billion, or 1.1%, whereas imports of services equated to £2.6 billion, or 0.8% of the UK’s total imports of services.
Modelling that we have undertaken of the deal on 148 traded industries / sectors results in a simulated increase in output for the UK of 0.07% and for Australia an increase of 0.16%. These are very small numbers. The government’s own estimates, which are based on the whole economy (as opposed to the parts of the economy that are traded) suggest a 0.02% increase for UK GDP. Our simulations suggest that the UK may see an increase in exports of 0.35%, while Australia’s exports are simulated to increase by 2.2%, and these numbers are similar to the government estimates. So, we see a bigger positive effect for Australia than for the UK. This does not mean that Australia negotiated a better deal – but is based on the underlying structures of trade, production and tariffs.
| £ million | |||||
| Exports | Imports | Balance | |||
| Goods | 4,666 | 1.25% | 3,929 | 1.05% | 737 |
| Services | 7,327 | 2.31% | 2,602 | 0.82% | 4,725 |
| Total | 11,993 | 1.74% | 6,531 | 0.95% | 5,462 |
| Source: ONS Pink Book 20202 Chapter 9; shares are of World Total, 2019; calculations authors’ own. | |||||
There are other reasons why a UK-Australia deal may be meaningful and these are political. First, for the UK it is important to demonstrate its ability to sign and negotiate free trade agreements now that it has left the EU. Second, the UK’s desire to exert international influence is clear, as seen in the recent G7 summit, and it seems that the Indo-Pacific region is an important part of this strategy. A deal with Australia would probably help with the UK’s ambitions of joining the Comprehensive and Progressive Agreement for Trans-Pacific Partnership (CPTPP) as part of the UK’s geo-strategic shift to the region.
Recently, much attention has been devoted to the potential impact that the deal may have on UK farmers and this discontent has been one of the most vocal arguments against the trade deal. The main threat to UK farmers is from cheap imports from Australia where beef, among other agricultural products, is produced at lower costs and uses efficiency-enhancing processes such as hormone treatment, which is currently banned in the UK. The agreement, however, has a long phase-in period for beef (ten years), and some safeguard clauses and the majority of UK beef is supplied by domestic producers and EU partners. It is unlikely therefore that the deal per se will have a major impact on UK farmers.
However, liberalising agriculture may set a precedent on future agreements (for example with the US) and it remains to be seen quite what has been agreed about food standards. Allowing the import of foodstuffs with different standards to those of the EU, may well cause further difficulties for the operation of the Northern Ireland protocol. If the UK-Australia deal precluded even a temporary sanitary and phytosanitary measures deal with the EU then such an agreement could reduce UK agricultural trade with the EU more than it increased it with Australia.
Other sectors are more economically significant in the trade between the UK and Australia. For UK exports to Australia, Table 2 looks at the top 10 sectors (HS 2-digit codes) based on the average 2017-2019 annual export values (Column 1). The adjacent column in the table indicates the share that the industry represents in total UK exports to Australia, while Column 3 in the table indicates the share of UK exports going to Australia relative UK export going to the rest-of-the-world. Column 4 shows the share of UK exports in Australia’s total imports. The last column contains the (simple) average applied tariff levied by Australia on imports from the UK.
On aggregate, the top 10 industries represent almost 72% of the UK’s total exports to Australia, which is equal to £3.2 billion. The top three sectors alone, (vehicle, machinery and pharmaceutical products) account for almost 60% of this share. But, for each one of these sectors, only 1.2%-2.1% of exports are destined to Australia relative to the rest-of-the-world and the tariff they face is only about 3%. When considering the share of UK exports in Australia’s imports we find that the top 5 sectors generally mirror what we saw in Column (2), but that that the shares of the top 10 products sum to just below 50%. Once again, at face value, this depicts the relatively small economic significance of the Australian market for British exports. On the Australian import side, we see that it is only vehicles that account for more than 10% of Australian vehicle imports, and another three sectors account for more than 5% of Australian imports.
The highest tariffs faced by British exports in the Australian market are for cheese products (5-25%). Whisky products, that have received some media attention, have tariff rates of 5%.
| (1) | (2) | (3) | (4) | (5) | ||
| HS Code | Product Name | UK Exports
(million £) |
Share in UK exports to Aus | Share of UK exports going to Aus | Share of UK exports in Aus imports | Aus Tariffs |
| 87 | Vehicles – other than railway or tramway rolling stock | 858.32 | 19.5% | 2.1% | 16.7% | 3.2% |
| 84 | Machinery and mechanical appliances | 645.67 | 14.7% | 1.2% | 9.7% | 3.1% |
| 30 | Pharmaceutical products | 396.13 | 9.0% | 1.7% | 7.3% | 1.2% |
| 85 | Electrical machinery, equipment and parts thereof | 299.32 | 6.8% | 1.4% | 6.2% | 2.2% |
| 49 | Printed books, newspapers, pictures … | 254.52 | 5.8% | 8.9% | 4.5% | 1.8% |
| 90 | Optical, photographic, cinematographic, … | 226.54 | 5.2% | 1.6% | 1.2% | 0.6% |
| 22 | Beverages, spirits and vinegar | 179.32 | 4.1% | 2.3% | 1.1% | 3.9% |
| 39 | Plastics and articles thereof | 107.22 | 2.4% | 1.2% | 0.4% | 4.6% |
| 29 | Organic chemicals | 105.30 | 2.4% | 1.3% | 0.1% | 0.8% |
| 62 | Apparel and clothing accessories | 82.33 | 1.9% | 2.4% | 0.0% | 4.6% |
| Total | 3,154.66 | 71.8% | 47.0% | |||
| Source: UN COMTRADE and UNCTAD via WITS; Tariff rates represent Ad-valorem equivalents (AVEs). Values converted from USD to GBP using the average exchange rate for 2017-2019 (ONS.gov.uk) Calculations undertaken using the TradeSift software (www.tradesift.com). The shares in (2) are calculated as the total value of trade for an HS code divided by the total value of UK exports to Australia; in (3) they are calculated as the total value of exports to Australia for a given sector divided by the total exports of that sector to the world; (4) takes the total value of UK imports from Australia for a given sector and divides it by the total value of Australia’s imports from the UK for that sector. | ||||||
Table 3 considers the same information but for Australian exports to the UK. In this instance, we see that the top 10 industries amount to approximately £4.3 billion, or 90%, of Australia’s exports to the UK. This is strongly driven by the export of precious metals (HS 71) and, in particular, exports of gold (HS 710813), which in 2019 were equal to £6.38 billion and therefore drive the average value upwards. The average applied tariff levied by the UK on Australian imports for most of these products is low. The exceptions are for meat (HS 02, 23.6%), which indicate the degree of protection to the industry and in part explain UK farmers’ concerns about the deal. In fact, the highest tariff rates specified in the UK Global Tariff are all for meat products (2.1%-73.4%) and some sugar products.
| (1) | (2) | (3) | (4) | (5) | ||
| HS Code | Product Name | Exports
(million £) |
Share in Aus export to UK | Share of Aus exports going to UK | Share of Aus exports in UK imports | UKGT |
| 71 | Precious metals … | 3,238.45 | 59.6% | 25.4% | 57.8% | 0.5% |
| 78 | Lead and articles thereof | 239.14 | 6.2% | 40.6% | 6.9% | 0.0% |
| 22 | Beverages, spirits and vinegar | 218.22 | 5.7% | 11.7% | 6.2% | 4.8% |
| 90 | Optical, photographic, cinematographic, … | 190.85 | 4.7% | 7.8% | 4.0% | 0.3% |
| 27 | Mineral fuels, mineral oils … | 122.57 | 3.1% | 0.3% | 4.0% | 0.2% |
| 85 | Electrical machinery, equipment and parts thereof | 97.34 | 2.5% | 4.0% | 2.2% | 0.7% |
| 84 | Machinery and mechanical appliances | 85.38 | 2.2% | 2.4% | 2.3% | 0.5% |
| 30 | Pharmaceutical products | 81.46 | 2.1% | 3.5% | 1.9% | 0.0% |
| 02 | Meat and edible meat offal | 80.27 | 2.1% | 1.1% | 1.9% | 23.6% |
| 99 | Commodities not specified according to kind | 77.64 | 2.0% | 0.2% | 1.9% | n/a |
| Total | 4,431.33 | 90.3% | 89.1% | |||
| Source: UN COMTRADE and UNCTAD via WITS; Tariff rates represent Ad-valorem equivalents (AVEs). Values converted from USD to GBP using the average exchange rate for 2017-2019 (ONS.gov.uk). Calculations undertaken using the TradeSift software (www.tradesift.com). ). The shares in (2) are calculated as the total value of trade for an HS code divided by the total value of Australia’s exports to the UK; in (3) they are calculated as the total value of exports to UK for a given sector divided by the total exports of that sector to the world; (4) takes the total value of Australia’s imports from UK for a given sector and divides it by the total value of UK’s imports from Australia for that given product | ||||||
All in all, the full extent of trade liberalisation will be known once the details of the agreements and respective tariff schedules for each country are made available. On top of this, the FTA’s rules of origin protocol and cumulation scheme will also determine how complex it will be for British and Australian products to be granted the preferential access.[2]
We know, however, that all Australian tariffs are expected to be eliminated within five years, and tariffs on cars and whisky to be eliminated immediately. For the former, the tariff rates are already 0% for motorcycles, and are highest, 5%, for special purpose vehicles (HS 8703). For the latter, the tariff rates for whisky products currently stand at 5% (HS 2208). On the other hand, the UK will remove tariffs on 99 per cent of Australian goods as soon as the agreement is ratified, including wine (2.8%-10.2%, HS 2204) and grain milled rice (18%-23%, HS 1006). Tariffs will be kept in place for beef and sheep meat products over ten years, sugar products over eight years and dairy products over five years, all with tariff rate quotas (TRQs) in place during their respective transition periods.[3]
The services sector is of importance to both economies and the two countries have voiced their commitments to improving market access and fair competition. For professional services this includes establishing provisions on mutual recognition of professional qualifications; and for financial services an opportunity to address barriers and increase regulatory coherence. Moreover, the trade deal may enhance labour mobility and conditions of stay for business visitors, services suppliers and investors.
Figure 1 shows UK exports and imports to and from Australia by service type; the shares are calculated as the percentage of total exports and imports of services to and from Australia. These data show cross-border services trade on a balance of payments (BoP) basis and thus exclude foreign direct investment (FDI) values. The chart shows that a big portion of bilateral UK-Australia trade is accounted for by travel and transportation, which is driven by factors unlikely to be influenced by FTA provisions. Other important sectors are other business services, which is a mix of highly regulation intensive services and largely unregulated activities such as management consulting; and insurance services. It is worth noting the extreme asymmetry in insurance services exports against the trade balance of financial services. This may be indicative of UK offensive interests.
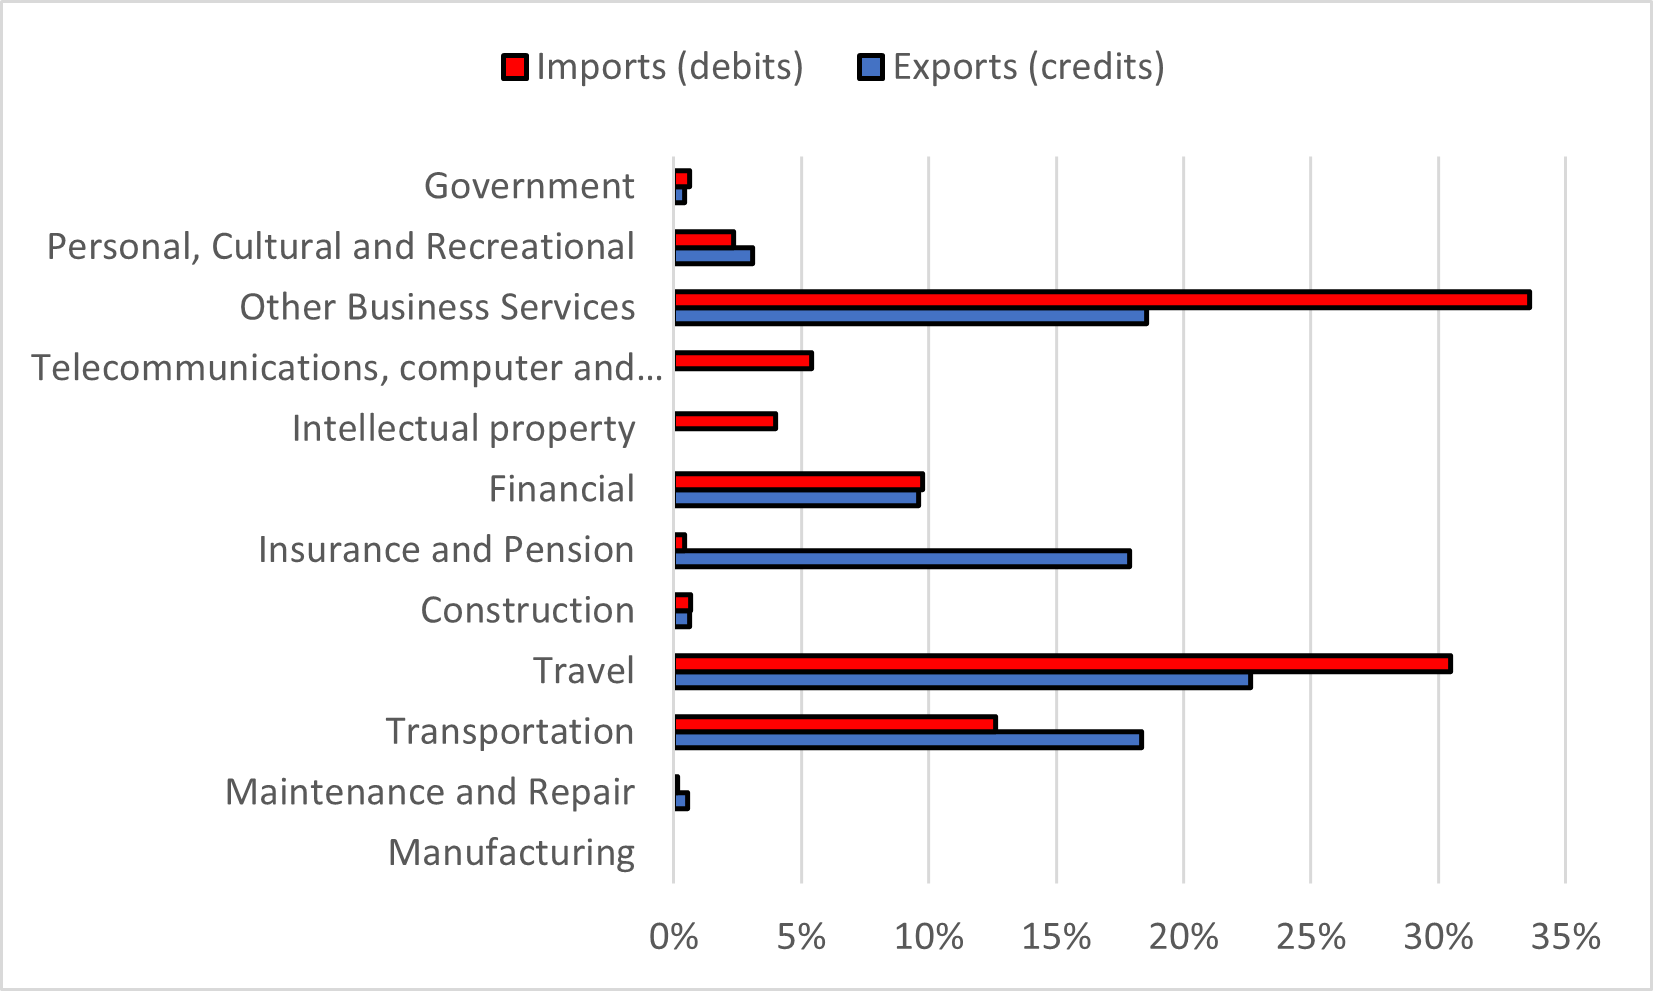
Source 1: ONS Pink Book 2020 Chapter 9; shares are of Australia total, 2019; calculations authors’ own. Zero values indicate that the data is nil or less than £500,000 or that they are disclosive values. Note that the total of the percentages does not sum to 100% due to unavailability of data or disclosive values.
What we know about digital trade from the UK’s strategic approach is that it is committed to securing “cutting-edge provisions” that facilitate the free flow of data, promote the protection for consumers online and ensure customs duties are not imposed on electronic transactions. What we do not know is what has been agreed (or indeed if there is more than a general agreement in principle), how coherent this is with what the UK has agreed in other agreements (EU, Japan), and how the need to regulate data flows has been balanced with consumer protection, cyber-security, and Intellectual Property Rights (IPR) issues. If IPR is negligible, trade in digital services could get a boost if IPR and investment provisions in the FTA turn out to be strong. As an additional note on this subject, Australia and Singapore have recently signed a Digital Economic Agreement (DEA) that the UK can use a benchmark to establish provisions in its own deal with Australia.
Other aspects that the trade deal is expected to cover include increasing two-way investment flows, promoting balanced rules on intellectual property rights, promoting opportunities for SMEs and on government procurement, and establishing strong legal and institutional frameworks to ensure the effective implementation of the FTA.[4]
On the one hand, agreeing a deal with Australia just over a year after leaving the EU can be seen as a success. However, there is more to trade deals than the date of agreement – there are many details still to be ironed out and this will take time. The agreement is not ready to be signed. Second, how ‘good’ a deal this is will depend on those details – be this about services, digital trade, public procurement or, rules of origin. All of which are currently lacking and all of this will play differently across different sectors and industries. Third, economically the deal remains a poor substitute for the trade lost with European markets due to Brexit. Despite historical and other cultural similarities, Australia remains a physically distant country. The success at this stage is thus political, elbow bumps and all.
[1] Source: ONS
[2] For an explanation about Rules of Origin and Cumulation Schemes, see We’re going to make them an offer they can refuse: Rules of origin and the UK-EU free trade agreement
[3] Statement by the Australian Minister for Trade, Tourism and Investment
[4] UK-Australia free trade agreement: the UK’s strategic approach and Australia-UK FTA negotiating aims and approach
Disclaimer:
The opinions expressed in this blog are those of the author alone and do not necessarily represent the opinions of the University of Sussex or UK Trade Policy Observatory.
Republishing guidelines:
The UK Trade Policy Observatory believes in the free flow of information and encourages readers to cite our materials, providing due acknowledgement. For online use, this should be a link to the original resource on our website. We do not publish under a Creative Commons license. This means you CANNOT republish our articles online or in print for free.
[…] of the UK’s utility to turn out to be an ASEAN Dialogue Partner in May, the announcement of a UK–Australia free trade agreement and the inauguration of the UK bid to turn out to be a member of the Comprehensive and Progressive […]
[…] of the UK’s utility to develop into an ASEAN Dialogue Partner in May, the announcement of a UK–Australia free trade agreement and the inauguration of the UK bid to develop into a member of the Comprehensive and Progressive […]
[…] the United Kingdom’s application to become an ASEAN Dialogue Partner in May, the announcement of a UK–Australia free trade agreement and the inauguration of the UK bid to become a member of the Comprehensive and Progressive […]
[…] the United Kingdom’s application to become an ASEAN Dialogue Partner in May, the announcement of a UK–Australia free trade agreement and the inauguration of the UK bid to become a member of the Comprehensive and Progressive […]
[…] United Kingdom’s application to become an ASEAN Dialogue Partner in May, the announcement of a UK–Australia free trade agreement and the inauguration of the UK bid to become a member of the Comprehensive and Progressive […]
[…] with the requirements British farmers must adhere to when exporting into the EU, and may well cause further difficulties for the operation of the Northern Ireland Protocol agreed during the Brexit […]
[…] with the requirements British farmers must adhere to when exporting into the EU, and may well cause further difficulties for the operation of the Northern Ireland Protocol agreed during the Brexit […]
[…] incompatible with the requirements that British farmers must meet when exporting to the EU and can cause more difficulties for the functioning of the Northern Ireland Protocol agreed during the Brexit […]
[…] with the requirements British farmers must adhere to when exporting into the EU, and may well cause further difficulties for the operation of the Northern Ireland Protocol agreed during the Brexit […]
[…] the necessities British farmers should adhere to when exporting into the EU, and should properly trigger additional difficulties for the operation of the Northern Eire Protocol agreed throughout the […]
[…] with the requirements British farmers must adhere to when exporting into the EU, and may well cause further difficulties for the operation of the Northern Ireland Protocol agreed during the Brexit […]
[…] with the requirements British farmers must adhere to when exporting into the EU, and may well cause further difficulties for the operation of the Northern Ireland Protocol agreed during the Brexit […]
[…] with the requirements British farmers must adhere to when exporting into the EU, and may well cause further difficulties for the operation of the Northern Ireland Protocol agreed during the Brexit […]