
 29 July 2021
Yohannes Ayele is Research Fellow in the Economics of Brexit at the University of Sussex and Fellow of the UKTPO.
Since 1 January 2021, the UK’s trading relationship with its biggest and closest trading partner—the EU—has been governed by the Trade and Cooperation Agreement (TCA). Although the TCA is a zero-tariff and quota-free trade deal, several reports indicate that it is having a negative impact on the UK’s trade with the EU (see, 1, 2, and 3). While looking at the aggregate effect of the TCA on the UK trade is important, such analysis also misses the substantial differential impact of the TCA across the UK’s devolved administrations and regions.
Regions in the same country can be affected differently by new trade barriers because of the difference in industrial production structure and, second, the differential exposure of industries to trade policy changes. In this blog, we provide a brief report on how the UK’s regional trade with the EU fared in the first quarter since the introduction of the TCA.
The first quarter of 2021 data shows that all UK nations saw a decline in the world exports and imports compared with the first quarter average of 2018-20[1]. This can be seen in Table 1 below. [2] Wales, registered the largest fall in total exports (-26.9%), exports to the EU (-27.6%) and non-EU (-25.9). This is larger than the fall in the first quarter of UK exports to the world (-6.4%) and the EU (-22.1%) showing the importance of looking at the effects of the TCA on smaller geographic units. [3] With respect to exports to the EU, Northern Ireland registered the lowest decline in its exports followed by Scotland. For imports from the EU, the largest decline is for England, followed by Scotland. Northern Ireland saw a very small decline in imports from the EU, just -1.44%.
|
UK |
|
Export |
Import |
||||
|
Average 2018-20, £B |
2021, £B |
Change (%) |
Average 2018-20, £B |
2021, £B |
Change (%) |
||
|
England |
Total |
61.76 |
54.38 |
-11.95 |
95.46 |
78.69 |
-17.57 |
|
EU |
31.11 |
24.89 |
-20.01 |
55.34 |
40.78 |
-26.31 |
|
|
Non-EU |
30.65 |
29.50 |
-3.76 |
40.13 |
37.91 |
-5.51 |
|
|
Northern Ireland |
Total |
2.22 |
1.79 |
-19.48 |
1.90 |
1.74 |
-8.70 |
|
EU |
1.36 |
1.13 |
-16.70 |
1.24 |
1.22 |
-1.44 |
|
|
Non-EU |
0.86 |
0.66 |
-23.86 |
0.67 |
0.52 |
-22.17 |
|
|
Scotland |
Total |
7.69 |
6.17 |
-19.73 |
6.00 |
5.30 |
-11.67 |
|
EU |
4.07 |
3.14 |
-22.92 |
2.37 |
1.83 |
-23.04 |
|
|
Non-EU |
3.61 |
3.03 |
-16.15 |
3.63 |
3.47 |
-4.24 |
|
|
Wales |
Total |
4.31 |
3.14 |
-26.97 |
4.44 |
3.51 |
-20.76 |
|
EU |
2.65 |
1.92 |
-27.64 |
1.72 |
1.41 |
-17.91 |
|
|
Non-EU |
1.66 |
1.23 |
-25.90 |
2.72 |
2.10 |
-22.57 |
|
|
Unallocated |
Total |
8.14 |
7.24 |
-11.03 |
11.05 |
12.19 |
10.34 |
|
EU |
3.54 |
2.77 |
-21.79 |
5.22 |
3.87 |
-25.78 |
|
|
Non-EU |
4.59 |
4.47 |
-2.73 |
5.83 |
8.32 |
42.69 |
|
Figure 1 provides a greater level of regional disaggregation. It shows that none of the UK regions increased their exports to the EU in the first quarter of 2021. The largest decline in exports to the EU is registered in London (-35.4%) followed by Wales (-27.6%) and West Midlands (-26%). With respect to exports to non-EU countries, the East, London, North East and North West regions registered an increase in exports for the first quarter while all other UK regions saw a decline in exports. The dots in Figure 1 compare the change in regions’ exports to the EU, with the change in exports to non-EU countries. It gives the difference in the change in trade between the EU and non-EU. Where the dot is negative this indicates that exports to the EU declined more than to non-EU, and conversely where the dot is positive, trade to the EU performed better. The figure indicates that only Northern Ireland and East Midlands show positive dots, which means their exports to the EU performed better than exports to non-EU. The rest are negative, showing all performed better in their exports to non-EU compared with their exports to EU countries.
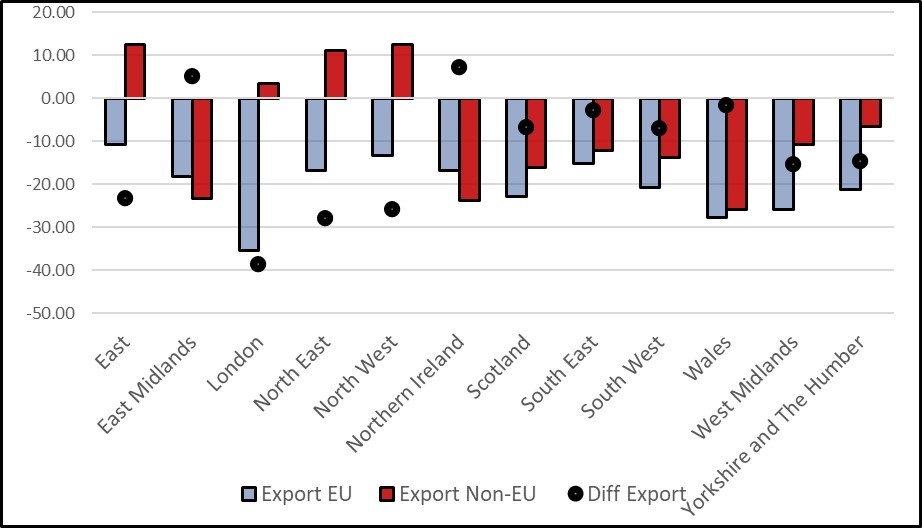
Note: The figure excludes trades unallocated known and unknown.
Figure 2 shows the level of imports of the UK regions’ for the first quarter of 2021 relative to the average of the first quarter of 2021. It shows that all UK regions saw a decrease in the level of imports from the EU, and the biggest fall is for Yorkshire and the Humber (-37.7%) followed by East (-32.1%) and London (-31.1%). For non-EU imports, for the same quarter, except a small increase for East, West Midlands and Yorkshire and the Humber, all regions saw a decline in imports. The figure indicates that Northern Ireland shows the largest difference in its imports to the EU compared to its imports from non-EU, and a small but positive difference for Wales. The other regions are negative, showing that their imports from non-EU are higher compared with their imports from EU countries.
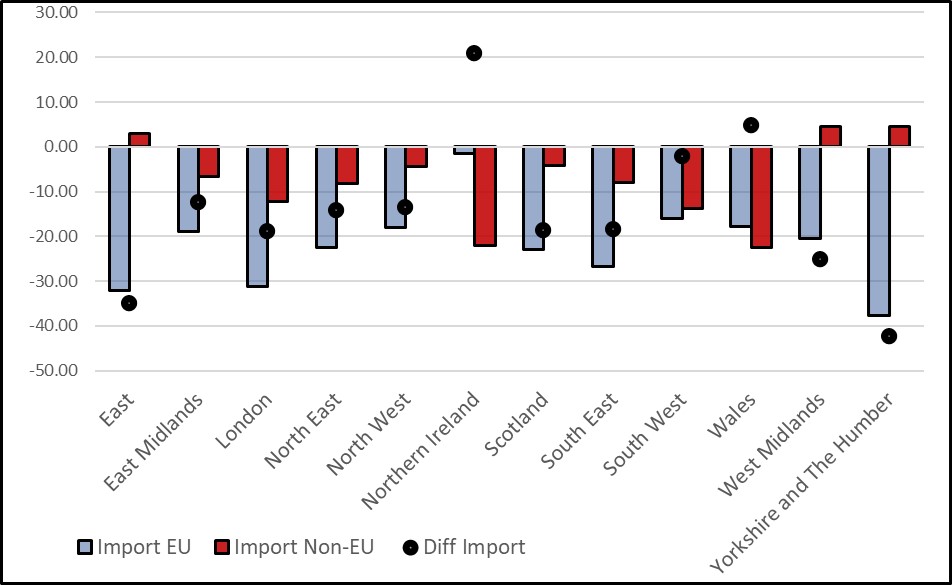
Note: The figure excludes trades unallocated known and unknown.
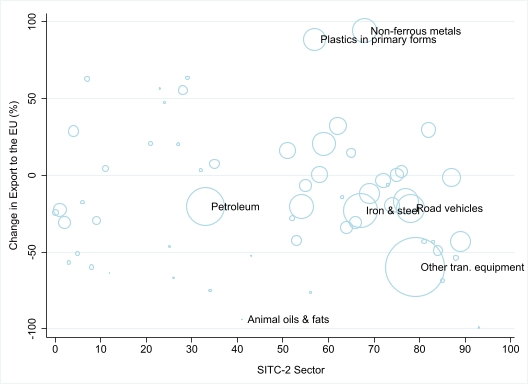
While looking at regions’ total trade is important, it also masks the substantial difference across sectors within regions. We use Wales’s exports to the EU as an example. As in Table 1, Welsh exports to the EU in the first quarter of 2021 declined by 27.6%. Close to 79% of Wales’ exports to the EU is from three sectors—Machinery and transport equipment (54.1%), manufactured goods (14.1%) and chemical and related products (11.0%). In the first quarter of 2021, the machinery and transport equipment sector exports to the EU experienced a 41.1% fall. This shows that the decline in Welsh exports to the EU is primarily driven by the fall in exports of a key sector. The same story holds for most of the regions. We can disaggregate this by industry even further, and this can be seen in Figure 3. This draws the scatter plot of the level of Wales’ exports to the EU for the first quarter of 2021 relative to the average of the first quarter of 2021. The bigger the circle, the larger the share of the sector in Wales’s exports to the EU. We see substantial variation across sectors. For example, the non-ferrous metals sector saw the largest increase in exports to the EU followed by plastics and crude animal and vegetable materials exports. The largest fall in exports is in Animal oils and fat, fertilizer, Gas and footwear.
In summary, while the TCA is a zero-tariff and quota-free trade deal it involves higher costs of trade with the EU, and those costs are having a differential impact across regions. That differential impact is driven by the differential impact across industries, combined with the differences across regions in their sectoral composition. The early evidence appears to suggest that out of the four UK nations the impact on exports to the EU has been largest for Wales and smallest for Northern Ireland, and the decline in imports from the EU has been greatest for England, and once again smallest for Northern Ireland. The small impact on NI export to the EU could be due to little change in its trading relationship to the EU after the TCA.
[1] We use the HMRC first quarter Regional Trade in Goods Statistics (RTS) which provides quarterly trade data by partner country and Standard International Trade Classification (Rev.4, SITC) at a 2-digit level of disaggregation for the UK regions. The RTS data is derived from the HMRC’s Overseas Trade Statistics by allocating business trade to regions based on the proportion of its employees employed in that region. Therefore, it is not real or actual trade data but it provides a glimpse of the impact of the TCA on the UK regions’ trade.
[2]HMRC also provides similar analysis for the first quarter of 2021. See: https://www.uktradeinfo.com/media/0dcf2h3b/rts_q1_2021.pdf
[3] Note that the HMRC OTS data include trade in non-monetary gold (NMG) but it is excluded from RTS data as the majority of it would be allocated to London and this would distort the RTS data. Therefore, caution is important when comparing the UK and different region’s export figures. See: https://assets.publishing.service.gov.uk/government/uploads/system/uploads/attachment_data/file/968005/RTS_Q4_2020.pdf
Disclaimer:
The opinions expressed in this blog are those of the author alone and do not necessarily represent the opinions of the University of Sussex or UK Trade Policy Observatory.
Republishing guidelines:
The UK Trade Policy Observatory believes in the free flow of information and encourages readers to cite our materials, providing due acknowledgement. For online use, this should be a link to the original resource on our website. We do not publish under a Creative Commons license. This means you CANNOT republish our articles online or in print for free.
Good post. Keep sharing.