
 11 February 2022
Nicolo Tamberi is Research Officer in Economics at the University of Sussex and Fellow of UKTPO.
With trade data for the full year 2021 just released, we update our earlier estimates of the UK-EU Trade and Cooperation Agreement’s impact on bilateral trade between the UK and the EU for the first year of the agreement.
Although the TCA, signed between the UK and EU in a last-minute deal on Christmas Eve 2020, came into being amidst much fanfare, the picture of bilateral trade between both economies continues to be rather gloomy. Using the latest release of HMRC data we estimate the impact of the TCA on UK exports to, and imports from, the EU excluding gold trade.
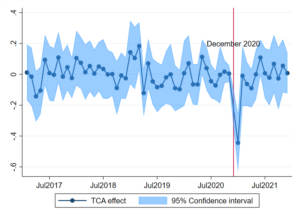
Data speak clearly. On the one hand, whilst UK exports to the EU saw a jaw-dropping fall in January 2021 (-41%), exports quickly recovered in subsequent months, resulting in a moderate fall of -3% for the whole of 2021, relative to what exports would have been without the agreement.
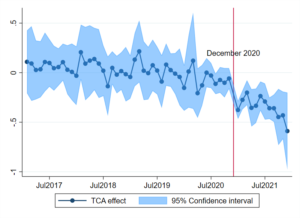
On the other hand, the effect of the TCA on UK imports from the EU is strong and, more importantly, turns out to be much more persistent. In the first year of the TCA, imports from the EU fell by -32%. And what’s more, it almost looks as if EU imports would be on a falling trajectory after the immediate hit in January 2021. The results for estimated impacts on exports and imports are summarised in Figure 1.
Figure 1: the effect of the TCA on UK trade with the EU
Although the results on total trade show that the TCA did not affect aggregate UK exports beyond January 2021, running the same counterfactual analysis at a more disaggregated level reveals that EU exports of certain broad product groups have been badly hit. In particular, we find that the negative impact on UK exports of Leather and Textile & Clothing (HS 41-43, 50-67) has been persistent across all months of 2021. For these two sectors, the TCA reduced combined UK exports to the EU by -59% or £5.7bn. The next most affected export sector is Food and agriculture (HS 01-24). For this sector, the recovery has been slower than for total exports, and over 2021 the TCA reduced exports by 19% or £2.8bn.
For imports, differences across sectors are less pronounced. The most affected sector is Chemicals and plastics, whose combined imports fell by 39% (£19bn), followed by Machineries and transport equipment (-28% or £29bn) and Metals (-28% or £4bn).
In summary, the TCA has had a strong and persistent effect on UK imports from the EU, while the effect on total UK exports to the EU appears to have been rather ephemeral in January 2021 only. That said, looking beyond aggregate exports at product level data shows that UK exports in particular sectors have also been severely hit.
One may ask what is driving these negative impacts. After all, in the TCA, the provisions agreed on market access for goods ensure that, at least in principle, trade between the two Parties remained tariff-free and quota-free to minimise disruption for producers exporting and importing goods to and from the EU. Practically, however, we have seen that the disruption has been significant.
There is anecdotal evidence from UK businesses on the impact that the new customs and regulatory border with the EU has had on trading goods (UKTPO Briefing Paper 62). Generally, it has become more difficult and costly to trade with the EU as firms now face bureaucratic costs that were otherwise not present.
We acknowledge that isolating the effect on trade of the TCA is difficult because of several other concomitant shocks, in particular the Covid-19 pandemic. However, our previous analysis has shown the robustness of our estimates to the use of more-sophisticated econometric techniques. See the UKTPO Briefing Paper 57 and Briefing Paper 63.
In this blog, we update our analysis of the impact of the TCA on UK-EU trade using a difference in difference approach. More details on the methodology can be found in our earlier analysis of the TCA effects on trade in UKTPO Briefing Paper 57. In a nutshell, the estimation compares UK trade with the EU relative to UK trade with other comparable trading partners (the OECD and BRICS countries) over the period 2017-21. We exclude Canada and Japan from the comparison group as they signed a trade agreement with the EU in the period 2017-19. However, results are unchanged if these countries were also included.
Disclaimer:
The opinions expressed in this blog are those of the author alone and do not necessarily represent the opinions of the University of Sussex or UK Trade Policy Observatory.
Republishing guidelines:
The UK Trade Policy Observatory believes in the free flow of information and encourages readers to cite our materials, providing due acknowledgement. For online use, this should be a link to the original resource on our website. We do not publish under a Creative Commons license. This means you CANNOT republish our articles online or in print for free.