

 8 August 2022
Minako Morita-Jaeger is Policy Research Fellow at the UK Trade Policy Observatory and
Senior Research Fellow in International Trade in the Department of Economics, University of Sussex. Guillermo Larbalestier is Research Assistant in International Trade at the University of Sussex and Fellow of the UKTPO.
The UK-Japan Comprehensive Economic Partnership Agreement (CEPA) came into force in January 2021, as part of the UK’s post-Brexit trading arrangements. CEPA was designed to largely replicate the EU-Japan Economic Partnership Agreement (EPA), to which the UK had been a party. On the face of it, there was little additional economic value to the UK, since CEPA provisions follow EPA provisions so closely, except for a chapter on digital trade.
In this blog, we analyse trade between the UK and Japan in the CEPA’s first twelve months. We recognise that a year is insufficient for a full assessment (particularly given the effect of other factors such as the ongoing Covid-19 pandemic, the Russian invasion of Ukraine, and the UK’s relationship with the EU). Nevertheless, we examine some initial insights that emerge from the data.
A weak UK-Japan trade performance, especially in services trade
Japan is an important trading partner for the UK: in 2021, UK exports of goods and services to Japan amounted to 11.5 billion GBP (or 1.8% of the UK’s total exports), and imports of goods and services from Japan to 11.6 billion GBP (1.8% of the UK’s total imports). The then International Trade Secretary, Liz Truss, said that the deal was about “creating opportunity and prosperity for all parts of our United Kingdom and driving the economic growth we need to overcome the challenges of coronavirus.” According to Department for International Trade estimates, CEPA was anticipated to create a 17.2% increase in UK exports to Japan, and close to an 80% increase in UK imports from Japan, over the “long run” (with a 0.07% increase in UK GDP).[1]
Even without an FTA (Figure 1), UK exports of goods and services to Japan had been steadily increasing prior to the Covid-19 pandemic (1999-2021).[2] This is also the case for imports of services. Goods imports from Japan, however, declined over much of the period, with evidence of recovery since 2015 and up to the Covid-19 breakout.
Figure 1: UK-Japan Trade 1999-2021, £ million
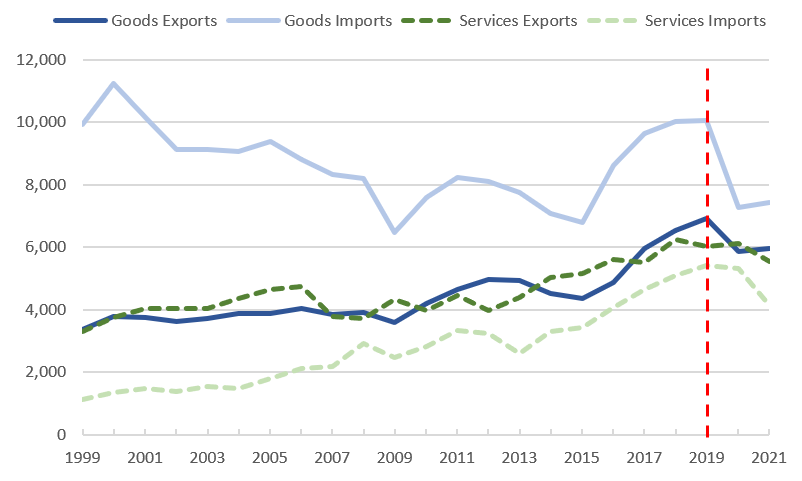
Data source: Office of National Statistics (ONS).
Note: The red dotted line in 2019 marks the Covid-19 outbreak.
Turning our focus to the period 2020-21, we find three key results.
First (see Table 1), UK services trade with Japan experienced a considerable decline. UK exports of services are over 9% lower in 2021 compared with 2020, while imports of services from Japan are 22% lower. In 2020, Japan was the 9th most important destination for UK services exports and the 8th most important source of UK services imports. However, in 2021, Japan’s ranking dropped to 12th with regard to both services exports and imports. In contrast, exports and imports of goods show modest indications of a recovery in 2021 after large declines in both export and imports of goods (2019-2020) presumably due to the economic shock caused by the Covid-19 pandemic (Figure 1/Table 1).
Table 1: UK-Japan Trade 2020 vs 2021
| 2019 | 2020 | 2021 | Change (Value) | |||||
| Value
(£m) |
Value (£m) | World Share | Rank | Value (£m) | World Share | Rank | ||
| Goods Exports | 6,927 | 5,875 | 1.9% | 13 | 5,954 | 1.9% | 14 | 1.3% |
| Goods Imports | 10,057 | 7,263 | 1.7% | 15 | 7,422 | 1.6% | 17 | 2.2% |
| Services Exports | 6,036 | 6,115 | 2.0% | 9 | 5,555 | 1.8% | 12 | -9.2% |
| Services Imports | 5,432 | 5,323 | 3.2% | 8 | 4,154 | 2.4% | 12 | -22.0% |
Data source: Office of National Statistics (ONS); calculations are authors’ own.
Second, in comparison with the UK’s trade relations with other non-EU trade partners during the same period, we see that UK-Japan trade appears to be underperforming, especially in services trade (Figure 2). Both UK services exports and imports with non-EU countries show an increase by 1.5% (exports) and 14.5% (imports). Also, UK goods trade shows a stronger recovery: increases of 3.5% in exports and 24.5% in imports.
Third, in comparison with the UK’s trade with the EU, UK-Japan trade performance is even weaker, with the exception of goods imports during the period. UK’s services exports to the EU increased by 0.5% while those to Japan showed a 9.2% decrease. The UK’s services imports from the EU decreased only by 0.5% while those from Japan reduced by 22%. In the case of goods trade, the UK’s exports to the EU saw a 4.9% increase whereas those to Japan increased only by 1.3%. (Figure 2).
Figure 2: UK’s trade with Japan, EU-27, ROW and World – 2021 vs 2020, percentage changes (%)

Data source: Office of National Statistics (ONS); calculations are authors’ own.
Note: ROW indicates rest of the world.
One important caveat should be considered: The disappointing changes in UK-Japan trade reported above could be driven by poor Japanese performance in all markets. Hence, relative to changes in Japan’s trade with other countries, trade with the UK may have in fact been performing very well. To assess this, we need to consider Japanese data, which then raises issues of compatibility across different data sources. Hence, for example, changes in the UK’s reported exports to Japan should – in principle – match the changes in reported Japanese imports from the UK. In practice, this is rarely the case and the discrepancies can be quite large. This is especially the case when looking at trade in services which is notoriously harder to measure. Nevertheless, we have considered both Japanese Balance of Payments statistics (for goods and services) and UN Comtrade data for trade in goods. In all cases but one, Japanese exports and imports of both goods and services with the UK performed worse than the equivalent flows with the EU or the Rest of the World[1].
Why did services trade significantly decrease?
Japanese businesses have used the UK as a gateway to the EU since the 1980s. Brexit triggered Japanese companies to change their business model in Europe and/or reshape their business activities in the UK. From the Japanese annual business survey conducted in 2021,[2] the top business concerns of Japanese companies in the UK remain: the UK’s leaving the EU (73.7% of respondents in 2020 and 47.9% of respondents in 2021); followed by the Covid-19 pandemic (55.9% in 2020 and 44.6% in 2021); availability of human resources (30.9% in 2020 and 41.3% in 2021); and customs procedures (32.2% in 2020 and 38.8% in 2021). This indicates that Japanese companies are having difficulties navigating the post-Brexit UK-EU trade framework. The survey also revealed that Japanese companies are considering strengthening and expanding their business functions (e.g. headquarters, sales, production, distribution-related services, and R&D) in the EU – such as in Germany, France and the Netherlands – for their business in Europe.
Since the UK is primarily a services economy (services account for 80% of UK GDP), and the role of services trade is increasing in global value chains, one plausible explanation for the decrease of services trade is that it is linked to ongoing changes in firms’ supply chain strategies. In the case of the UK’s services exports, foreign-owned firms in the UK (both manufacturing and services) generate two-thirds of the UK’s cross-border services exports. Mode 5 services trade (exports and imports of services that are embodied in the production of goods) also plays an important role in the major UK export industries with a relatively high export intensity, such as motor vehicles, air and space craft, and pharmaceuticals. The degree of foreign value-added content of gross exports are high in finance and insurance, other business services, as well as information and communications. These indicate that if Japanese manufacturing firms located in the UK change their business activities in the UK, this will likely influence the UK’s cross-border services exports and imports.
In short, while it is still too early to see the longer-term effectiveness of CEPA on the UK economy, the early data does not appear encouraging. This is particularly the case with regard to services trade. More research is needed to understand the driving forces behind this, but it is likely that the changed relationship between the UK and the EU has impacted on trade between the UK and Japan.
[1] The one exception was with regard to Japanese exports of goods to the UK according to the Japanese Balance of Payments data.
[2] The annual business survey on Japanese companies doing business in Europe conducted by JETRO in 2021 and released in January 2022. Only available in Japanese (https://www.jetro.go.jp/world/reports/2022/01/884abd60b0c7fa54.html)
[1] Modelling by DIT was done in 2019 terms (see p.40 of the Impact Assessment).
[2] The EU-Japan EPA came into force in February 2019.
Disclaimer:
The opinions expressed in this blog are those of the author alone and do not necessarily represent the opinions of the University of Sussex or UK Trade Policy Observatory.
Republishing guidelines:
The UK Trade Policy Observatory believes in the free flow of information and encourages readers to cite our materials, providing due acknowledgement. For online use, this should be a link to the original resource on our website. We do not publish under a Creative Commons license. This means you CANNOT republish our articles online or in print for free.
[…] albeit incorrectly as it was basically copied and pasted from the EU–Japan agreement — has been disappointing in its early trade […]
[…] incorrectly as it was basically copied and pasted from the EU–Japan agreement — has been disappointing in its early trade […]
[…] incorrectly as it was basically copied and pasted from the EU–Japan agreement — has been disappointing in its early trade […]
[…] increase UK exports to the country by 17.2% and increase imports from Japan by almost 80%. Yet, an analysis by the UK Trade Policy Observatory (UKTPO) – a joint project of Sussex University and Chatham […]
[…] comparative analysis of UK-Japan trade figures for 2020 and 2021 by Morita-Jaeger and a colleague states: “In all cases but one, Japanese exports and imports of goods and services […]
[…] comparative analysis of UK-Japan trade figures for 2020 and 2021 by Morita-Jaeger and a colleague states: “In all cases but one, Japanese exports and imports of goods and services […]
[…] comparative analysis of UK-Japan trade figures for 2020 and 2021 by Morita-Jaeger and a colleague states: “In all cases but one, Japanese exports and imports of goods and services […]
[…] […]
[…] comparative analysis of UK-Japan trade figures for 2020 and 2021 by Morita-Jaeger and a colleague states: “In all instances however one, Japanese exports and imports of products […]
[…] comparative analysis of UK-Japan trade figures for 2020 and 2021 by Morita-Jaeger and a colleague states: “In all cases but one, Japanese exports and imports of goods and services […]
[…] comparative analysis of UK-Japan trade figures for 2020 and 2021 by Morita-Jaeger and a colleague states: “In all cases but one, Japanese exports and imports of goods and services […]
[…] comparative analysis of UK-Japan trade figures for 2020 and 2021 by Morita-Jaeger and a colleague states: “In all but one case, Japanese exports and imports of goods and […]
[…] comparative analysis of UK-Japan trade figures for 2020 and 2021 by Morita-Jaeger and a colleague states: “In all cases but one, Japanese exports and imports of goods and services […]
[…] 2020 vs 2021 UK vs. Japan trade performance benchmarking by Morita-Jaeger and his colleague states: “In all but one case, Japanese exports and imports of goods and […]
[…] comparative analysis of UK and Japan trade figures for 2020 and 2021 by Morita-Jaeger and a colleague states: “In all but one case, Japanese exports and imports of goods and […]
[…] Comparative analysis of UK-Japan trade figures for 2020 and 2021 by Morita-Jaeger “In all but one case,” says a colleague, “Japanese exports and imports of goods and services […]
[…] comparative analysis of UK-Japan trade figures for 2020 and 2021 by Morita-Jaeger and a colleague states: “In all cases but one, Japanese exports and imports of goods and services […]
[…] comparative analysis of UK-Japan trade figures for 2020 and 2021 by Morita-Jaeger and a colleague states: “In all cases but one, Japanese exports and imports of goods and services […]
[…] comparative analysis of UK-Japan trade figures for 2020 and 2021 by Morita-Jaeger and a colleague states: “In all cases but one, Japanese exports and imports of goods and services […]
[…] Morita-Jaeger lyginamoji JK ir Japonijos prekybos duomenų 2020 ir 2021 m. analizė ir kolega teigia: „Visais atvejais, išskyrus vieną, Japonijos prekių ir paslaugų eksportas ir […]
[…] Morita-Jaeger 2020-as és 2021-es brit-japán kereskedelmi adatainak összehasonlító elemzése és egy kolléga kijelenti: „Egy kivételével minden esetben a japán export és áru- és […]
[…] comparative analysis of UK-Japan trade figures for 2020 and 2021 by Morita-Jaeger and a colleague states: “In all cases but one, Japanese exports and imports of goods and services […]
[…] Comparative analysis of UK-Japan trade figures for 2020 and 2021 by Morita-Jaeger “In all but one case,” says a colleague, “Japanese exports and imports of goods and services […]
[…] komparativ analyse av handelstallene mellom Storbritannia og Japan for 2020 og 2021 av Morita-Jaeger og en kollega uttaler: “I alle tilfeller bortsett fra ett, gikk japansk eksport og import av […]
[…] Morita-Jaeger lyginamoji JK ir Japonijos prekybos duomenų 2020 ir 2021 m. analizė ir kolega teigia: „Visais atvejais, išskyrus vieną, Japonijos prekių ir paslaugų eksportas ir […]
[…] comparative analysis of UK-Japan trade figures for 2020 and 2021 by Morita-Jaeger and a colleague states: “In all cases but one, Japanese exports and imports of goods and services […]
[…] comparative analysis of UK-Japan trade figures for 2020 and 2021 by Morita-Jaeger and a colleague states: “In all cases but one, Japanese exports and imports of goods and services […]
[…] comparative analysis of UK-Japan trade figures for 2020 and 2021 by Morita-Jaeger and a colleague states: “In all cases but one, Japanese exports and imports of goods and services […]
[…] Morita-Jaegerによる2020年と2021年の日英貿易額の比較分析 ある同僚は、「1 […]
[…] Comparative analysis of UK-Japan trade figures for 2020 and 2021 by Morita-Jaeger “In all but one case,” says a colleague, “Japanese exports and imports of goods and services […]
[…] comparative analysis of UK-Japan trade figures for 2020 and 2021 by Morita-Jaeger and a colleague said: “In all cases except one, Japan’s exports and imports of goods […]
[…] comparative analysis of UK-Japan trade figures for 2020 and 2021 by Morita-Jaeger and a colleague states: “In all cases but one, Japanese exports and imports of goods and services […]
[…] comparative analysis of UK-Japan trade figures for 2020 and 2021 by Morita-Jaeger and a colleague states: “In all cases but one, Japanese exports and imports of goods and services […]
[…] Comparative analysis of UK-Japan trade figures for 2020 and 2021 by Morita-Jaeger “In all but one case,” says a colleague, “Japanese exports and imports of goods and services […]
[…] Analisi comparativa dei dati commerciali tra Regno Unito e Giappone per il 2020 e il 2021 di Morita-… e un collega afferma: “In tutti i casi tranne uno, le esportazioni e le importazioni […]
[…] Comparative analysis of UK-Japan trade figures for 2020 and 2021 by Morita-Jaeger “In all but one case,” says a colleague, “Japanese exports and imports of goods and services […]
[…] comparative analysis of UK-Japan trade figures for 2020 and 2021 by Morita-Jaeger and a colleague states: “In all cases but one, Japanese exports and imports of goods and services […]
[…] Comparative analysis of UK-Japan trade figures for 2020 and 2021 by Morita-Jaeger “In all but one case,” says a colleague, “Japanese exports and imports of goods and services […]
[…] comparative analysis of UK-Japan trade figures for 2020 and 2021 by Morita-Jaeger and a colleague states: “In all instances however one, Japanese exports and imports of products […]
[…] 2020 年と 2021 年の英国と日本の貿易額の比較分析 Morita-Jaeger また、ある同僚は、「1 […]
[…] Comparative analysis of UK-Japan trade figures for 2020 and 2021 by Morita-Jaeger “In all but one case,” says a colleague, “Japanese exports and imports of goods and services […]
[…] 2020 vs 2021 UK vs. Japan trade performance benchmarking by Morita-Jaeger and his colleague states: “In all but one case, Japanese exports and imports of goods and […]
[…] advantages over the previous EU deal. She said the early trade data did not appear encouraging.A comparative analysis of UK-Japan trade figures for 2020 and 2021 by Morita-Jaeger and a colleague states: “In all cases but one, Japanese exports and imports of goods and services […]
[…] advantages over the previous EU deal. She said the early trade data did not appear encouraging.A comparative analysis of UK-Japan trade figures for 2020 and 2021 by Morita-Jaeger and a colleague states: “In all cases but one, Japanese exports and imports of goods and services […]
[…] advantages over the previous EU deal. She said the early trade data did not appear encouraging.A comparative analysis of UK-Japan trade figures for 2020 and 2021 by Morita-Jaeger and a colleague states: “In all cases but one, Japanese exports and imports of goods and services […]
[…] comparative analysis of UK-Japan trade figures for 2020 and 2021 by Morita-Jaeger and a colleague states: “In all cases but one, Japanese exports and imports of goods and services […]
[…] comparative analysis of UK-Japan trade figures for 2020 and 2021 by Morita-Jaeger and a colleague states: “In all cases but one, Japanese exports and imports of goods and services […]
Hello there
I wonder if you are considering doing a follow-up on this for 2022?
If so it would be well received, if not may I nudge you to think about doing it?
Best
David
[…] as a ‘historical deal’ that diverged from the agreement the EU has with Japan. However, the UK Trade Policy Observatory analysed trade data for the first twelve months after the deal was ratified and found that trade […]
[…] comparative analysis of UK-Japan trade figures for 2020 and 2021 by Morita-Jaeger and a colleague states: “In all cases but one, Japanese exports and imports of goods and services […]
[…] comparative analysis of UK-Japan trade figures for 2020 and 2021 by Morita-Jaeger and a colleague states: “In all cases but one, Japanese exports and imports of goods and services […]
[…] comparative analysis of UK-Japan trade figures for 2020 and 2021 by Morita-Jaeger and a colleague states: “In all […]