
Download Briefing Paper 72
Distribution of PURs across products and between the UK and EU
The HMRC has recently released data for UK imports by tariff regime. This Briefing Paper compares the preference utilisation rates (PURs) of both the UK and EU imports under the Trade and Cooperation Agreement. PURs tell us the amount of eligible imports that come in tariff-free (that is, preference eligible in a free trade agreement, the extent to which preferences are being used) and allow for the evaluation of the effectiveness of a trade agreement.
The Trade and Cooperation Agreement (TCA) allows tariff-free trade between the UK and the EU for all goods, but not unconditionally – the waiving of tariffs applies to those goods where there has been sufficient domestic (either UK or EU) production. Preferences are worthless if they are not used. Under the TCA, 82% of eligible EU imports from the UK enter tariff-free, while the figure is 90% for UK imports from the EU.[1]
All countries, including the EU and the UK have Most Favoured Nation (MFN) customs tariffs on the imports of goods. Tariffs however are not levied on all goods – for example, the UK chooses not to levy a tariff on 7,218 out of 11,830 tariff lines, while the EU has zero MFN on 3,113 out of 15,885 tariff lines.[2] The UK MFN tariff is set to zero for about 72% of UK imports that were shipped by MFN countries over the years 2017-19.[3] A key element of a free trade agreement between countries is to eliminate (or reduce) the tariffs on the partners.[4] For UK-EU trade, the TCA grants tariff-free trade – providing that the product originates in the partner country and can be shown to originate.
Obtaining proof of origin can be costly, and in some cases, the cost may outweigh the duty saving under the preferential regime (see also the UKTPO Briefing Paper 62). In other cases, there simply may be insufficient domestic inputs / economic activity for the goods to be deemed as originating. For these reasons, not all products are traded under the tariff-free regime in a free trade agreement. Rules of Origin aim to stop trade rerouting by third parties and to ensure that tariff preferences are applied only to products produced by the signatory parties. However, in some instances, they might act as a form of protectionism.
The preference utilisation rate (PUR) is the share of imports using the preferences in a trade agreement, out of total imports for which the MFN tariff is not zero. It tells us the extent to which firms are utilising the reduced-tariff benefits provided by the trade agreement.
In the first eight months of 2022, the UK imported 4,527 products from the EU while the EU imported 6,409 from the UK.[5] Products are defined at the 8-digit level of the Combined Nomenclature (CN) trade classification, where the total number of products is about 9,400. The EU is a larger consumption market than the UK and therefore demands more products but it also produces more products and so could supply more products. The fact that the UK exported more products than it imported suggests that the former effect dominates. While in principle the trade barriers imposed by the TCA are the same for trade going in either direction across the Channel, the utilisation of preferential tariffs differs between the EU and the UK.
Note that the UK did not operate full customs control on imports from the EU until January 2022. Moreover, requirements for full safety and security declarations, export health certificates, phytosanitary certificates and physical checks on sanitary and phytosanitary goods were not supposed to be in place before July 2022. Implementation of some of these checks have additionally been pushed forward.[6] This might have made preference utilisation easier for UK imports than for EU imports.
Table 1 below reports the PUR for total UK-EU trade in goods from January-August 2022. PURs are computed as total imports under the preferential regime divided by total eligible imports, excluding products with zero MFN tariff. We report the PUR on total imports, the average across all CN 8-digit products as well as the median across CN8 products.
Table 1: PUR for total trade, Jan-Aug 2022
| Exporter | Importer | Total | Mean | Median |
| UK | EU | 0.82 | 0.57 | 0.69 |
| EU | UK | 0.90 | 0.83 | 0.94 |
| Source: author’s calculation based on Eurostat and HMRC data. | ||||
EU exporters are utilising preferences more than UK exporters – 8 percentage points more on total trade. The difference remains marked whether we look at the average or median PUR across all CN 8-digit products.
From Table 1, we note that the mean PUR for UK exports (0.57) is much lower than the PUR on total trade (0.82), while for EU exports mean and total PURs are similar, passing from 0.83 to 0.90. Hence, UK exporters tend to use preferences more where the value of trade is larger, while this does not apply to EU exporters, who use preferences more generally.
The data also indicate that the UK import values from the EU are larger than EU imports from the UK on average. These descriptive statistics therefore may signal the presence of fixed costs related to utilising a PUR that are not worth paying if the transaction value is too small.[7]
To see how PURs are distributed across products between UK and EU importers/exporters, Figure 1 plots the frequency of imported products for five groups based on PURs. Here we focus on the number of products rather than the value of imports. The horizontal axis classifies a CN8 product in five groups depending on their PUR: 0-20% utilisation, 20-40%, 40-60%, 60-80% and 80-100%. The vertical axis reports the frequency of products in each group, computed as the number of products in that group divided by the total number of eligible products across all groups.
Hence, going from left to right, in the first group we see that over 1/5th of the number of UK products exported to the EU that could have entered duty-free utilised the preferences by less than 20%. This highlights, that a large portion of products exported by the UK to the EU makes relatively little use of preferences. More UK products are exported with a PUR in the 0-20% range than in the 60-80% range. On the other hand, the vast majority (about 70%) of eligible EU-exported products to the UK have a PUR above 80%.
Figure 1: PURs by group for UK and EU exports, count of products
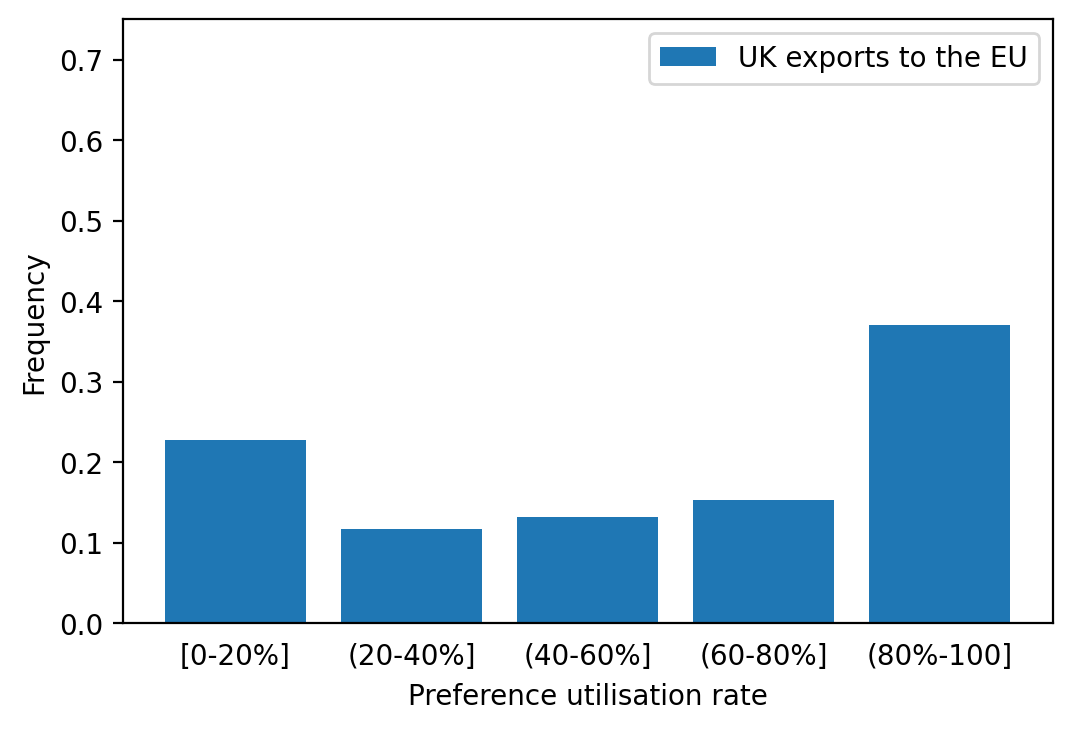
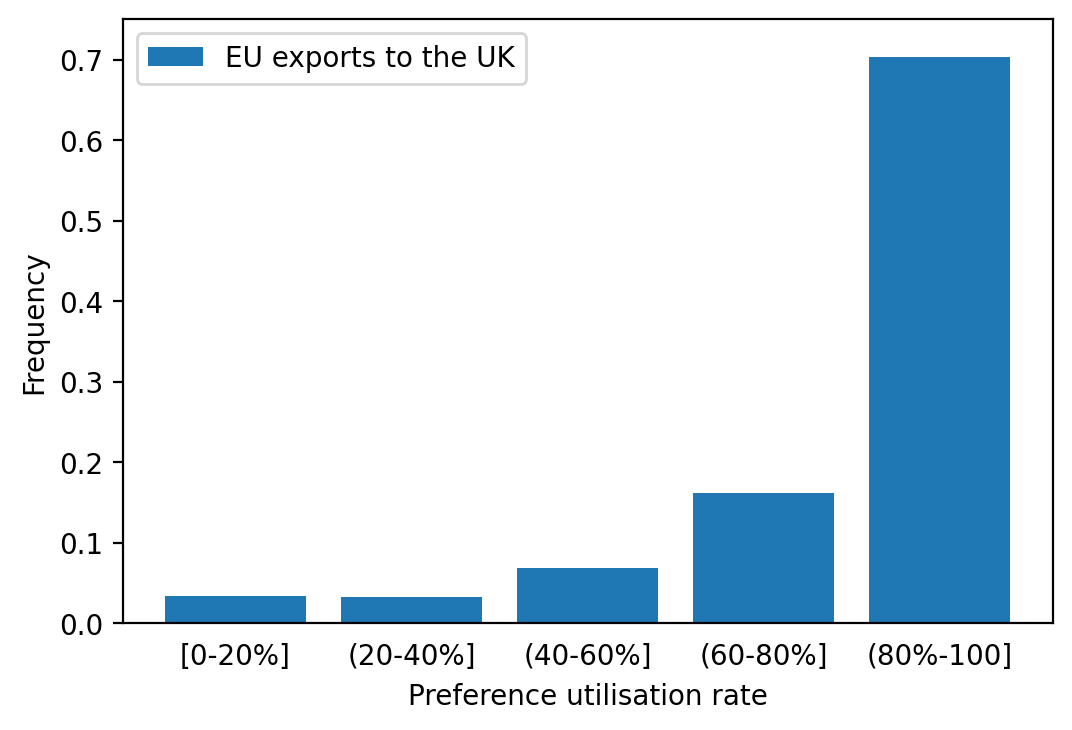
| a) UK exports to the EU | b) EU exports to the UK |
Table 2 reports PURs by product groups, computed as the value of preferential imports over the value of eligible imports. Both UK and EU exporters make good use of preferences for Agri-Food products. This could be because the MFN tariffs that are avoided are generally higher than on other products, or it could be because the rules determining whether a good is deemed as originating or not may be easier. Differences between the UK and EU PURs are not very marked for Primary products or Chemicals and Plastics.
Textile and Clothing is a sector where a big difference arises. While 84% of EU exports enter the UK under the preferential regime, only 54% of UK exports to the EU are traded utilising preferential tariffs. Miscellaneous and Engineering products also display a gap, with PUR differences of 19 and 11 percentage points, respectively.
Table 2: Total by product groups
| Importer | Agri-Food | Primary | Chemicals and Plastics | Textile and Clothing | Metals | Engineering | Miscellaneous |
| EU | 0.93 | 0.93 | 0.86 | 0.54 | 0.83 | 0.75 | 0.62 |
| UK | 0.98 | 0.87 | 0.91 | 0.84 | 0.90 | 0.86 | 0.81 |
| Source: author’s calculation based on Eurostat and HMRC data. | |||||||
Differences between aggregate product groups might be driven by differences in the composition of UK and EU trade at a more disaggregated product level. For instance, where the set of products the UK exports is different from the set of products exported by the EU, and PURs may be lower for its products, for example, because obtaining proof of origin is more difficult. So how much of this is driven by compositional differences?
To address composition issues, we compute PURs at the CN8 level for the set of products imported by both the EU and the UK (this amounts to 4,212 CN8 products ) and then compute weighted averages by product groups with the same weights for both EU and UK imports. I consider three sets of weights: i) uniform weights (the average); ii) based on EU imports; and iii) based on UK imports. The weights based on EU or UK imports are computed as imports of a CN8 product over total imports for the product group.
The re-weighted PURs based on the common set of products are reported in Table 3 together with the original PURs for comparison. Re-weighting based on EU imports brings UK and EU PURs very close to each other, while using UK imports weights or uniform weights makes them further apart.
Finally, note how across all the weighting schemes the gap in PURs for Textile and Clothing products remains very large, implying that this is not a compositional issue.
Table 3: UK and EU PURs by product group with common weights
| Product group | Original | Uniform weights | UK exports weights | EU exports weights | ROO Restrictiveness Index | |||||||
| UK Exp | EU Exp | UK Exp | EU Exp | UK Exp | EU Exp | UK Exp | EU Exp | |||||
| Agri-Food | 0.93 | 0.98 | 0.63 | 0.93 | 0.93 | 0.95 | 0.72 | 0.98 | 3.39 | |||
| Primary | 0.93 | 0.87 | 0.53 | 0.82 | 0.93 | 0.91 | 0.69 | 0.87 | 3.92 | |||
| Chemicals and Plastics | 0.86 | 0.91 | 0.69 | 0.83 | 0.86 | 0.89 | 0.81 | 0.91 | 3.56 | |||
| Textile and Clothing | 0.54 | 0.84 | 0.42 | 0.78 | 0.51 | 0.79 | 0.39 | 0.84 | 5.88 | |||
| Metals | 0.83 | 0.90 | 0.65 | 0.84 | 0.83 | 0.86 | 0.65 | 0.90 | 5.81 | |||
| Engineering | 0.75 | 0.86 | 0.55 | 0.70 | 0.76 | 0.79 | 0.70 | 0.86 | 4.17 | |||
| Miscellaneous | 0.62 | 0.81 | 0.45 | 0.66 | 0.67 | 0.70 | 0.57 | 0.81 | 4.16 | |||
| Total | 0.82 | 0.90 | 0.57 | 0.83 | 0.83 | 0.86 | 0.70 | 0.90 | 4.32 | |||
| Source: author’s calculation based on Eurostat and HMRC data. | ||||||||||||
Preference utilisation can be low for a number of reasons. Above all, the cost of obtaining a certificate of origin must be smaller than how much can be saved using preferences. Obtaining origination might involve fixed costs, hence affecting small exporters the most. If a high share of trade is carried out by distributors, or those who may not have good records of the production process, proving origin might be difficult. Note too that while the Rules of Origin in the TCA are the same for both UK and EU exporters, the cost of compliance can be different. The analysis in this Briefing Paper provides prima facie evidence that suggests such costs may be higher for British than for EU exporters.
The divergent degrees of preference utilisation found across product groups is likely to be in part driven by the restrictiveness of Rules of Origin (RoO), defined at the product level, i.e. how difficult to fulfil they are for firms. Ayele et al. (2022) constructed an index, on a 1-10 scale, which scores every RoO defined at the 6-digit product level, under the UK-EU Trade and Cooperation Agreement (TCA). The last column of Table 3 provides the average RoO restrictiveness index by product group. In groups like Agri-Food and Primary products which have a high PUR, the average RoO restrictiveness index tends to be low. Conversely, Textile and Clothing, the product group with the lowest degree of PUR for UK exports, has the highest average degree of RoO restrictiveness.
Ayele et al. (2022) also examined econometrically the relation between the RoO restrictiveness and the PURs for EU imports from the UK, finding that a one-point higher product-level RoO restrictiveness index is associated with a lower degree of preference utilisation by 1.7 to 2.5 percentage points. However, while the RoO restrictiveness index can explain differences in PUR across sectors, it cannot explain different utilisation rates between EU and UK exports for the same products. The work of Ayele et al (2022), finds a positive relationship between PURs and the size of trade flows, proxied by the potential duty savings[8]. This outcome provides support to the finding mentioned earlier of larger preference utilisation for products with larger trade values of UK exports.
To summarise, while both UK and EU total PURs are above 80% overall, EU exporters to the UK are utilising preferences more than UK exporters to the EU. The use of preferences by UK exporters is more concentrated in larger transactions than it is for EU exporters. The use of preferences by UK exporters in some sectors, and notably Textile and Clothing, remains low, even almost two years after the introduction of the TCA. This could be explained by the higher degree of restrictiveness of rules of origin affecting products from that sector under the TCA.
[1] A previous UKTPO blog analysed the uptake of preferences in EU imports from the UK.
[2] Data based on the UK Global Tariff published in January 2021: https://www.data.gov.uk/dataset/19890572-14b6-4d37-8a6d-6a5ec3b457fe/most-favoured-nation-mfn-rates-to-trade-with-the-uk-from-1-january-2021 for the UK and on the MacMap data for 2019 for the EU MFN tariff. Tariff lines are products at their most disaggregated level.
[3] Calculation based on UK imports from MFN countries over the years 2017-19 as reported by HMRC data at the CN8 level.
[4] The MFN tariff is the standard tariff imposed by a country to all other partners in the absence of a free trade agreement.
[5] At the time of writing, data on PUR for both EU and UK imports were available up to August 2022.
[6] See Prepare for New 2023 EU-UK Sanitary and Phytosanitary Controls UPDATED | CustomsLink® (customs-link.com)
[7] For the set of commonly traded products, after adjusting for the exchange rate, UK imports from the EU are higher than EU imports from the UK for 3,220 out of 4,212 products (76%). The median of the ratio UK imports from EU/EU imports from UK is 3.4.
[8] In Ayele et al. (2022), potential duty savings are measured as the product of the EU Common External Tariff and the import value, defined at the country-product level.