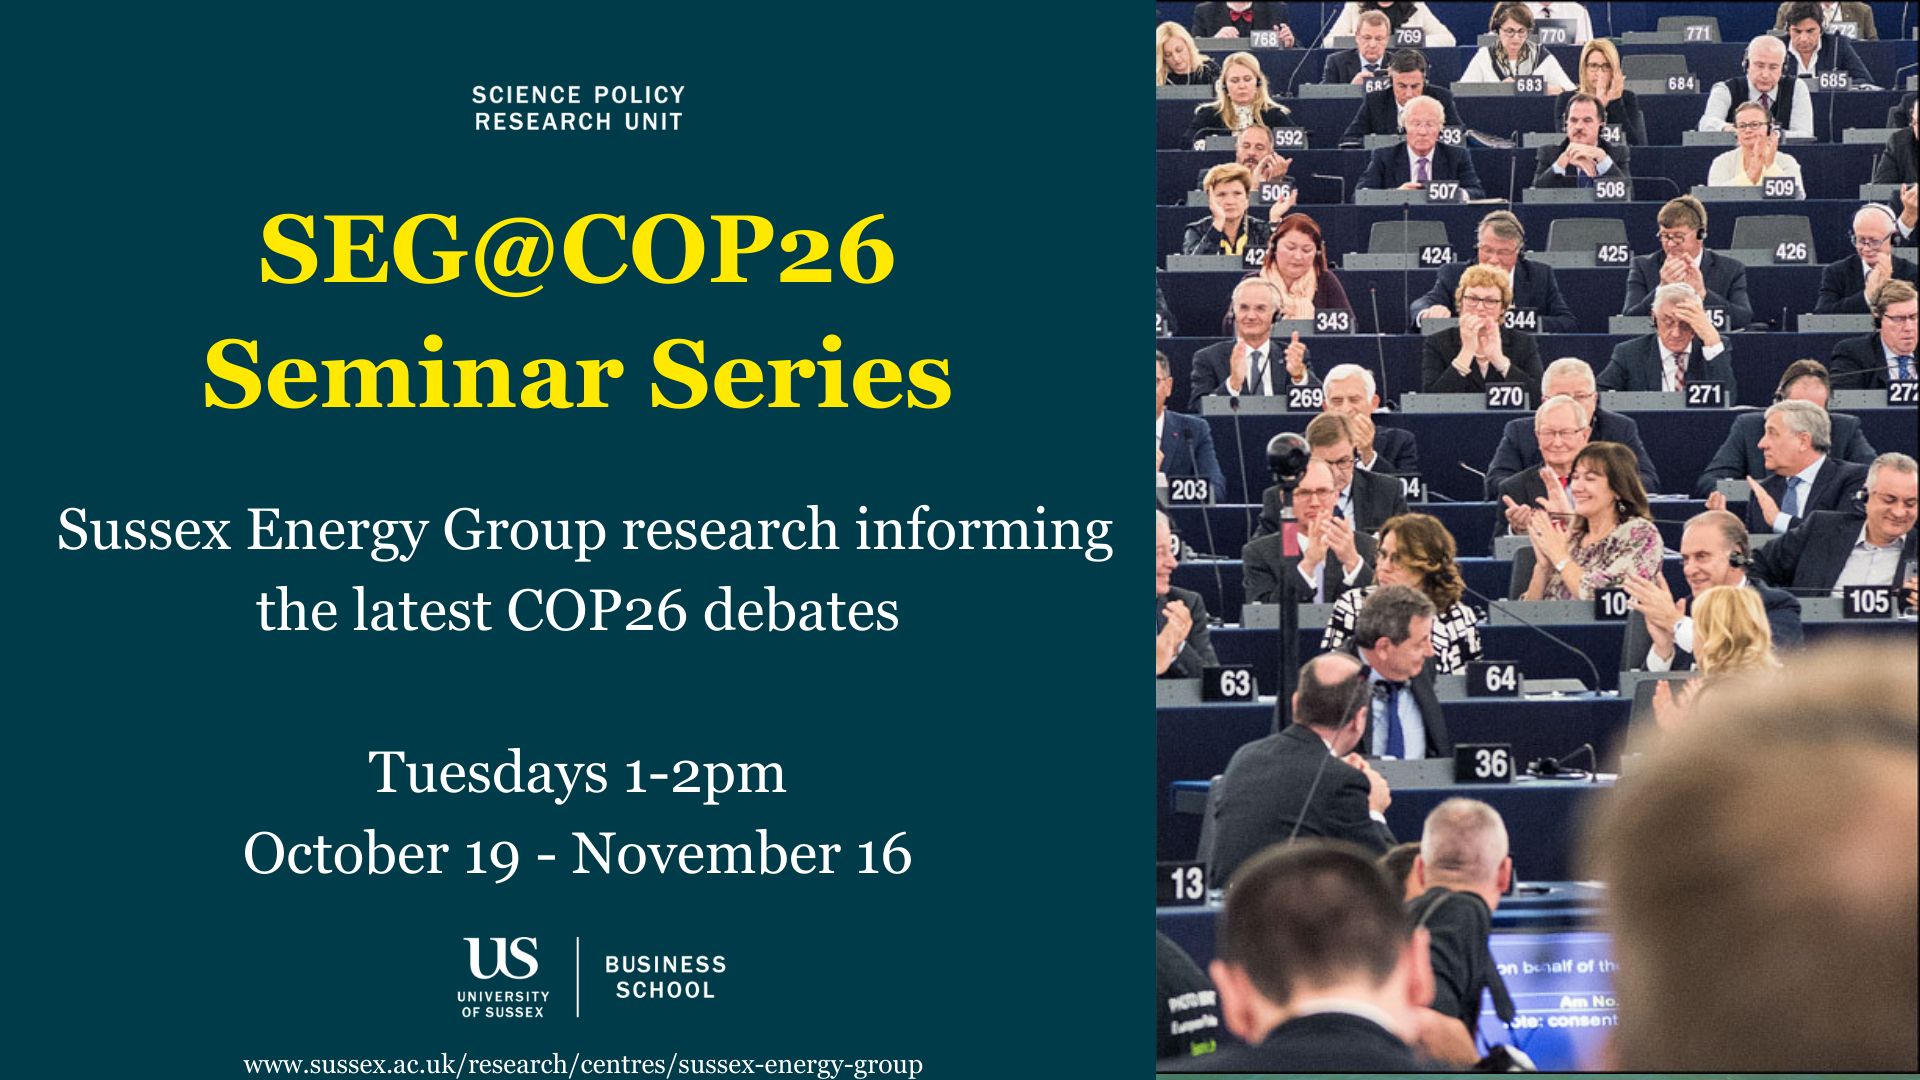
Over the course of the recent COP26 negotiations, the SEG@COP26 seminar series presented the breadth of sustainability topics explored by both SEG and the wider Science Policy Research Unit at the University of Sussex Business School.
Last week, in the closing SEG@COP26 panel discussion, Sussex Energy Group researchers discussed their reactions to the outcomes from the COP.
The panel observed that unproven technologies, such as carbon capture and storage (CCS) and new nuclear reactor designs, dominated discussions both globally and in the UK, despite serious concerns that they can be deployed in time to reach net-zero targets. They also noted the major success stories of the negotiations, including the Global Methane Pledge and Declaration on Forests and Land Use, and outlined the ways that COP declarations can translate to local action.
Panellists sent a clear message that, despite COP26’s shortcomings, there’s real hope to be found at the local level, where upward pressure through ongoing political mobilisation can drive increasingly aggressive climate targets on the global stage.
Selected quotes from the event participant’s views on the COP26 outcomes can be read below. We encourage you to watch the full discussion here. Recordings from the rest of our SEG@COP26 series can be found at the bottom of this post.
Marie Claire Brisbois, Senior Lecturer in Energy Policy at the Science Policy Research Unit and Sussex Energy Group co-director said at the event:
“On another level, I really felt that the conversation at COP was completely disconnected from reality. The formal conversations really focused on unproven technologies and on rapid development in sectors that still have a long way to go, and this is the focus even though we have all sorts of other technologies ready.
The things that we should be talking about are things we’re already familiar with, because they’re ready: things like solar, like batteries. What we ended up talking about was small modular reactors, we were talking about carbon capture and storage, we were talking about hydrogen.
One really good example was on transport day where the conversation focused almost entirely on electric vehicles. We got some good agreements on EVs out of that. But they didn’t talk at all about active and public transport, until a last-minute intervention from someone at the EU who said we have a proven, really effective strategy and you’re not even going to talk about it? Now it’s in there, but it was an afterthought.
So why is this happening, why is the discourse what it is, why do people love hydrogen and not things that we already have like rooftop solar, like energy efficiency, like absolute decreases in energy demand?
And the answer is that it’s about money and it’s about politics.”
“All this stuff that’s happening at the global level is good, we 100% need everybody possible working on making those global agreements happen. We need action at all levels, but really where I’m finding hope and where I’m finding genuine progress is at decentralised levels: so, cities, regions, decentralised bodies that have a bit more flexibility – they’re not tied to corporate lobbyists from the oil industry in the same way as national governments. They have the flexibility and the initiative and the motivation to be doing things like putting in bike lanes, putting in rooftop solar, trying to get community financed home energy retrofit programs off the ground, because these are the technologies that we have available.
The more action that happens at a decentralised level, the more pressure there will be to make more aggressive targets at the national level and to go further in phasing out coal, to go further in phasing out fossil fuel subsidies. This is what we’re engaged in this right now, this back and forth and creating upward pressure to make things happen.”
Lokendra Karki, Research Fellow on the LANDMARC Horizon 2020 project commented on the COP’s important developments relating to the Agriculture, Forestry and Other Land Use (AFOLU) sector:
“First of all, land-use mitigation is needed, it is contributing around one quarter of anthropogenic GHG emissions and it also has a mitigation potential of up to 23 gigatons CO2 equivalent per year. Land-use based mitigation also contributes to sustainable development, by maintaining land productivity, improving food security and biodiversity conservation as well as preventing land degradation.
The most important declarations at COP26 were the Global Methane Pledge and the Declaration on Forest and Land Use.
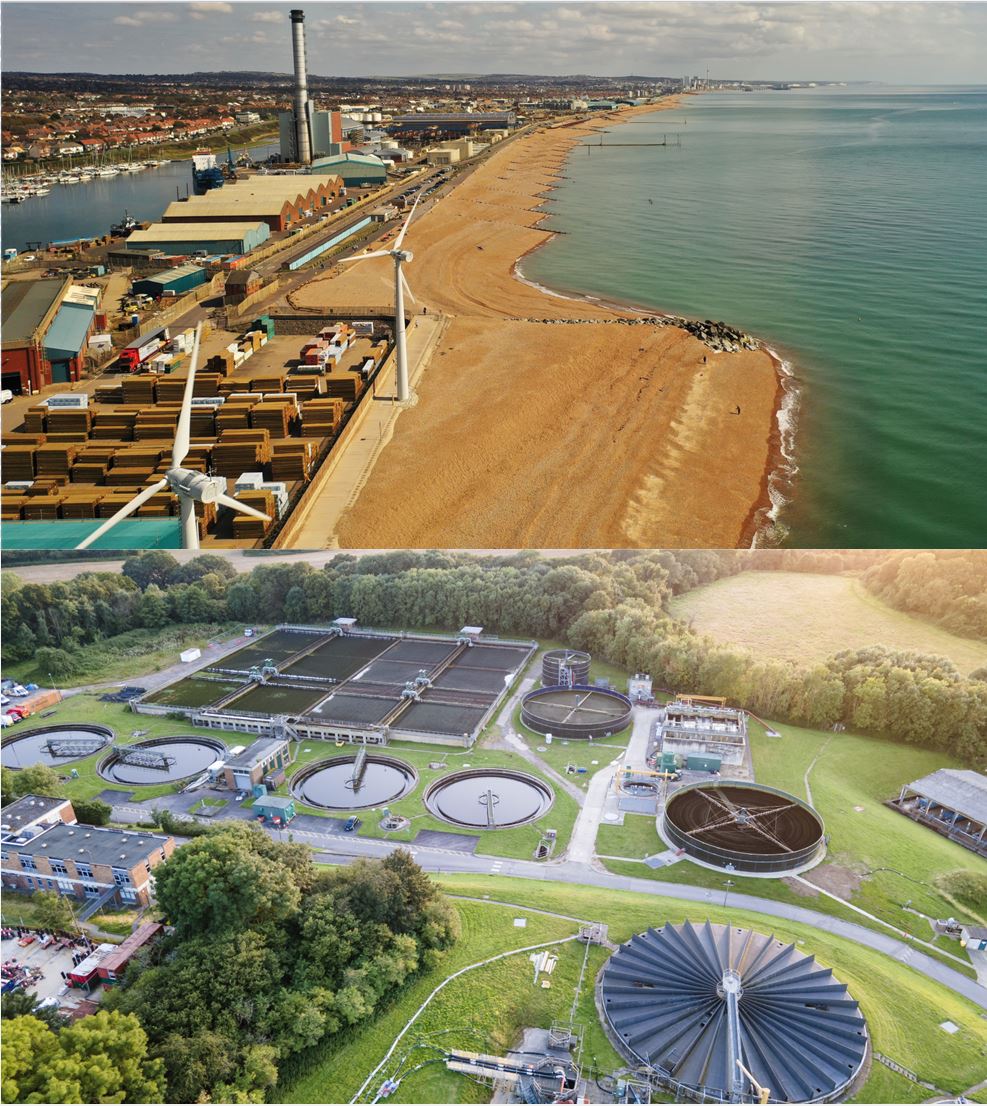
The COP26 Global Methane Pledge was initiated by the US and agreed to target oil and gas, which constitutes 35% of methane emissions, and it also effects the agriculture sector which is 40%, and waste which is 20%. The pledge says they will reduce methane emissions by at least 30 % below 2020 levels by 2030. It is important because more than 100 countries already signed, including 15 out of the 30 top emitters: United States, Brazil, Indonesia, Nigeria, Pakistan and Mexico. It is one of the main highlights of the event.
The Declaration on Forest and Land Use says we will stop deforestation by 2030. It was praised because 141 countries with about 90% of the global forest already signed. It also urges sustainable land use transition through sustainable agriculture, sustainable forest management, forest conservation and restoration. Forest management can mitigate up to 1.6 gigatons of CO2 per year. The pledge has already achieved £9 billion in funding.
There are also concerns of some walk back. Also, funding is not conditional to new logging concessions. It is likely that new policies do not fully protect rights of the indigenous people residing in the forests, which will threaten their culture and livelihoods, and create conflict.
Declarations on Forests and Land Use and the Global Methane Pledge were the major highlights in terms of land-use based mitigation. There are also promises of increased funding for the developing countries for emission reduction and adaptation to climate change. 100 billion dollars was targeted by 2020, which never happened, but they said they would continue to increase funding for the developing countries.
In my view, COP26 is not a breakthrough event, but it has big promises which are creating hope for the future. We can say is it one stepping-stone to meet the Paris Agreement’s goal for reducing net emissions. But the success of COP26 depends on how these pledges are realised in the coming years, otherwise, although there will be climate policies, mitigation policies and targets, countries will continue to damage the atmosphere.”
Ralitsa Hiteva, Senior Research Fellow working on business models, innovation and net zero for the Centre for Research into Energy Demand Solutions (CREDS), highlighted the importance of how Net Zero is achieved, alongside our perceptions of uncertainty in the implementation of net-zero, and their potential impact locally.
Ralitsa specifically addressed net-zero concerns in the Sussex context, and how these findings from her recent study of the values stakeholders associate with Net Zero related to outcomes of the COP26 negotiations:
“One of the surprising things that we found out is that apart from social, economic and environmental values, there was a fourth value which emerged and that was how we get to net-zero was as important as getting to net-zero. So that basically means that there is significant importance to local partnerships, to the recognition of contributions made by formal and informal activities and communities.
And they are one of the things that I think we should be talking about when we think through the meaning of the COP26 outcomes: this element of translation locally. If we want to make sure that the good intentions that we are building and representing in the language of the agreement are not lost, and that they are actually able to manifest as a real change locally. We need to crack the missing link of what else do we need to do in order to make sure that this kind of stumbling blocks of uncertainty that a lot of companies and community-based and decentralised action are actually facing.
I have to say that I would like to link this to a disappointing element of the UK Net Zero Strategy that was focused on investment on infrastructure technologies alone. A lot of which, as Marie Claire mentioned, are quite unproven and quite perhaps dangerous, environmentally speaking and sustainably speaking technologies because they have been unproven and untested. While there were limited, to no provisions for small scale, community-based actions and solutions.
However, the Net Zero Strategy does support industries that already exist, following a well-recognised way of accumulating economic growth or recognising existing capabilities, power and agencies, and incumbent sectors and practises. What is missing is that recognition that these kind of investments in infrastructure alone do not actually translate automatically into value, particularly value, which can be created and captured locally.
This really matters when it comes to thinking about Net Zero as a project which has to manifest at the subnational, regional, urban and local level, and to actually be able to attract the necessary levels of investment and take up, translating into mass scale behavioural change.
It is linked to the ability of places, of people, of industries to be able to recognise the values that they associate with net-zero and to be able to capture them locally. And this is where I think this missing link is really important. We need to figure out what is it that we need to put out into the world in order to help this translation, to lower the levels of uncertainty and to make sure that people actually are able to create and capture more value locally, so that Net Zero actually works on a much grander scale.”
Phil Johnstone, Senior Research Fellow in the Science Policy Research Unit, discussed his views on the three ‘D’s: directionality, discontinuation, and defence.
“I think ultimately the conclusions about whether you call the outcomes good or not really depends on the vantage point you’re looking from. We find comfort in the idea that science will deliver answers, but whether the outcomes of COP were good or bad really depends on your outlook in terms of non-scientific things, namely your beliefs and your trust in politicians and states to deliver. This relates to the core difference between pledges and actions.
From the perspective of Pacific Islands and many indigenous groups, things don’t look good. The gap between pledges and current actions does seem to be considerable. But for others, things are a bit better; for the first time we have this fossil fuels in a statement. And there’s this new emphasis on urgency, and the 1.5C 2030 horizon, which is significant. You have the South African coal phase out, and a just transition plan, which could be a template for further action. But I remain sceptical about what these global agreements can deliver. It depends on whether national commitments are adhered to or not.
“If we take the UK as an example, there’s this constant rhetoric where we ‘need everything in the mix’ for low carbon. Yet in the context of the urgency regarding 1.5°C and 2030, this really does seem a bit silly. The short timeline to 2030 suggests the need to prioritise certain technological trajectories, and not others. The fastest and cheapest, most job intense way to decarbonise is massive demand reduction and renewables. The UK housing stock is a mess, for example and lot can be done on that front in terms of demand reduction. Things like new large nuclear reactors as well as small modular reactors are a waste of time and money detracting from rapid solutions that we know work. In the context of the urgency surrounding COP, I would say that every pound invested in immensely costly and much delayed nuclear actually detracts from the 2030 goal as they can’t be built fast enough.
Yet governments like the UK are obsessed with these kind of technologies that are not going to be ready in time. Rather than magical technological solutions, in rich countries we should be taking our responsibilities seriously and changing behaviour. I’d say this involves us radically doing less and discovering a new abundance not based on materialism and consumption, but rather seeing the benefits of a slower, more local, less intense lifestyle. The benefits of less work, less travel, more time with family and community, more leisure time. These benefits could be part of a positive vision for rapid CO2 reduction.”
“I saw another blog post recently by Mike Hulme, and he said we have to beware of the metaphors and chasms and cliff edges. If we recall, Gordon Brown announced that Copenhagen was our last chance to save the world. So what about this COP? But as other speakers have alluded to, any particular set piece negotiation at the global level will never be our saviour. Politicians and incumbents are not coming to save us. It is not chasms and cliff edges but rather a continual process of challenging systems of power and unsustainability. So turning pledges into action will as ever, not be enacted by ‘policy makers’ and politicians of their own volition but will only come through political pressure. In understanding this messy world of policy and politics, much of the research that takes place at SPRU has never been more urgent and useful.”
Recordings for the rest of the series can be watched here:
Benjamin K Sovacool – Decarbonisation and its discontents 19.10.21
Imogen Wade & Carla Alvial Palavicino – Transformative outcomes & a TIPC learning game about system changes 26.10.21
CINTRAN – Roberto Cantoni & Marie Claire Brisbois 02.11.21
Just Transitions : the governance and institutional gap in the UK – Abigail Martin & Max Lacey-Barnacle 09.11.21
Sign up to the Sussex Energy Group newsletter
Follow Sussex Energy Group