

The aim of this post is just to give a very quick overview of a joint project between the Library and the Data-Intensive Science Centre at the University of Sussex (DISCUS).
This began with a successful proposal to the 2024 Development Studies Association (DSA) conference by Danny Millum, Paul Gilbert and Alice Corble, to run a panel entitled ‘Decentring development thinking by engaging with archives’.
Danny and Alice, along with Tim Graves from the Systems Team, then decided to submit our own paper to the panel (which surprisingly enough was accepted!), entitled ‘Camels and chatbots: an experiment in applying AI technology to the BLDS West African Economic Journals’.
This paper would ‘draw on previous collaborative analysis of the British Library for Development Studies Legacy (BLDS) Collection, which involved using metadata from the collection to create a mapping tool to contrast its provenance with that of the main library collections at Sussex and use this to explore the potential for applying decolonial approaches to library discovery and research’.
This time though, the aim was to move from metadata to the data itself, inspired by yet another project (undertaken in collaboration with the University of Manchester) which was digitising another part of the BLDS collections, the rare West African Economic Journals.
This provided a unique corpus of Global South-originating materials on which to explore the potential of a variety of AI tools, including chatbots, text and image analysis, and visualisation. Out of these journals we focused on the Camel Forum Working Papers from the Somali Academy of Sciences and Arts, hoping these would generate lenses on technological development discourse that offer a radical departure from traditional Global North analytical norms.
So we had an overall idea and some materials to work with, but were still a bit vague about how we might deploy the myriad new AI tools becoming available. We basically took two main approaches:
1. CamelGPT
The first approach was to create a LLM limited solely to the Camel Forum Papers. This has yielded various decolonising-adjacent possibilities, some very straightforward in that the papers are now available to Somali researchers to interrogate via the CamelGPT.
Others are less straightforward or less proven – we need researchers to try and break the model to see how accurate its superficially plausible responses are, and we’d also like to find some way of comparing and contrasting the responses we are getting here to a comparable subset originating from the Global North.
A further note – and many thanks to our digital humanities colleagues Jonathan Blaney and Marty Steer here – relates to issues of language. We’d initially claimed that CamelGPT (and by extension ChatGPT) was ‘language-agnostic’ – that it would treat its contents equally no matter what language they were in, that we could ask it questions in any language, and we could get replies in any language.
However, this doesn’t stand up to scrutiny. The Arabic corpus is smaller than the English and French corpora. So this increases the chances that if you ask CamelGPT a question in Arabic it could:
- simply not understand your question
- give you an answer in a faulty rendition of your language, on a scale of questionable -> nonsensical
- misunderstand your question and give you clearly incorrect or dubious answers
- misunderstand your question and give you plausible but incorrect results that you don’t know are incorrect
In fact, there’s already a growing corpus of evidence that chatbots are significantly less capable in languages other than English.
We also need to bear in mind that no training has occurred here. The instance of ChatGPT we are using was still trained using a standard corpus of text from the World Wide Web, and so still reflects many of the biases that are present in human language. So, for instance, in some word vector models, “doctor minus man plus woman” yields “nurse.”
Obviously, we’d like to try and train up our own LLM with Global South biases – but we haven’t YET been able to do this. We must hence acknowledge that the tools we are playing with here are likely to be conditioned by the algorithmic biases and oppressive logics that underpin Global North information spheres.
2. BERTopic
At the same time however DISCUS were looking for library projects that they could use as pilot projects. We therefore proposed the following to them:
“To explore the potential of AI to surface knowledge from a digitised collection of rare West African Economic Journals: The Camel Forum Working Papers.
We plan to experiment with a range of AI tools: text mining/analysis, chatbots, image analysis and data visualisation. One outcome would be to develop an LLM chatbot to interrogate the corpus: the intention being to compare and contrast the responses this generates with that produced by generic ChatGPT.
We anticipate that AI will offer a radical departure from traditional Global North analytical norms and want to test this hypothesis and problematise any outcomes.
We have already been accepted to speak at SOAS in June to present our experiences up to that point in the project.”
DISCUS accepted and we were assigned to work with Dr Chloe Hopling under the watchful supervision of Professor Julie Weeds.
We then shared the Camel Forum Working Papers which had been scanned, PDF’d and OCR’d.
Chloe then started work.
Her first step just to get a feel for manipulating this dataset was to load the dataset into Python and generated a frequency distribution showing the top 20 most common words in the sample document given.
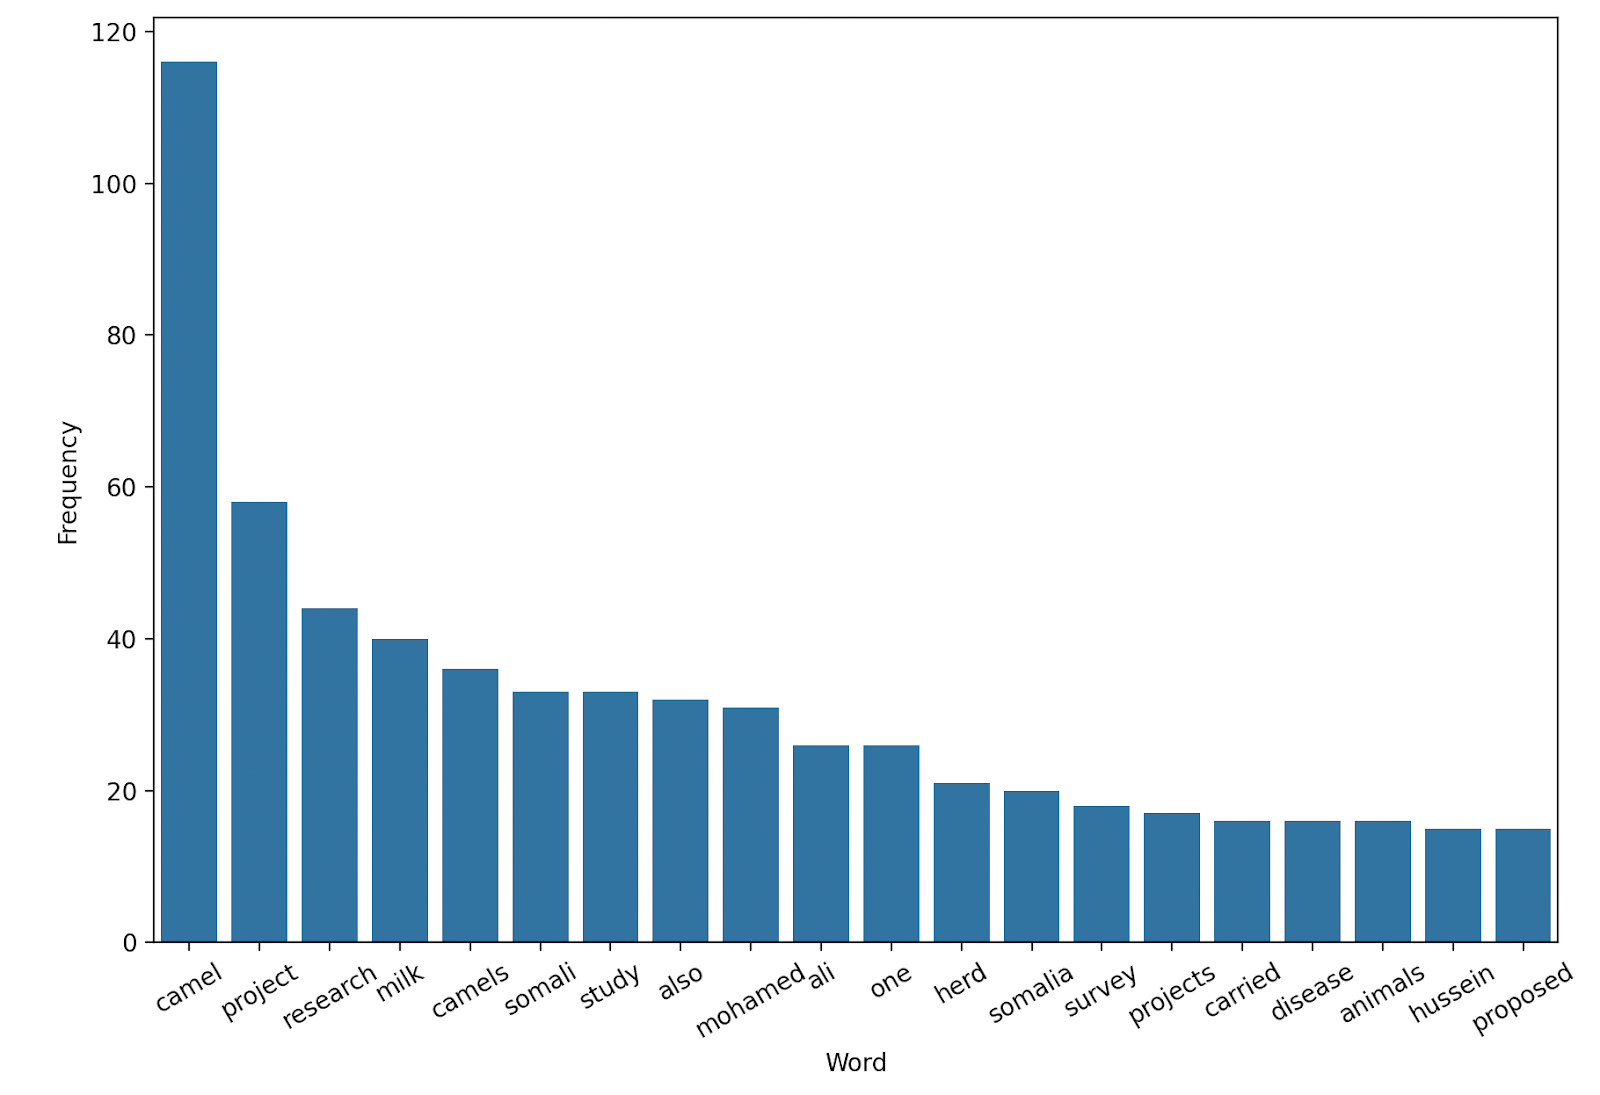
Strangely enough ‘camel’ came out on top…
Next, she applied a couple of approaches to help group similar words by normalising them, in the document to their roots, stemming and lemmatization:
- Stemming removes affixes – computationally fast, but the stemmed word doesn’t always have a meaning e.g. anim as the root of animal. (But this can still be useful depending on the application)
- The lemma of a word is produced by taking into account context and converts the word into its meaningful root. This can be computationally slower depending on the size of the body of text, but gives a real word as the root.
Below we can see the frequency distribution for these two normalisation approaches.


BERTopic is a machine learning tool that helps us understand texts by automatically finding and grouping similar words.
It identifies key themes and patterns.
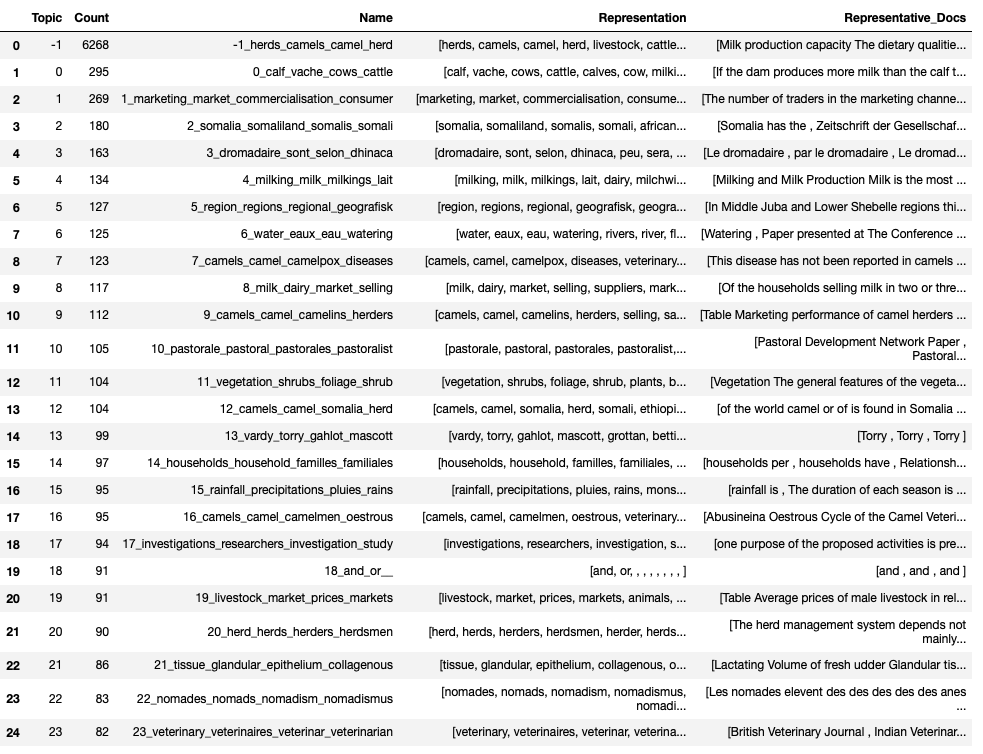
It has gone through all the 37 Camel Working Papers and identified the most common groupings of words, to create ‘topics’ of 4 words, and then assigned sentences to these topics.
For those interested in a slightly more technical explanation, BERTopic captures the semantic meaning of each sentence by generating a numerical representation of the sentence. We call this process embedding. Using the sentence embeddings BERTopic can then cluster sentences with similar meaning and identify topics (clusters of sentences with similar meaning). BERTopic summarises these topics by selecting words from within the cluster that it deems to best represent that topic (Representation) and providing the sentences that best represent the meaning of the topic (Representative Docs).
Here’s how the original listing looks (note that Topic -1 is the label given to sentences with no topic).
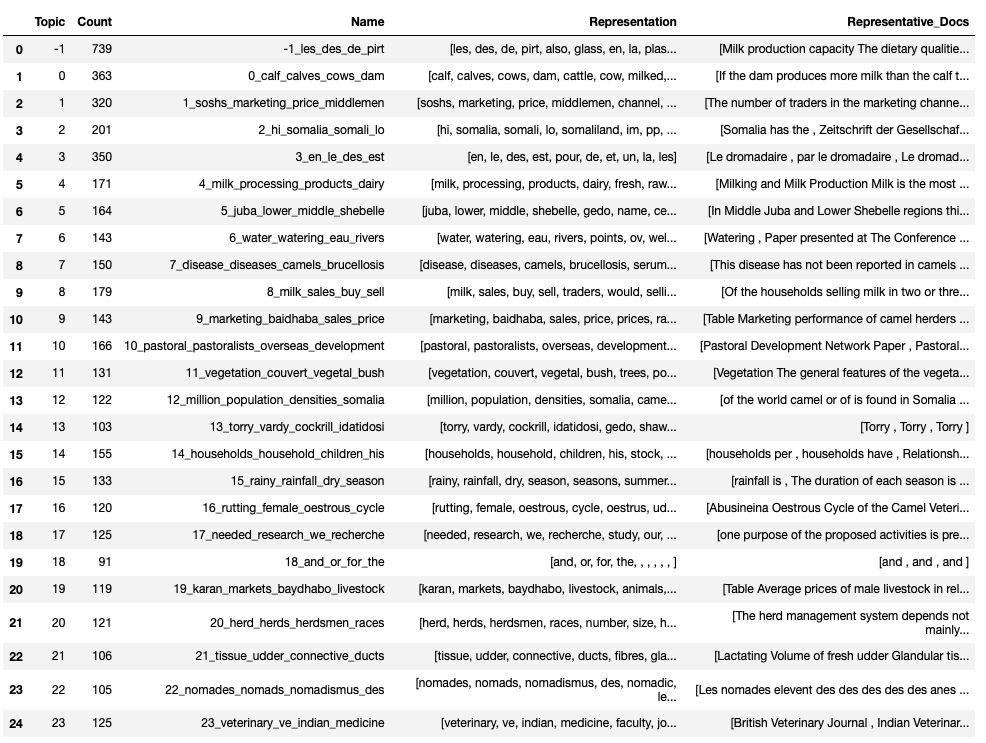
Next up Chloe refined this by reducing the number of outlier sentences – sentences have been added to their nearest topic if they meet a certain threshold criteria.
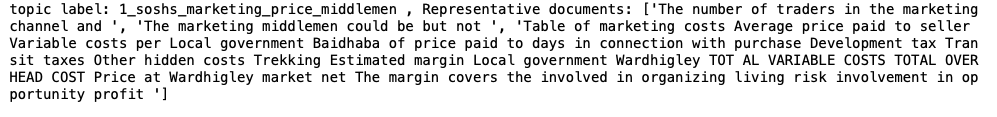
Chloe also checked that the sentences being assigned to topics seemed reasonable by looking at some examples of representative sentences for a topic:

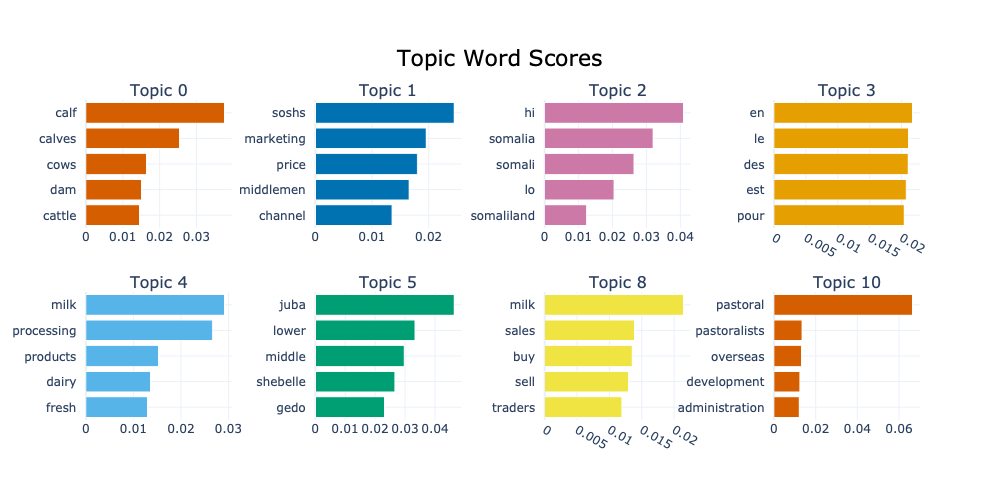
We can now see the top topics, and their most frequently occurring words:
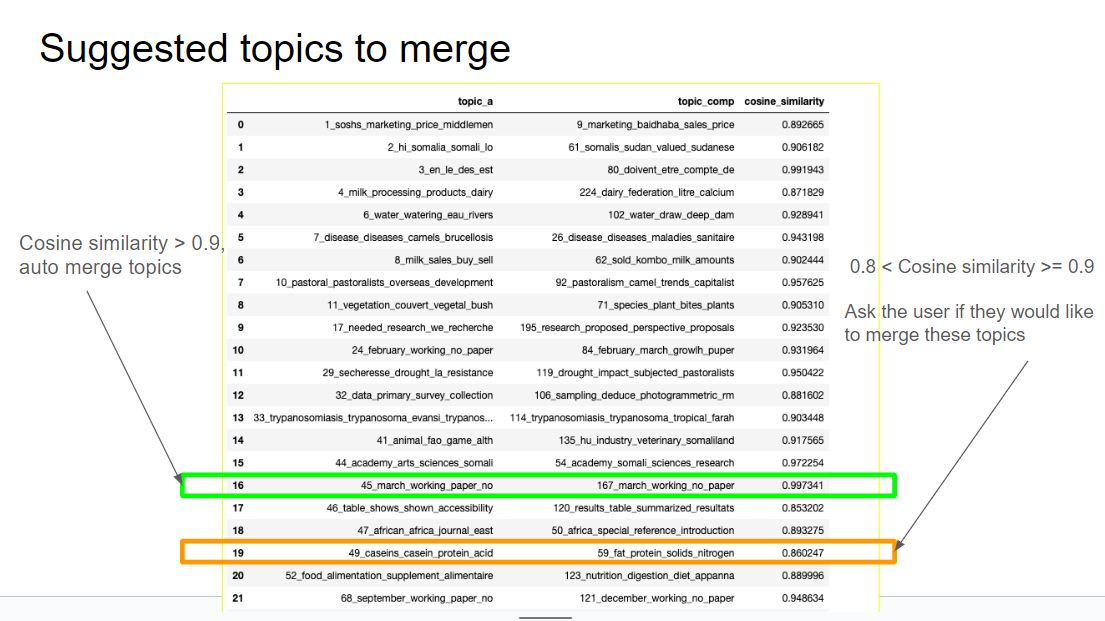
It’s also useful to try and reduce the number of topics where there is overlap, and the image below shows how Chloe generated a cosine similarity score between 0 and 1 (1 being the most similar), allowing us to merge the most similar topics:
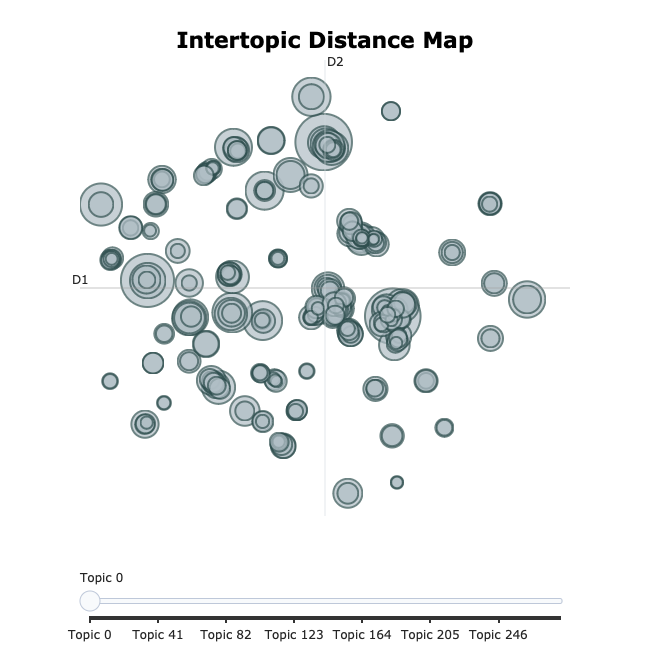
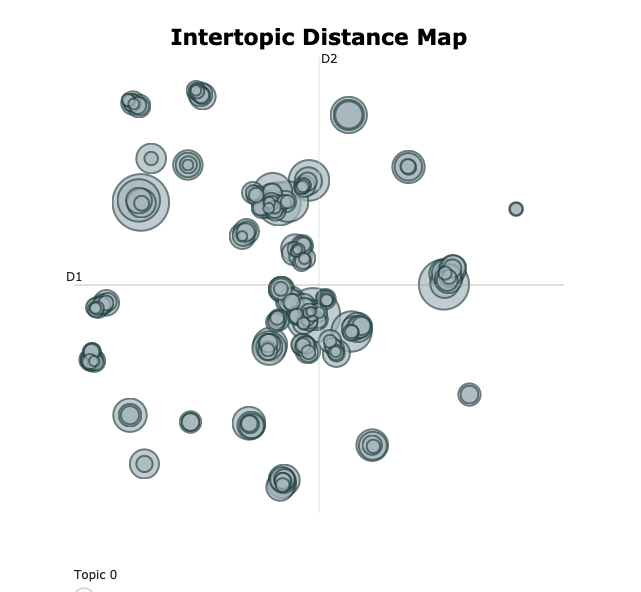
Chloe also produced some intertopic distance maps – basically the bigger the circle, the more frequently a topic occurs, and the closer the circles the more more similar the topics are. On the left you have a pre-merging map, and on the right a post-merging map.
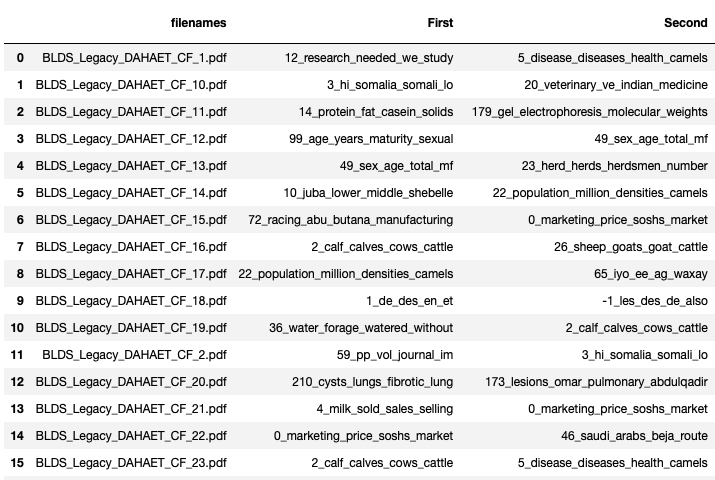
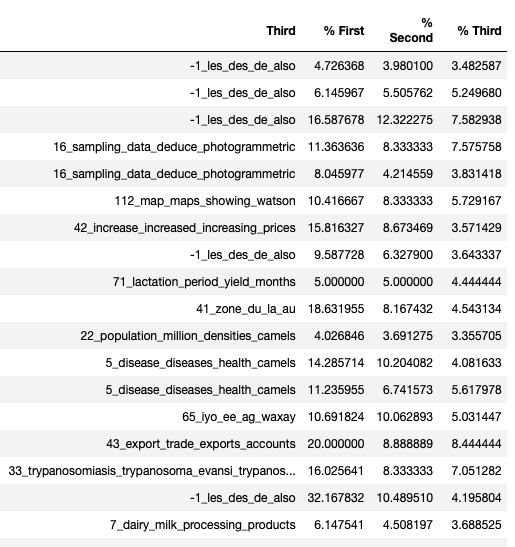
We can also look at each document – and see what the top topics for each document are:
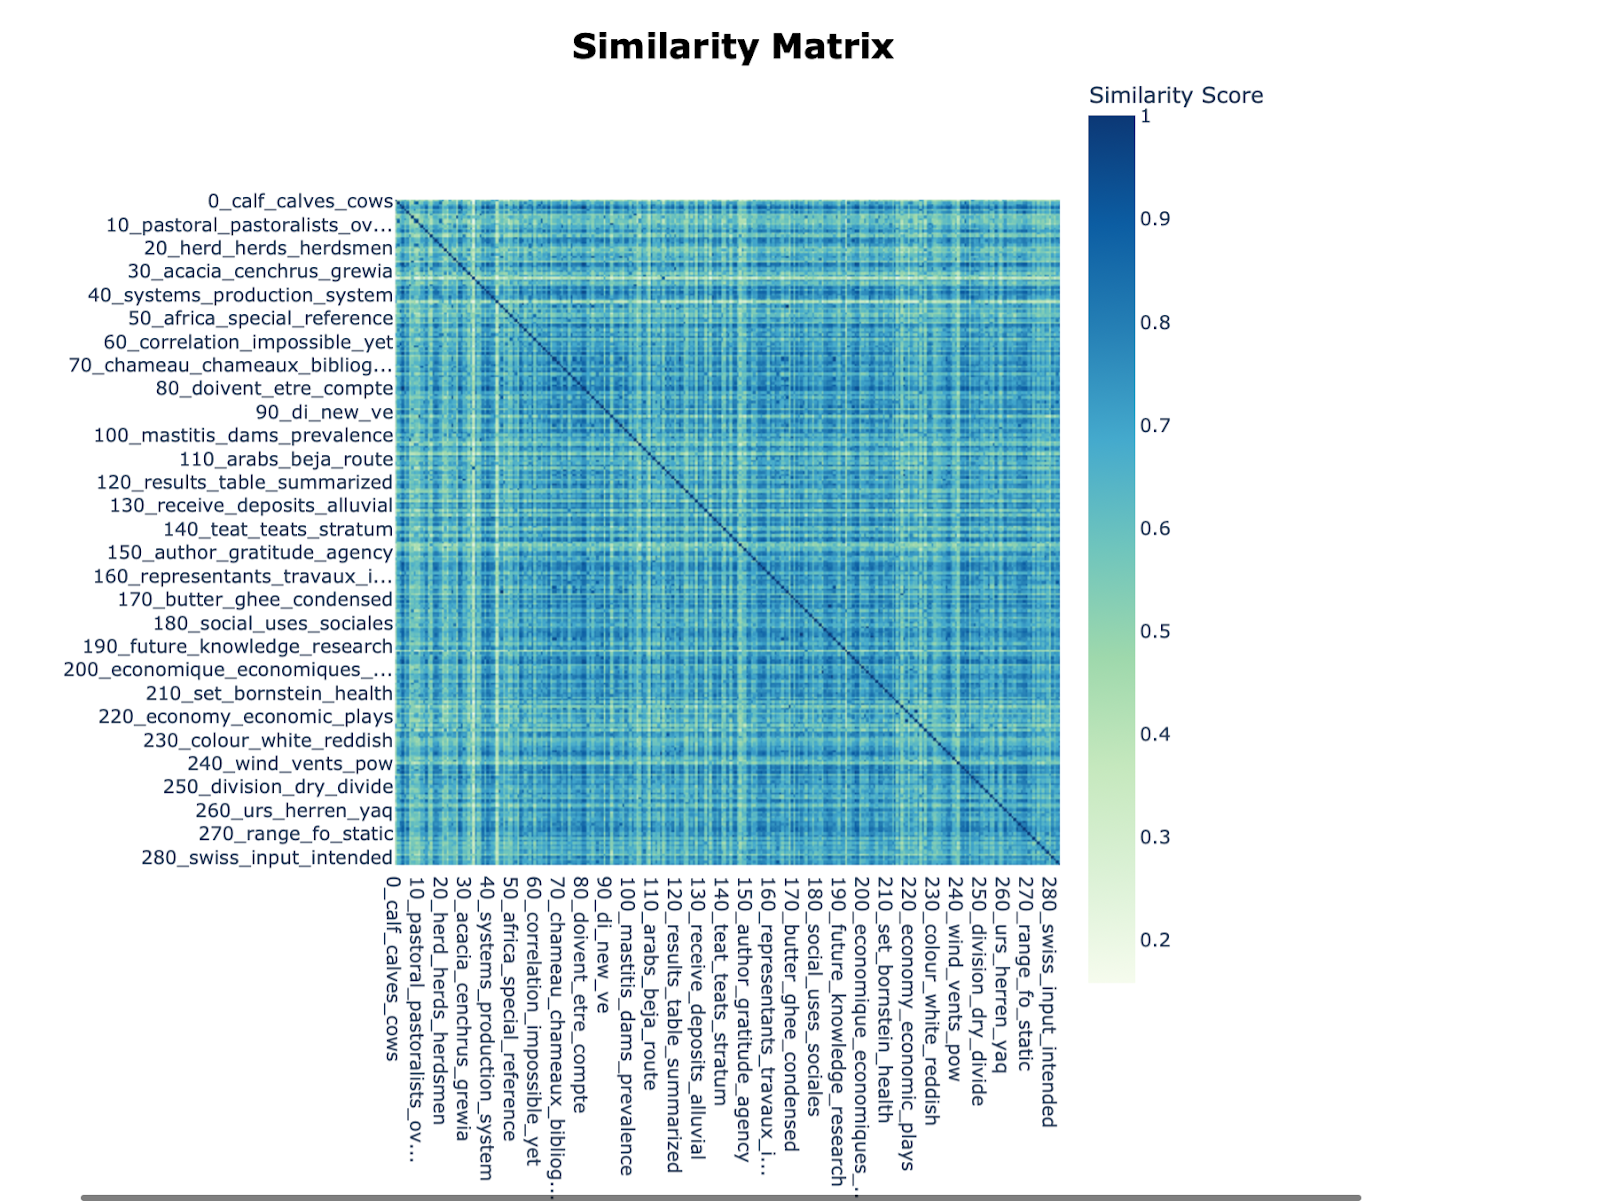
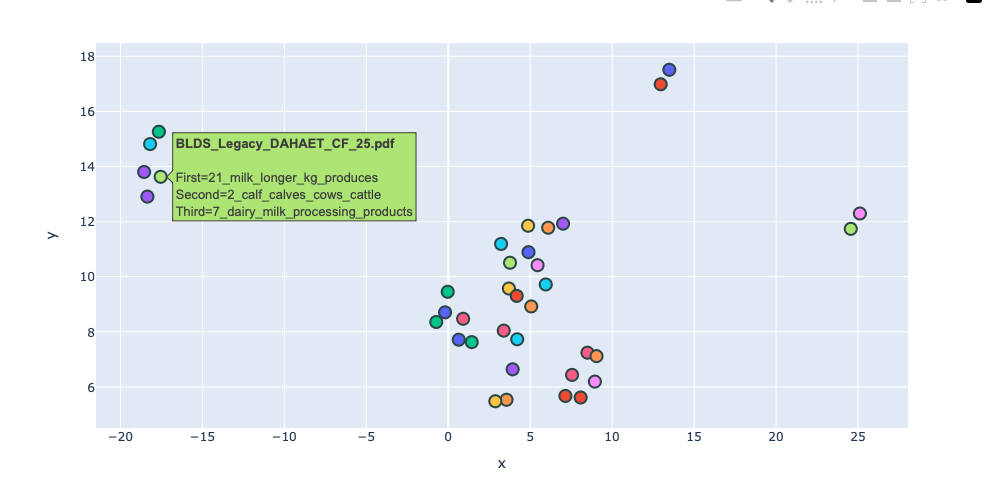
And lastly we can use this to produce a document similarity map, which should show how similar the documents are, and group together those which share the most similar topics:
As an adjacent issue Chloe also looked into how OCR noise might affect our findings.
BERTopic automatically identified a topic that seemed to contain mostly OCR noise:
“’of th tr th co to SC Re si of Pr we ir ic lE sj Cc pl SC tl a p M BI BI BI Unknown ‘”
“II I I f II II, Id, ‘ Id 1 ii I 1), I ” /I 1)1 Jl, “” 1/l, IIJ) 11111, 1 Ii pl. I “”•
11, 11 I, , Ill I I rl I • / 11111,11 1 I d Ill II rill• I> ,y
” ‘ ,1s n lt,1 11 111 . 1q11Jr,,11y Il l I, I II Ill• l 1, Ii , IH 1 1 , , m, I 1 ‘”
and group these together into one topic, which makes up about 800 sentences (~4% of the total) sentences) in the collection. There are probably more sentences in other topics that will have some (potentially minor) OCR noise but these ones seem to be the ones with major OCR noise.
Conclusion and next steps
As we’ve explained above, we’ve used a Jupyter Notebook and the BertTopic tool to topic model the Camel Papers. With this approach the only text corpus the tool has been exposed to are these 37 working papers, and the topic clusters and themes that it is drawing out should be solely intrinsic to the papers themselves.
Even from our quick whizz through here, where we’re trying to show what we’ve done in the best possible light, there are all manner of glitches and issues with these topics (for instance, some sets of words have been grouped together just because they are all French).
So refining the process is definitely going to be one of the things we concentrate on next.
Another is going to be trying to use it to compare different corpuses. As part of a related project, we plan to digitise the radical Tricontinental journal produced by OSPAAL in Cuba, and our initial thoughts are that we might take these mid to late 20th century new left anti-imperialist texts and compare them with the Internet Archive’s repository of the original writings of Marx and Engels.
Oh, and Tricontinental also has a wealth of images, which is another AI area to explore…
But for these and other projects to progress, we need our third wheel. Alongside collection librarians and digital humanists, we need to enlist the help of experts in the field, ideally researchers based in the Global South, to tell us which collections which should be prioritising, what questions to ask, and how valid the answers and the modelling we are producing are.
Leave a Reply