
 31 May 2022
Ruby Acquah and Mattia Di Ubaldo are Fellows of the UK Trade Policy Observatory and Research Fellows in Economics at the University of Sussex Business School
Tensions over the Northern Ireland Protocol (NIP) have intensified as the UK Government (henceforth HMG) announced plans to introduce legislation that would enable it to disapply parts of the Protocol. The UK has often demanded the re-negotiation of the NIP due to its economic costs, and a too strict application by the EU. Recently, Assembly elections in Northern Ireland escalated the urgency of resolving the issue, as the Democratic Unionist Party (DUP) is currently refusing, as part of its protest against the NIP, to participate in the power-sharing executive.
Given the foregoing, we have examined trade data to shed light on three key issues:
We conclude that with 60% of Northern Ireland’s (NI) imports coming from Great Britain (GB), the importance of East-West trade is undisputable. The barriers created by the NIP that affect trade from GB into NI were always bound to result in shipping delays and higher costs to trade. In this context, the increase in NI imports from the Republic of Ireland (RoI) in 2021 could suggest that some firms in NI have started to find alternative suppliers. However, whether the NIP creates ‘serious economic difficulties’ that are ‘likely to persist’, or a ‘diversion of trade’ (the grounds to invoke Art. 16 of the NIP) is yet to be determined.
The policy context
To avoid a border on the island of Ireland whilst at the same time protecting the integrity of the EU Single Market, the NIP placed a custom and regulatory border between NI and GB. Products moving from GB to NI must be shown to comply with EU standards which, especially in the agri-food sector, implies a list of documentary, identity, and physical checks. These new procedures have resulted in increased paperwork for firms, likely higher costs to move products into NI (due to agents’ and hauliers’ fees, and increased staff time), and longer shipping times.
In response, HMG has recently proposed legislation that would allow the unilateral suspension of parts of the NIP, to eliminate all checks for goods shipped from GB intended for exclusive sale within NI and allow producers of such goods to adhere to UK standards only. Checks on goods destined for the RoI would be retained, with the identification of such products the responsibility of traders operating under a ‘trusted trader scheme’. In addition, the UK wants to allow NI businesses to choose between UK or EU standards, regain the power to apply UK VAT rates in NI, and reduce the role of the European Court of Justice in overseeing the NIP. In sum, the UK believes that a light-touch approach to the border issue is enough to protect the EU Single Market.
The EU’s response will most likely depend on the extent to which the UK deviates from the current arrangements (i.e., if some checks are to be maintained), and the modalities in which the suspension of the NIP will occur (i.e., either through the legal framework provided by Art. 16 of the NIP or by internal law acts that bypass the obligations in the NIP). We refrain from analysing the legality of the actions currently considered by HMG and the possible responses of the EU. Instead, we examine trade patterns to help situate the dispute over the NIP into an economic context.
Where do Northern Ireland’s imports come from?
The NIP only affects trade flowing from GB to NI, as in the opposite direction HMG has promised the absence of barriers to GB for NI exporters.[1] Hence, we will focus our analysis on NI goods imports.
In Figure 1, we use Broad Economy Sales and Exports Statistics (BESES) data available up to 2020 to depict NI imports from GB, the RoI, the Rest of the EU (REU), and the Rest of the World (RoW), both in values and as shares of the total. GB is by far the NI’s largest goods supplier, with over 60% of NI’s imports sourced from the rest of the UK. This is salient if compared to the RoI (10-15%), and denotes the predominance of the East-West trade direction over the North-South one. However, GB’s share in NI imports has contracted compared to the pre-2016 referendum years, while that of the RoI and the REU has correspondingly increased. Overall, the relevance of NI inward trade from GB helps to understand why HMG is resolved to make trade between the two regions as frictionless as possible.
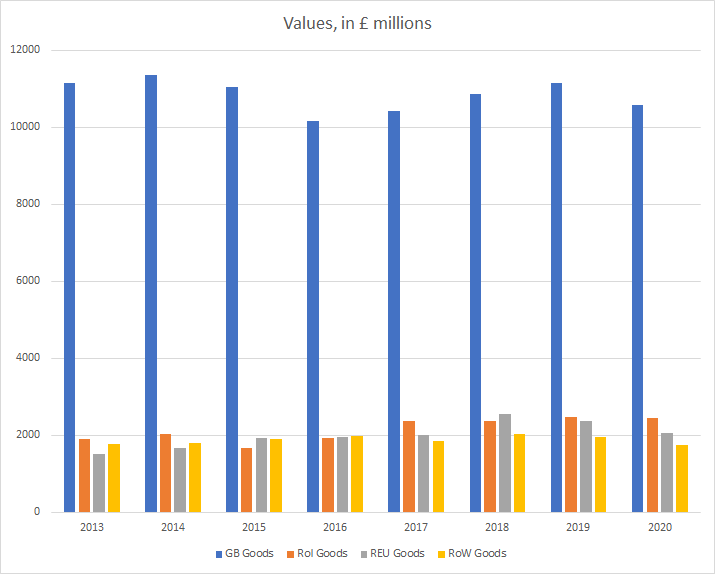

FIGURE 1: NI EXTERNAL PURCHASES BY ORIGINS
Source: BESES Data
Is NI trade skewed towards ‘checks-intensive’ products?
Agri-food trade has been in the limelight due to onerous levels of documentary and Sanitary and Phytosanitary (SPS) checks that these products incur when crossing the EU border. On March 4th 2021 Denis McMahon, the DAERA[2] Permanent Secretary, noted that about 25% of freight units entering NI from GB were carrying goods subject to SPS-checks; out of which 71% were retail products.[3] This suggests that the NIP is mostly affecting the food distribution system.
Table 1 presents a disaggregation of NI imports by industries[4] for UK and non-UK origins in the pre-NIP application period. We show average purchases over the period in columns 1-2, and the associated shares of purchases from the UK out of the total by industry in column 3 (e.g., £6.264 billion of manufacturing purchases came from the UK on average over the 2018-20 period, which corresponds to 69% of total manufacturing purchases; the remaining 31% (figure not shown) came from non-UK origins). Lastly, columns 4-5 show the share of each industry in total purchases by origin (e.g., manufacturing accounts for 23% of all purchases from the UK whereas the £2.845 billion of manufacturing purchases constitute 43.5% of all purchases from non-UK origins). Thus, these latter two columns describe the composition of trade by industry.
It is important to clarify that the data used in Table 1 do not allow us to distinguish between what NI firms source from GB from what they buy locally in NI, as NI and GB are lumped together in ‘UK origins’. However, due to our interest in NI-GB trade here, we use the aggregate data (used in Figure 1) to get an approximate value of GB’s share in ‘UK origins’. We compute the share of NI firms’ purchases from the domestic (NI) market to be 50% of the total (figure not shown), 30% is sourced from GB, and the remaining 20% jointly from RoI, EU, and RoW. Therefore, purchases from the UK (NI + GB) account for 80% of the total, with 30/80=37.5% of what NI firms buy from within the UK coming from GB.
Importantly, NI purchases from the UK, including GB, are heavily skewed towards wholesale and retail trade (58.4%, column 4), while non-UK sources, including RoI, are instead relatively more focusing on supplying manufactures (43.5% vs 23% from UK). If items for the distribution sector were on average more intensive in border checks than manufactures, one can see the root cause of HMG’s concern.
TABLE 1: NI AVERAGE PURCHASES OF GOODS BY INDUSTRIES
|
(1) |
(2) |
(3) |
(4) |
(5) |
|
|
Industry (SIC 2007) |
UK, avg. 2018-20 |
Non-UK, avg. 2018-20 |
% UK |
% total UK |
% total non-UK |
|
Agric., Forestry & Fishing |
42.3 |
7.0 |
86 |
0.2 |
0.1 |
|
Mining & Quarrying |
148.8 |
28.3 |
84 |
0.5 |
0.4 |
|
Manufacturing |
6264.3 |
2845.5 |
69 |
23.0 |
43.5 |
|
Utilities |
* |
* |
* |
* |
* |
|
Water Supply |
199.6 |
29.5 |
87 |
0.7 |
0.5 |
|
Construction |
2175.8 |
170.1 |
93 |
8.0 |
2.6 |
|
Wholesale & Retail Trade |
15871.3 |
3125.1 |
84 |
58.4 |
47.7 |
|
Transportation & Storage |
830.8 |
128.6 |
87 |
3.1 |
2.0 |
|
Accommodation & Food Services |
570.1 |
94.3 |
86 |
2.1 |
1.4 |
|
Information & Communication |
124.3 |
28.7 |
81 |
0.5 |
0.4 |
|
Real Estate Activities |
* |
* |
* |
* |
* |
|
Prof., Scientific & Technical Activities |
256.5 |
32.7 |
89 |
0.9 |
0.5 |
|
Administrative & Support Services |
260.3 |
47.0 |
85 |
1.0 |
0.7 |
|
Others |
434.7 |
9.3 |
98 |
1.6 |
0.1 |
|
Total |
27178.8 |
6546.1 |
100.0 |
100.0 |
Source: BESES Data. Notes: Figures are disaggregated by SIC 2007 industries. All values are in £millions. * Denotes suppressed values due to confidentiality.
The current trend in NI imports from extra-UK origins
We now look at NI import patterns post-NIP application using HMRC regional trade data, available for 2021.[5] An important caveat is that for 2021 we cannot observe NI-GB trade. Total NI extra-UK imports saw an increase of 1.6% in 2021. Substantial heterogeneity is concealed within this net figure: imports from RoI increased dramatically, and imports from the EU and RoW decreased. The contraction in imports from the EU is in line with the overall effect of Brexit on the UK. The increase in trade with the RoI is of particular interest, however, as it could serve as an alternative source of imports for NI firms due to its vicinity and the unchanged market access post-Brexit.
TABLE 2: CHANGES IN NORTHERN IRELAND IMPORTS BY ORIGINS
|
Source |
Post-2016 referendum (Avg. 17-19, £ billions) |
Post-NIP application (2021, £ billions) |
CHANGE, in % |
|
EU |
2.86 |
2.54 |
-11.19 % |
|
RoI |
2.22 |
2.85 |
28.46 |
|
ROW |
2.69 |
2.51 |
-6.85 |
|
Total |
7.77 |
7.89 |
1.64 |
Source: Authors computations based on HMRC regional trade data
Finally, Table 3 examines the increase in NI-RoI imports by product categories. Imports rose in all but three categories, with the top three comprising chemicals, mineral fuels, and crude materials. The increase in chemicals trade could partly be due to the uncertainty that NI-GB medicines trade was initially subject to[6], as sales of these products in NI were governed by EU rules. Agri-food imports, accounting for over a third of the total, rose by 11.31%. However, in order to attribute such changes in trade patterns to the implementation of the NIP more up-to-date data on NI-GB trade are required.
TABLE 3: CHANGES IN NI-ROI IMPORTS BY SITC SECTIONS
|
Product category |
Post-2016 referendum (Avg. 2017-19, £ billions) |
Post-NIP application (2021, |
CHANGE, in % |
|
Food & live animals |
0.88 |
0.97 |
11.31 |
|
Beverages & tobacco |
0.07 |
0.09 |
20.24 |
|
Crude materials, inedible, except fuels |
0.11 |
0.15 |
35.53 |
|
Mineral fuels, lubricants & related materials |
0.06 |
0.11 |
79.50 |
|
Animal & vegetable oils, fats & waxes |
0.03 |
0.02 |
-35.07 |
|
Chemicals & related products |
0.27 |
0.63 |
128.53 |
|
Manufactured goods classified chiefly by material |
0.31 |
0.40 |
29.40 |
|
Machinery & transport equipment |
0.24 |
0.27 |
14.04 |
|
Miscellaneous manufactured articles |
0.25 |
0.21 |
-14.94 |
|
Commodities not classified elsewhere |
0.00 |
0.00 |
-16.87 |
|
Total |
2.22 |
2.85 |
28.46 |
Source: Authors computations based on HMRC regional trade data
To sum up
Traders from (any) third countries face a demanding list of checks when crossing the EU border. With sizeable (mostly retail) trade from GB to NI, there is little surprise that the NIP resulted in a bureaucratic and logistical burden. Also, a new burden is generally felt more strongly than something one is used to, so we understand the complaints from firms that, post-Brexit, had to make changes to their way of doing business. SPS checks could be reduced and/or removed if the UK and EU signed a veterinary agreement along the lines of what the EU has with Switzerland or New Zealand. Whether this is a palatable option is HMG’s decision, but we believe it could be a possible way out of the economic issues associated with the NIP.
Footnotes
[1] Although GB-NI flows are internal to the UK, we refer to them here as imports and exports, similarly to NI trade with extra-UK destinations/origins.
[2] The NI Department of Agriculture, Environment and Rural Affairs.
[3] These figures refer to the period 4th January 2021 to 28th February 2021.
[4] In order to assess the importance of agri-food trade, we would need data broken down by a trade classification such as the SITC but unfortunately such data are not available to us. Instead we use production data by industry.
[5] HMRC regional trade data are not directly observed trade flows, but are derived from national trade data allocated to the UK regions using employment weights.
[6] The EU since July 2021 has agreed to change the application of EU law to ensure that medicines from GB can move into NI without constraints that might affect supplies in the region (https://commonslibrary.parliament.uk/research-briefings/cbp-9333/)
Disclaimer:
The opinions expressed in this blog are those of the authors alone and do not necessarily represent the opinions of the University of Sussex or UK Trade Policy Observatory.
Republishing guidelines:
The UK Trade Policy Observatory believes in the free flow of information and encourages readers to cite our materials, providing due acknowledgement. For online use, this should be a link to the original resource on our website. We do not publish under a Creative Commons license. This means you CANNOT republish our articles online or in print for free.