How important is the UK-US trade relationship and what are the main challenges?
Services Trade and Digital Trade
Where does the UK fit into the US-EU-China trilateral relationship?
The United Kingdom’s withdrawal from the European Union has put it in a position to negotiate its own trade agreements. At present, the UK benefits from preferential trade relationships with the EU and 68 countries,[1] but a deal with the United States, its largest single-country trading partner, remains elusive.
In this Briefing Paper, we first review the importance of the UK-US trade relationship and identify clear interests for closer economic cooperation. We then discuss the main challenges for trade discussions and recognise that, at the time of writing, an FTA is clearly not on the table. An FTA had already started to look distant by the end of 2020 in part due to the ongoing Covid-19 pandemic, but to a much larger extent due to the change of presidency in the US. On the UK side, however, some form of preferential agreement remains a salient priority even if ambitions have been scaled back.
We suggest that bilateral cooperation can be primarily in ad hoc regulatory areas but stress the lack of interest by the Biden administration. Finally, we look at broader economic issues that go beyond the bilateral relationship that concern systematic policy issues, such as climate change, and multilateral economic relations where the UK hopes to cooperate with the US.
The US is the UK’s largest single-country trading partner for both goods and services. For the US, the UK ranks as its 7th largest trading partner for goods and largest for services.[2]
In 2020, just over one-fifth of the UK’s total exports were destined to the US compared to 12.5% of total imports (Table 1). Of the UK’s total exports and imports to and from the US, 63% and 50%, respectively, were of services.[3]
Table 1: UK-reported trade with the US (£ million), 2020; % of trade with world
| Exports | Imports | Balance | |||
| Goods | 45,961 | 14.9% | 37,254 | 8.5% | 8,707 |
| Services | 80,055 | 27.4% | 37,509 | 23.5% | 42,546 |
| Total | 126,016 | 21.0% | 74,763 | 12.5% | 51,253 |
| Data Source: ONS Pink Book 2021 (Ch. 9). Shares are out of UK total with all partners , i.e., with the world. | |||||
The scoping assessment by the Department for International Trade (DIT), published in March 2020, estimates that a UK-US FTA would increase UK trade with the US in the “long-run”: exports by 4.3-7.7% and imports by 4.1-8.6% depending on the extent of tariff liberalisation and reduction in non-tariff measures (henceforth: NTMs). This is considerably less than the amount of trade that similar models predict will be foregone between the UK and EU immediately after the UK’s exit from the EU.[4]
Foreign Direct Investment (FDI) is also an important aspect of UK-US commercial relations. Looking at the UK’s FDI position (i.e., stock), the US accounted for 25% of the UK’s total outward FDI and 24% of total inward FDI in 2019. This makes the US, once again, its largest single-country partner. This stock is predominantly in the financial services sector.
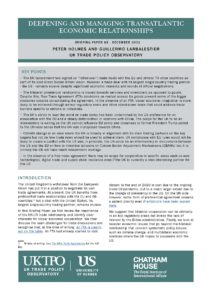
The overall commercial relationship between the two nations is biased towards services and investment. To demonstrate this, we refer to Figure 1 where we depict the values of UK goods and services trade and the UK’s FDI position with the US and EU in 2019.
| Figure 1: UK-Reported trade & FDI position with US and EU (£ million), 2019 |
 |
| Data Source: ONS Pink Book 2021 (Ch. 9) and ONS Dataset of FDI involving UK Companies (directional). |
Trade flows in both directions of goods and services trade are greater with the EU than the US, but the difference is much smaller for services. Moreover, UK services exports to the US are higher than goods exports. The share of services in bilateral trade flows is greater for the US (54%) than the EU (34%) even if the share of US services in UK trade is lower than the share of EU services. This does not mean that the US is a bigger market for services than the EU but that in any policy discussions services trade is relatively more important than goods trade.
Investment flows are harder to compare and it is not obvious what the correct metric is, above all if we wish to compare FDI with trade. Stocks of foreign investment are a moderately robust indicator of the long-term economic connection and so it is reasonable to compare UK-US and UK-EU totals. For both inward and outward FDI, which aim to create jobs and transfers in technology, the EU is more important. But how do we relate FDI stocks to trade? They are in different units from trade flows (stocks rather than flows, hence the different shade patterns of the bars) and on a different scale. Therefore, we consider relative magnitudes. Inward FDI from the US is nearly eight times goods imports while for the EU it is about three times goods imports. On the other hand, the stock of UK outward FDI in the US is six times the value of exports, but for the EU only four times. The absolute value of these figures is not significant: it is merely that 8 is bigger than 3, and 6 is bigger than 4!
This adds up to the implication that having a viable FTA covering trade with the US is still less important to the UK than is the case for an UK-EU FTA; and, looking only at UK relations with the US, the issues that matter are those that fall outside goods market access provisions, such as tariff liberalisation, in a traditional FTA. Lastly, the share of EU and US trade in the UK’s total trade (64%) is considerably smaller than the share of EU and UK trade in US total trade (19%) so, all together, the US loss of interest in a UK-US FTA is perhaps understandable.
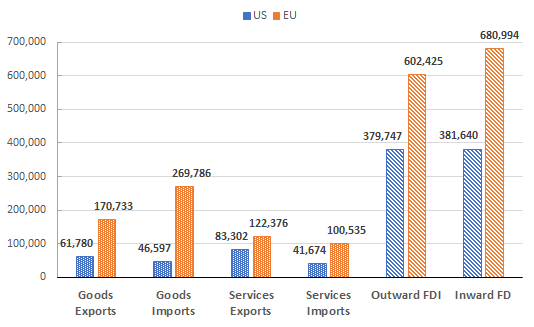
Nevertheless, market access for goods inevitably makes up a considerable section of any trade deal and tends to figure high in public discourse. Figure 2 shows that the UK’s most important commodities exported to the US are: machinery and transport equipment, miscellaneous manufactures and chemicals. This is mirrored on the imports side with the addition of fuels.
| Figure 2: UK-reported goods trade with the US by commodity (%), 2019 |
 |
| Data Source: ONS Pink Book 2021, Ch. 9. Shares are out of US total, calculations are authors’ own. Categories in descending order of total value (exports + imports). Commodity classification is based on the Standard International Trade Classification (SITC). ‘Other’ category includes: crude materials, beverages and tobacco, food and live animals, and animal and vegetable oils and fats. |
Table 2a looks at the top ten products exported by the UK to the US in 2019 based on value (column 1). Column 2 in the table depicts the share that the product represents in total UK exports to the US, while column 3 shows the share going to the US vis-à-vis the rest of the world. Column 4 contains the average applied tariff levied by the US on UK products.
These goods amount to £21.5bn: 38% of the UK’s total exports to the US. It suggests that UK exports to the US are highly concentrated considering the UK exported, per this product classification, 6,646 different products to the US. The US tariffs levied on these exports are low: six out of the ten products are already imported tariff-free, the exceptions being for passenger vehicles, gold and lactams.
Table 2a: Top UK-reported exports to US (£ million), 2019
| (1) | (2) | (3) | (4) | ||
| CN8 Code | Product Name | Valuea
|
Share in exports to US | Share of exports of product going to US vis-a-vis ROW | US Tariffb |
| 87032319 | Motor cars designed for the transport of <10 persons, cc > 1.500 cm³ and <= 3.000 cm³ | 3,670 | 6.4% | 42.1% | 2.50% |
| 97011000 | Paintings, executed entirely by hand | 3,603 | 6.3% | 53.5% | 0% |
| 87032410 | Motor cars principally designed for the transport of <10 persons, cc >3.000 cm³ | 2,867 | 5.0% | 41.9% | 2.50% |
| 88033000 | Parts of aeroplanes or helicopters | 1,916 | 3.3% | 16.6% | 0% |
| 71081310 | Bars, rods, wire and sections, plates, sheets, of gold | 1,796 | 3.1% | 9.9% | 1.37% |
| 30022000 | Vaccines for human medicine | 1,725 | 3.0% | 64.6% | 0% |
| 84119100 | Parts of turbojets or turbopropellers | 1,646 | 2.9% | 20.1% | 0% |
| 84111280 | Turbojets of a thrust > 132 kN | 1,558 | 2.7% | 16.7% | 0% |
| 30049000 | Medicaments in forms or packings for retail sale | 1,491 | 2.6% | 13.7% | 0% |
| 29337900 | Lactams | 1,306 | 2.3% | 81.7% | 4.17% |
| Top 10 Total | 21,578 | 37.6% | |||
| aHMRC Overseas Trade Statistics. bUS tariff data is downloaded from UNCTAD TRAINS via WITS, and refers to the simple ad-valorem equivalent (AVE) average tariff rate for the respective HS 6-digit code. Table of values and shares prepared using the TradeSift software. | |||||
The next top ten products represent an additional 11.8% of the UK’s total exports to the US where we find other forms of motor vehicles and parts, fuels (petroleum oils), organic chemicals and scotch whisky. The higher tariff rates are associated with some agricultural products, textiles and clothing apparel but, overall, 7% of UK exports to the US face ad-valorem tariffs higher than 5%.
Table 2b depicts the same information but for UK imports from the US. The top ten products represent 45% of imports from the US showing even greater concentration. Again, we find products used in the production of aeroplanes and forms of medicaments, which is indicative of intra-industry trade between the two nations. This can be quantified for all goods trade by computing the Grubel-Lloyd Index of Intra-Industry Trade where we find a score of 0.45. In comparison the same index computed using UK bilateral trade data with the EU returns a score of 0.54.[5] Generally, higher degrees of intra-industry trade promote finer specialisation, competition, innovation and economies of scale.
The UK Global Tariff (UKGT) rates in column 4 reveal that all of these products are already imported tariff-free. Across the entire tariff schedule, non-zero rates can be seen for agricultural products and, notably, large vehicles. The USTR’s analysis of partner trade barriers notes a number of high tariffs retained in the UKGT, which include fish and seafood (up to 26%), trucks (22%), bicycles (14%), processed wood products (10%), and fertilizers and plastics (6.5%).[6]
Table 2b: Top UK-reported imports from US (£ million), 2019
| (1) | (2) | (3) | (4) | ||
| CN8 Code | Product Name | Valuea | Share in imports from US | Share of imports of product coming from US vis-a-vis ROW | UK Tariffb |
| 71081310 | Bars, rods, wire and sections, plates, sheets of gold | 8,592 | 16.8% | 15.5% | 0% |
| 27090090 | Petroleum, crude (excl. natural gas condensates) | 4,333 | 8.5% | 22.6% | 0% |
| 84119100 | Parts of turbojets or turbopropellers | 4,179 | 8.2% | 56.3% | 0% |
| 84111280 | Turbojets of a thrust > 132 kN | 1,153 | 2.3% | 19.6% | 0% |
| 88033000 | Parts of aeroplanes or helicopters | 1,047 | 2.1% | 29.7% | 0% |
| 30049000 | Medicaments, packings for retail sale | 911 | 1.8% | 10.0% | 0% |
| 44013100 | Wood pellets | 832 | 1.6% | 64.6% | 0% |
| 97011000 | Paintings, executed entirely by hand | 783 | 1.5% | 51.6% | 0% |
| 71123000 | Ash containing precious metal or precious-metal compounds | 693 | 1.4% | 81.5% | 0% |
| 88024000 | Aeroplanes of an unladen weight > 15.000 kg | 653 | 1.3% | 17.8% | 0% |
| Top 10 Total | 23,178 | 45% | |||
| aHMRC Overseas Trade Statistics. bUKGT rates from UK Gov. Table of values and shares prepared using the TradeSift software. | |||||
The share of medium- and high-tech products in UK exports to the US is approximately 67%. This share is equal to 54% for imports. It is mainly driven by trade of aerospace, chemicals and motor vehicles, which feature prominently in both tables. However, there is also a heavy emphasis on other products such as paintings and gold, which do not figure in modern value chain activity.[7]
Even if products traded between the two countries are subject to zero or low tariffs (such as those in Tables 2a and 2b), there are other costs associated with cross-border merchandise transactions, namely NTMs. These can include sanitary and phytosanitary standards (SPS) rules, dealing with food safety and animal and plant health, and other technical barriers to trade (TBT) such as labelling or packaging requirements. FTAs generally seek some form of regulatory approximation as a means of lowering trade barriers and facilitating customs procedures.
One of the challenges in agreeing regulatory standards is that it inevitably risks constraining domestic rules. A recent report by Which?, a consumer group in the UK, comments on the extent to which the UK’s trade deals are reflecting consumer priorities. Their survey results suggest that food and product standards are still a major public concern.[8] The holy grail of trade negotiations is, therefore, Mutual Recognition where neither side has to change its domestic rules but agrees to admit products acceptable to the other. But this can only work when there is a degree of similarity of rules and trust on enforcement. Sometimes, countries agree to allow goods to enter freely so long as the exporting partner’s testing agencies confirm that exports comply with the importer’s rules. This is “Mutual Recognition of Conformity Assessment” and is surprisingly hard to achieve; it requires deep trust between partners’ standards infrastructure. The UK and the US have very different regimes in this area, but mutual recognition is not a novelty: numerous US-EU agreements were rolled-over to new US-UK agreements covering aspects of bilateral trade in distilled spirits, wine, electromagnetic compatibility, telecommunication equipment, marine equipment, manufacturing practice of pharmaceuticals, and prudential measures regarding insurance and reinsurance.[9]
The US negotiating objectives and strategic approach to the FTA, published by the USTR in February 2019, revealed a set of fairly tough demands on market access, regulatory alignment and defence of US interests, which would have proven hard to sell in the UK even for a government with a big majority. It called for adoption by the UK of US views on “science-based” regulation. The views in this document reflected long-held US concerns rather than Trumpian whims. They have not been revised since President Biden took over, but are dormant due to the administration’s lack of interest in a UK-US FTA.
In reference to regulations, the UK has stated that one of its overall negotiating objectives is:
[To] ensure high standards and protections for UK consumers and workers and build on our existing international obligations. This will include not compromising on our high environmental protection, animal welfare and food standards.
And, on SPS – a major US offensive – to:
This implies that a trade deal with the US would allow the UK to retain whatever rules it wished, including on sales of imported goods, but there would be simpler testing procedures for UK goods that met US standards to access the US markets, (and presumably vice versa). In other words, very little actual regulatory alignment with the US, but Mutual Recognition of Conformity Assessment. This declared aim was designed to allay fears among the UK public and agricultural sectors (some of which are discussed in the Which? report), which bridle against the US’ aims as laid out by the USTR in 2019, reflecting long-standing US views and not just those of the Trump administration. The US has a global aim of curbing the “Brussels Effect”[11] and pushing its views of regulatory systems on the world. A possible scenario would be a system in which there is minimal international harmonisation of regulations or even standards (as these may reduce real and perceived sovereignty) but one where the US should be accorded “equivalence” where it sought it.
In reality and despite the rhetoric, notably from Lord Frost, the UK has so far taken very few actual steps to break with the EU regulatory regime and has actually affirmed its commitment to remaining part of the European Standards organisations. Nevertheless, divergence will occur automatically each time the UK decides not to follow new changes in EU rules. The latest UK White Paper on Regulatory Reform envisages less detailed regulations with more emphasis on end results (as the US favours) rather than process rules (as the EU’s focus on quality assurance implies). But the trade aspect of this is not made central in the new document, beyond speaking of the desirability of Regulatory Cooperation.[12]
If the UK hoped that the US administration would provide it with a rationale for divergence from the EU, Biden refused to oblige. The US has since stressed that it wants a “worker-oriented” trade policy with domestic industrial policy playing a bigger role than market access concerns. On top of this, Biden’s strong stance on the UK complying with the Northern Ireland Protocol (NIP) presents a significant obstacle. The US has made it clear that it does not want to sign any kind of regulatory cooperation agreement with the UK that would worsen the tensions over the Irish Border. In the Trump-era, hard Brexiteers could hope that a deal for regulatory alignment with the US would force divergence with the EU and put pressure on the status of Northern Ireland within the Single Market. Regulatory alignment between Great Britain and the US would create the need for more rather than less barriers between Northern Ireland and Great Britain or on the island of Ireland. The Biden administration has consistently resisted compliance with this and has even gone as far as delaying the removal of Trump-era tariffs on steel, abolished for the EU from January 1, 2022, but not for the UK, to signal that it does not want the UK threatening to invoke Art.16 of the NIP. Somewhat ironically, this places the UK in a position where it is considering retaliatory action against the US rather than a lessening of trade barriers.
The lack of US interest in a UK-US FTA has forced the UK government to acknowledge that a bilateral [13]FTA is indeed looking very distant. It led to a short-lived floating of possible accession to the US-Mexico-Canada (USMCA) agreement but this was rapidly abandoned and the UK is now looking for more ad-hoc deals that can address market-distorting practices such as the settlement of the Boeing-Airbus dispute and the removal of Trump-era sanctions on access for British lamb.
We devote attention to the agriculture sector as it is one that is particularly sensitive to regulatory discussions and traditionally to political preoccupations, as the debate about the UK-Australia FTA has shown. The UK willingness to open its agriculture may create an interesting precedent. This sector is typically protected via NTMs and tariffs and has been a major US offensive interest in trade. In relation to this sector, the US has expressed concern over the UK maintaining the EU’s SPS measures “without scientific justification that negatively impact market access for US agricultural products.”[14]
In 2019, total US agri-food exports including beverages, which we define as products under chapters 01-24 of the Harmonised System (HS) commodity classification, equalled 8.6% of US total exports (£110.9 bn). US exports of agri-food products to the UK amounted to £1.4 bn, or 1.3% of the US total exports of agri-food products. The top US exports to the UK included wine (HS 220429, £122 million), food preparations (HS 210690, £113 million) and whiskies (HS 220830, £84 million). These products face average ad-valorem equivalent (AVE) tariff rates of 14%, 12%, and 0%, respectively. Other administrative costs of delivering these products into the UK include registration with a UK-approved organic control body, a certificate of inspection from the exporter’s control body, and notifications of arrivals to local authorities.[15]
On the other side, the UK’s exports of agri-food products in 2019 amounted to 7% of the UK’s total exports (£24.7 bn). Exports to the US were equal to 9.7% (£2.4 bn) of the UK’s total goods exports of agri-food products. The top exports included whiskies (HS 220830, £1,089 million) gin (HS 220850, £206 million) and fresh salmon (HS 030214, £178 million). These products face no tariffs in the US but are subject to some of the same bureaucratic barriers mentioned previously.
The UK exports of agri-food to the US are 73% larger than US exports to the UK.[16] The low share of US agri-food exports in trade with the UK (2.6% vs 8.6% to the world as a whole) could conceivably, as a highly imperfect yardstick, be used to support a claim that regulatory barriers and tariffs in the UK are relatively high and so distort trade. As a major US offensive, the UK’s unwillingness to deviate on this is likely to keep the US uninterested in an FTA.
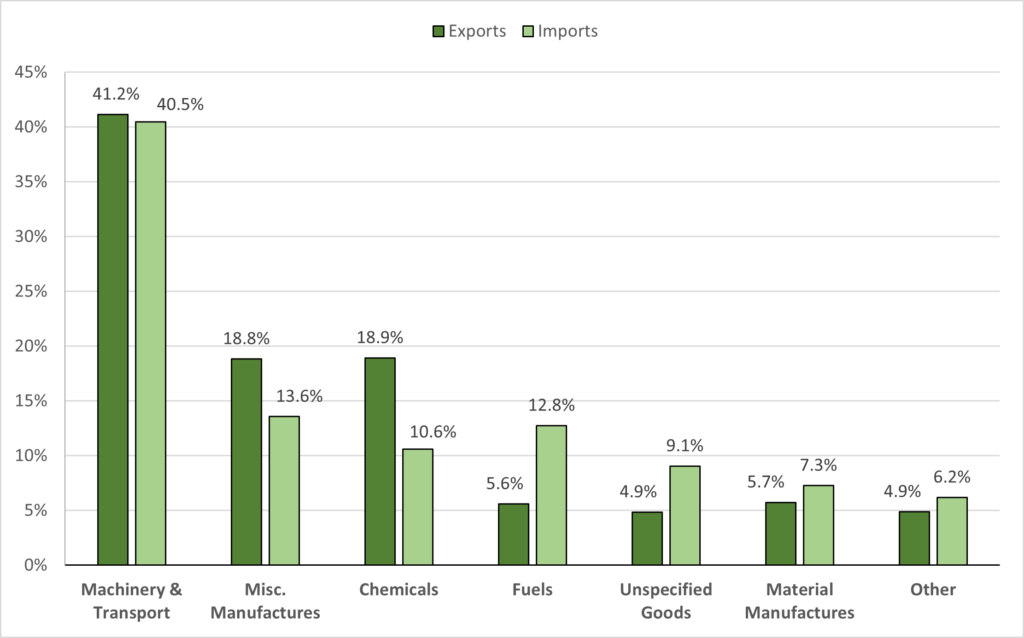
Figure 3 depicts the type of services traded between the two nations. UK exports of services to the US are predominantly in other business services[17], financial services, and insurance and pension services. Conversely, UK imports of services from the US are also largely for other business services, financial, and travel services.
| Figure 3: UK-reported services trade with US by type (%), 2019 |
 |
| Data Source: ONS Pink Book 2021 (Ch. 9). Shares are of US total, calculations are authors’ own. Categories in descending order of total value (exports + imports). ‘Other’ category include Personal, Cultural and Recreational, Government, Maintenance and Repair, Construction and Manufacturing Services. |
The high value of trade in services between the two nations may be partly attributable to relatively low levels of restrictions. The OECD’s Services Trade Restrictiveness Index (STRI)[18] available for 22 service industries, show that both countries are generally equally or more open relative to OECD countries (Figure 4). The UK has lower or similar STRI scores for all industries, while the same can be said for the US with the exception of air transport, courier, insurance and maritime transport services.
The UK is more closed for accounting services, motion pictures and rail freight transport services than the US. The first may be directly related to the UK’s lack of recognition of professional qualification of US chartered accountants.[19] On the other hand, the US appears to be more closed to foreign services than the UK in the rest of the industries. This highlights, once again, reasons why the UK is more interested in an agreement than the US, as it looks to improve its access to the US market.
| Figure 4: Services Trade Restrictiveness Index (STRI) |
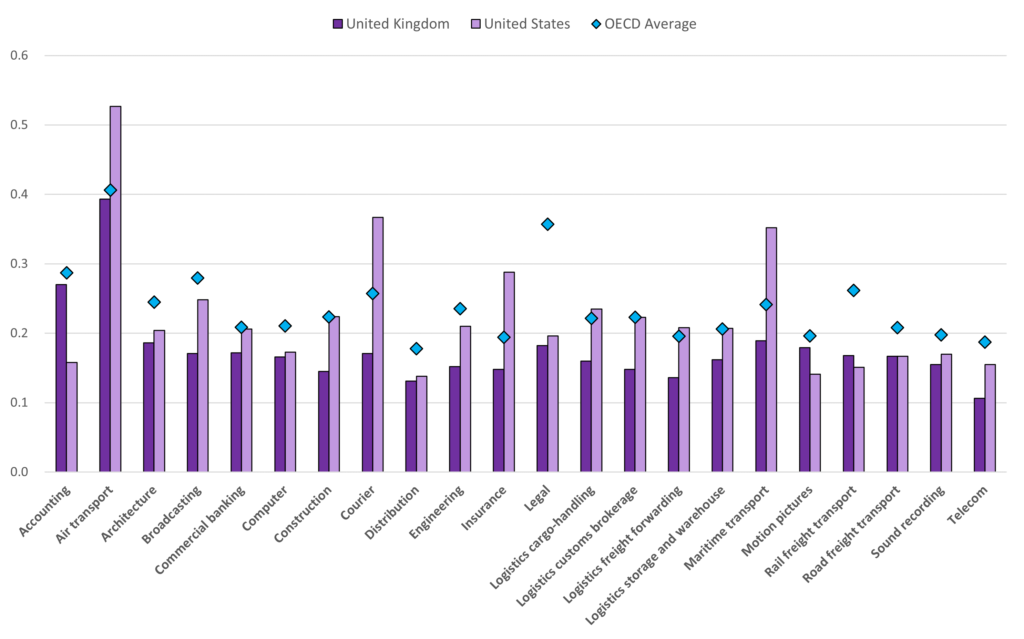 |
| Data Source: OECD. The UK-US FTA strategic case by DIT presents a similar chart in their own analysis and draws similar conclusions to those presented here. |
The negotiating objectives for trade in services laid out by both parties generally revolve around improving market access for both nations and ensuring certainty and transparency in services regulation. These range from increasing opportunities for business mobility through greater recognition of professional qualifications to enhancements in digital trade. There is an emphasis on expanding competitive market opportunities for financial services from both sides as this industry represents considerable shares of trade between the two nations and the highest concentration of FDI stock in each other’s economies. Services provisions in a UK-US FTA, or stand-alone deals, would undoubtedly vary according to the main modes of supply for each service type but, as with food safety, negotiating on services inevitably involves some compromise on domestic regulations.
There have been apparent intentions to begin discussions on digital trade that may pave the way to a standalone UK-US digital trade deal that can address some of the negotiating objectives (particularly for services trade, but not exclusively). It is clear that digital trade is taking a more prominent role in the UK’s post-Brexit trade policy (as shown in FTA Agreements in Principle (AIP) with Australia and New Zealand and a new Digital Trade Deal AIP with Singapore), which aim to create secure digital environments that can ease trade frictions via recognition of electronic contracts and/or electronic authentication, among other provisions.
The US has expressed concerns over the UK Government’s adoption of a digital service tax and its data protection regulations modelled on the EU’s Global Data Protection Regulation (GDPR), which restrict personal data transfers.[20] A bilateral deal on digital trade with the US could thus be part of a move away from the EU’s GDPR. However, there are many complications here as the UK has been able to secure an “adequacy decision” from the EU due to it maintaining the GDPR but only for four years. The UK Government sees its future in moving towards the model defined by the Comprehensive and Progressive Agreement for Trans-Pacific Partnership (CPTPP) rules even if it has already agreed rules with Japan, both in the United Kingdom–Japan Comprehensive Economic Partnership Agreement and in a separate digital agreement, that are more protective of the role of regulation in the CPTPP.[21] More complications arise when we consider the ongoing e-commerce negotiations among WTO members and the US’ own commitments on digital trade in its own trade agreements, such as the USMCA, and how all of this will intertwine with any future agreement with the UK (and EU).
All in all, there are many different parallel issues here and from a UK perspective coherence across all trade and self-standing digital deals is important though lacking so far; but free trade on data is not the only objective. The UK has an opportunity to revisit the trade-off between free flows of data and protection of individual rights, while holding off pressure from UK and US tech giants with an interest in pulling the UK away from the EU model.
Conventional analysis on the bilateral trade of goods and services does not per se capture the degree of (supply chain) interdependence between the two economies. Supply chains are an important feature of UK-US trade and a viable trade agreement that lowers trade barriers has the potential to deliver additional gains through this channel.
The first indication of this interdependency is the amount of trade in intermediate products (i.e., products that implicitly go into the production of final goods that are either exported again or consumed domestically). Approximately 53% of the UK’s goods trade with the US is in intermediate products: 39% of exports and 68% of imports. The US is the most important single-country source of intermediate imports for the UK, representing 15% of all UK imports of intermediates. The next most important countries are Germany, Switzerland, Netherlands and China. The EU as a whole remains the largest source (40%).
From the US side, trade in intermediate products with the UK corresponds to 50% of exports and 31% of imports. The UK ranks as the 11th most important single-country source, accounting for 2% of the US total imports of intermediates, and 11% of intermediate imports from the EU. The most important source countries are Canada and Mexico, which account for a third of imports, followed by China, Japan and Germany.[22] The numbers suggest prima facie that the UK is more dependent on the US in its supply chains than vice versa.
The types of intermediate products in which the UK and US are more reliant on each other are primarily high-tech products, such as engines, turbines and other vehicle and aerospace parts. On the other hand, imports of intermediates from China (which represent a substantial share of imports of intermediates for both countries), are predominantly (but not exclusively) for low-tech products, such as fabrics. In fact, there is a negative correlation between US and UK reliance on Chinese intermediate products (as measured by imports from China vis-a-vis the rest of the world) and the significance of these products in UK and US exports (as measured by the share of exports of a given product in its total exports).
An alternative approach to analysing value chain activity makes use of the WTO-OECD Trade in Value-added (TiVA) database. The TiVA database can shed light on the extent of internationalisation in countries’ global value chains for both goods and services, and for this we consider the origin of foreign value-added in final demand.
In 2018, the foreign value-added share of UK final demand was equal to 23.6%: 3.1% originated in the US, 11.5% in the EU and the remaining 9.1% in the rest of the world. These shares equate to 12.9%, 48.5% and 38.5%, respectively, of the total foreign value-added of the UK’s final demand. The US share in UK final demand is the highest share for any individual country, followed by Germany (2.5%), China (1.7%) and France (1.7%). The amount of value-added not accounted for by total foreign value-added represents the amount of domestic value-added.
Figure 5 shows that UK supply chains are much more linked to the EU than the US . It also demonstrates the heterogeneity of the origin of foreign value-added in final demand proceeding from different broad industrial groupings. From the UK’s manufacturing industry, the US share is equal to 5.4%, the highest being from the chemicals, electrical, and machinery equipment industries. The amount of total foreign value-added in demand from the manufacturing sector is substantially higher than for service industries, with notable shares in the textiles, apparel and leather industry and the transport equipment industry. Final demand proceeding from the business sector services industry is 3.3%, with financial and insurance activities representing the service industry with the highest share of US content in UK final demand (6.4%). This share is equivalent to 25% and 42% in terms of total foreign value-added and value-added among non-EU countries, respectively.
| Figure 5: Origin of value-added in UK final demand, % of total value added in final demand |
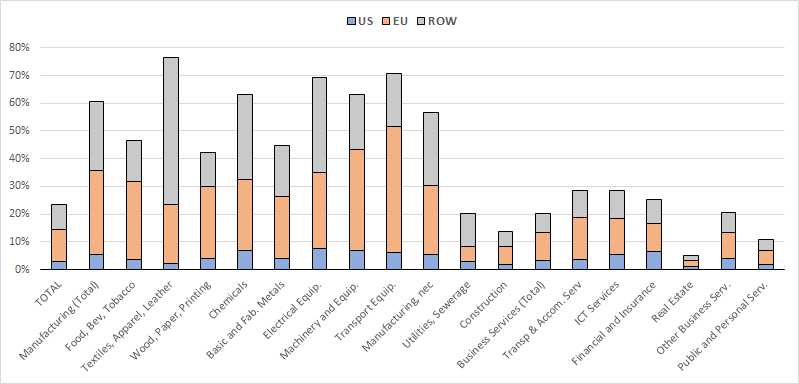 |
| Figure 6: Origin of value-added in US final demand, % of total value added in final demand |
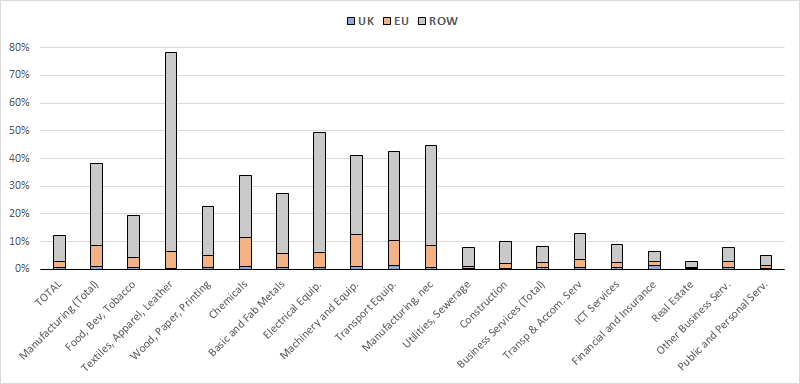 |
| Data Source: TiVA 2021 ed: Origin of value-added in final demand (OECD). |
We also look at the importance of the UK as a source of inputs into US value-added. Taking the same approach, we find that the foreign value-added content in US final demand is 12.2%, of which 0.5% originates from the UK, 2.5% from the EU (sans UK), and the remaining 9.2% from the rest of the world. Respectively, these shares correspond to 4.2%, 20.2% and 75.6% of the total foreign value-added. The most important partners are China (2.2%), Canada (1.1%) and Mexico (1%). With the exception of China, the countries closest integrated into the UK’s and US global value chains are those most geographically proximate.
Figure 6 depicts this for the same broad industrial groupings. The manufacturing industries are, once again, associated with greater amounts of foreign value-added compared to services industries. A second glance also reveals that the UK and other EU countries appear to contribute less to US final demand across all industries. On aggregate, all industries (except for the textiles, apparel and leather industry) have a lower content of foreign value-added in comparison to the UK (Figure 5). This is not surprising given that the US is a bigger economy. The UK represents very small shares of value-added in US final demand across all industries, but there are still some industries where UK value-added solely as a share of total foreign value-added is significant. For instance, in financial and insurance services this is equal to 21%, which is the highest for any country. As a percent of total value, this is equal to 1.3%, with Switzerland (0.4%) and Canada (0.4%) representing the next two most important countries.
Related to this are “supply chain resilience” issues as the onset of the Covid-19 pandemic exposed the vulnerabilities of highly fragmented supply chains. Operational disruptions, caused by delays, input shortages and logistics issues, have forced businesses to promote supply chain resilience by building-up inventory (i.e. stockpiling), reshoring activities and/or sourcing components closer to home.
Policy responses to encourage resilience, however, are complex and care needs to be taken that this does not become an excuse for protectionism. The US and the EU have both expressed concerns about high shares of imports of strategically vital inputs coming from China. There is debate about whether these fears are exaggerated,[23] but they do form part of the agenda of the EU-US Trade and Technology Council.[24] The aim here is to develop approaches and even standards in environmental and Artificial Intelligence (AI) fields, which themselves can promote resilience. Advances in digital technology and robotisation may be able to address labour shortages, and environmental commitments can encourage firms to source components with lower carbon footprints.
Where does this leave the UK? BritishAmerican Business (BAB), an association between the British-American Chamber of Commerce in the US and the American Chamber of Commerce in the UK, has proposed some sort of equivalent arrangement but given the smaller size of the UK economy it would seem unrealistic to aim for an approach as broad as the EU-US plan. The lower-profile US-UK Science and Technology Partnership, announced in June 2021, could provide promising cooperation in some specific areas, including supply chain resilience, and on certain emerging technologies.
The hopes for “Global Britain” at the outset of Brexit were that the UK would be able to play a major diplomatic role, perhaps in alliance with the US. However, the UK’s ability to lead the world on trade policy has been undermined by the US preference for an association with the EU (linked to support for the Irish position on cross-border trade) and at the same time a steady deterioration in relations with China that reduce the UK’s chance to act as a “broker”. The UK’s seeming unwillingness to adhere to deals done with the EU creates further problems.
As part of its vision, the UK Government aspires to “lead the charge with like-minded members to push the World Trade Organisation (WTO) into the 21st century by grasping the opportunities and tackling the challenges at the heart of modern trade.”[25] A simplistic interpretation suggests a trilateral system in which the US, China and, with perhaps slightly less salience, the EU are setting the rules. The lower profile of the EU led to some in the UK hoping that the UK could, through the use of soft power, have a disproportionate diplomatic influence. Liam Fox’s ability to pass the first stage of the selection process for the post of WTO Director-General gave some credibility to this. Moreover, the UK claims that its support for the recent WTO agreement on services (i.e. the Joint Initiative on Services Domestic Regulation) played an important role in its signing but, otherwise, the UK outside the EU does not seem to have found the role it hoped for yet.
For many years the UK had been able to be, at least in part, a bridge between the US and the EU, and China and the EU.[26] Up to 2016, the UK had a clearly defined role as China’s “Best Friend” in the EU. Trade and investment were, and are still, growing with China set to support nuclear power and telecoms infrastructure even if this is now in doubt. UK cooperation with China also included under-the-radar trade and investment initiatives in Africa for poverty reduction.[27]
The scope for the UK to be an intermediary is waning. The UK cannot influence EU policy and its closeness to Trump added to the Chinese sense that the UK was ill-disposed towards China; the Hong Kong and Huawei disputes have strengthened this perception. But, even before Trump, the US had become far more hesitant to embrace cooperation with China. Under German pressure, the EU was also becoming much more reserved about closer cooperation with China, as Germany, despite a continuing trade surplus, felt that its position as a supplier of high-tech inputs to Chinese electronics might be at risk.
The EU has deliberately placed itself midway between the US and China in the WTO. It is bringing in tough new anti-subsidy instruments and echoing the US frustration about the role of the Chinese state. However, it has not sought to put the blame on the WTO Appellate Body as the US has done. The EU has sided with China on the need to restore the WTO Dispute Settlement System and has put forward its own plan for an interim solution known as the Multi-party Interim Appeal Arrangement (MPIA). China has discreetly but firmly backed this plan, nominating a former Chinese trade official as a member. But the US has refused to go along with it. The UK agrees with the US seeking both a resolution of the WTO Appellate Body crisis and a curb on anti-competitive practices such as unfair export subsidies. It seeks reform of the WTO but has not made detailed proposals of what to do apart from declining to join the MPIA. The conditions stated in its Board of Trade Report are actually somewhat demanding:
“All this would require the UK to lead a global coalition of like-minded nations in pushing the global rules-based system into the modern era. Making it fit for purpose would allow the UK to unleash its full potential as a confident and outward-facing world leader.“[28]
It is not at all clear what role the UK can play in the trilateral system. UK frictions with the EU, especially over Northern Ireland, and the diminishing US interest in a US-UK FTA lessen the extent to which the UK can hope to opt for a US alliance to replace its European stance. US Defence Secretary, Lloyd Austin, reportedly advised the UK to focus on its European role and not seek an anti-China alliance with Global Britain. At the same time, the new US-UK-Australia (AUKUS) military agreement has achieved one goal of the current UK government to reorient its foreign policy towards the Anglosphere.
But overall, the AUKUS alliance is possibly slightly exceptional in that the US positively chose a pact with the UK at the expense of the EU. The dominant trend has otherwise been the US seeking an alliance with the EU in order to rein in China. For the UK to play a bigger role would require the US to genuinely commit itself to reactivating the WTO where the UK could seek its “like-minded coalition”.
Climate change is one area where the UK has demonstrated some capacity for leadership in partnership with the US. The latest global climate summit, COP26, can be regarded as a success in that the global community signed up to new targets and the UK and US were on the same page. This is an area where the UK is broadly in alignment with its main trading partners, but it is not clear it is able to influence the leading players; it cannot do much more than encourage them to stick to commitments they already signed up to. The elephant in the room is what happens if countries do not introduce strict emission controls as promised.
Carbon Border Adjustment Mechanisms (CBAMs) have been discussed since the mid-2000s. There was a fairly clear consensus by around 2010 that Border Carbon Adjustments, as they were then known, were not in principle WTO illegal so long as not arbitrarily discriminatory, and that they could possibly reduce emissions, but the balance of opinion was that they were probably not a good idea, especially if introduced unilaterally.[29] The case for CBAMs seems obvious: there is a distortion due to the externalities caused by carbon emissions that are taxed in some trading partners but not others. Carbon emitting production may shift from regulated to non-regulated countries risking both competitive losses to regulated country producers and higher global emissions. And legal experts who probed the issue in the late 2000s were clear that a tax burden which fell equally on home and imported products with certain characteristics, which could include the environmental damage caused by their production, was in principle WTO legal, provided there was no unjustified discrimination. This point had been established at the request of the US in the Shrimp Turtle case, though testing the point is always tricky.
So why were governments and experts so hesitant? There were several reasons. The main anxiety was that CBAMs risked providing excuses for protectionism and risked trade disputes linked to accusations of protectionism. The econometric evidence available 10-12 years ago suggested that “carbon leakage” was not as serious a problem as sometimes argued and more recent studies do not entirely reverse this finding. An IMF review, dated August 2021, suggested that the case for CBAMs could not be dismissed. But it notes, on the effects of an emission trading system (ETS), that:
“A growing literature examines the effects of the EU ETS on carbon leakage and various indicators of competitiveness; Verde (2020) […] concludes that so far, there is no evidence of the EU ETS having resulted in a loss of competitiveness or in carbon leakage”.[30]
The authors suggest that more refined analysis may lead to different results. Moreover, CBAMs might be politically needed to secure agreement and to resolve the “trilemma” on how to balance fairness, environmental effectiveness and technical feasibility.[31]
But setting the level of border tax at the correct level would be extremely difficult. Do you base the tax on importer or exporter coefficients? Average country levels or product-specific? How do you deal with scrap? How do you measure emissions per product accurately? What goods are included? Allowing the WTO Appellate Body, even if it exists, to review all challenged CBAMs would be very contentious.[32] Moreover as Paul Krugman recently observed, the main source of emissions is from production for domestic consumption, a point stressed by UNCTAD.
The US has in the past seen proposals for carbon taxes and even CBAMs but congressional and Trump-related opposition blocked all discussion. The Biden administration is clearly committed to returning to the climate agenda, above all through John Kerry. Having been very hesitant about CBAMs, the Democrats, though not the administration itself, have proposed a form of CBAM which would tax imports of carbon-intensive goods subject to a costly regulatory burden in the US but not in the exporter country. Initially, however, the Biden administration seems inclined to use regulatory processes rather than an ETS or a carbon tax. The EU, meanwhile, also hesitant 10 years ago, has recently embraced CBAMs. The US and EU positions have apparently converged on a CBAM concept in the steel and aluminium agreement. Both parties will commit to removing Trump-era measures and countermeasures but to continue to impose measures against third countries whose steel does not comply with “green” measures to be agreed between the EU and the US.
The prospect arises of joint CBAMs applied by the US and the EU against China and other non-compliant third countries. This places the UK in a delicate position. The UK could almost certainly secure exemption by committing itself to environmental rules agreed by the EU and the US, though it would still face regulatory requirements to demonstrate compliance and would have no say in the broad design of an EU-US agreed system. Meanwhile, the US-EU steel deal has further disquieting aspects for the UK. The US measures were not removed from the UK through the EU deal. They may well be in the future but the US has made clear that this was no accidental omission. As observed previously, this is linked to the NIP issue, a linkage the UK has sought to dispute. Moreover, there is a long term negative effect of the EU deal on the UK. The US and the EU steel deal has very strict rules of origin so UK steel products only slightly transformed by processing in the EU might still face duties in the US.
More broadly the EU has announced that its CBAM measures will not apply to countries with carbon charges linked to the EU ETS scheme as the UK used to be but has not been since 2021. The TCA provides for the possibility of a link to be negotiated but while the scheme is similar to the EU scheme it is legally separate. The UK government has expressed some interest in making this connection, but it is not clear how close an alignment would be demanded to avoid CBAMs, or what paperwork requirements would be needed.[33]
Under the Biden administration, there does not seem to be the tension as there was previously. The UK is broadly in agreement with the EU in overall aims but differs in detail. UK compliance with EU rules would not be likely to create a conflict with the US. In principle, the UK could be an intermediary in discussions between the US and the EU on how to minimise tensions on CBAMs, but it is unlikely the UK will have much independent leverage[34]. The UK will be under extreme pressure to ensure it is close enough to the EU to secure exemption from EU CBAMs and if it does so it will be under domestic pressure to have similar CBAMS, which would not endear the UK to the US – or indeed Australia. The UK would clearly like to support the US in global negotiations but the UK is likely to be forced to follow the EU on the details.
In the Briefing Paper we have argued that the trading relationship between the two nations is more biased towards services and investment rather than goods, but that issues surrounding market access for goods will inevitably present one of the greater obstacles towards consolidating an agreement even if tariffs on key products are already zero or low. This is especially the case for trade in agricultural goods where non-tariff measures and tariffs are most prevalent.
In the absence of an FTA, the likely route to closer economic cooperation between the two countries would be in ad hoc regulatory deals and other stand-alone deals that address trade barriers specific to particular sectors or industries. There is room for cooperation on new technologies and supply chain resilience even if the UK is a less interesting partner for the US than the EU. A viable deal on digital trade is likely to ease trade frictions across the whole spectrum, but this is not without its challenges. Regulatory discussions involve domestic regulatory issues, which are not easy to negotiate, especially in the light of public reaction.
The UK is not in a position to easily do the kind of deal which would be a lever to force it to diverge from the EU since the US does not want to support that. For the time being, the US does not seem ready to help the “UK to lead a global coalition of like-minded nations.”
[1] At time of writing. See The UK’s Trade Agreements for the full list.
[2] Sources: ONS (UK) and USTR (US), 2019.
[3] Some caution must be exercised in interpreting this as US-reported data also suggests the US has a trade surplus with the UK (£17.1 bn). Trade asymmetries between the UK’s Office for National Statistics (ONS) and the US’ Bureau of Economic Analysis (BEA) are well documented. See: Asymmetries in trade data: extending analysis of UK bilateral trade data, Section 3.
[4] For example, statistical analysis on monthly trade data by UKTPO suggests that over the period January-July 2021, the TCA reduced UK goods exports to the EU by 14% and imports from the EU by 24%.
[5] The Grubel-Lloyd Index is computed as a value between 0 and 1, where values closer to one indicate higher degrees of intra-industry trade. The values in the text correspond to the weighted average of all CN 8-digit products by export shares.
[6] Product names and tariff rates as they appear in the USTR’s report (p.530). Manual assignment of HS 2017 codes to these products reveal that they amount to approximately £2 bn, or 4.5% of US exports to the UK.
[7] We chose to look at data for 2019 to account for anomalies created in trade patterns by the Covid-19 pandemic. However, 2019 also represented an unusual year in gold trade. For other products, the 2019 values and rank-orders remain relatively unchanged in comparison to the 2017, 2018, and the 2017-2019 average values.
[8] For a related study on EU food safety rules see: A.R.Young and P. Holmes “Protection or Protectionism? EU Food Safety Rules and the WTO” pp. 281-306 in The Contested Governance of European Food Safety. Christopher Ansell and David Vogel (eds) MIT Press, 2006.
[9] See: US-UK Trade Agreement Negotiations (USTR) and UK-USA Mutual Recognition Agreement (Gov.uk).
[10] Government Policy Paper: UK-US Free Trade Agreement, p.9.
[11] The “Brussels effect” is a term coined by Anu Bradford to refer to “the EU’s unilateral power to regulate global markets.” See “The Brussels Effect: How the European Union Rules the World” for more information.
[12] The Paper states that: “international regulatory cooperation will be critical to effectively responding to global challenges and making the most of our changing relationship with the world by reducing regulatory barriers to trade with a wider range of countries” (p.10)
[13] See FT Sept 21 2021
[14] Foreign Trade Barriers (USTR), p.532
[15] See UK Integrated Online Tariff by Gov.uk
[16] This may be somewhat distorted by the high value of UK exports of whiskies and other distilled spirits.
[17] ‘Other Business Services’ refer to (but are not limited to) legal, accounting, management consulting; advertising, market research; architectural, engineering, scientific; trade-related services; waste treatment, agricultural and mining services.
[18] The STRI takes a value between 0 and 1, where complete openness to trade and investment is assigned a score of zero, while a score of one implies a completely closed market to foreign services.
[19] Foreign Trade Barriers (USTR), p.535.
[20] Foreign Trade Barriers (USTR), p.535
[21] Morita-Jaeger, M. (July 2021) Accessing CPTPP without a national digital regulatory strategy? Hard policy challenges for the UK. (UKTPO)
[22] Product categorisation done using the BEC classification at HS 6-digit product level on UN Comtrade data. Shares computed using the TradeSift software.
[23] Schneider-Petsinger, M. (September 202) US and European strategies for resilient supply chains. (Chatham House)
[24] More information: U.S.-EU Trade and Technology Council Inaugural Joint Statement
[25] Global Britain, Local Jobs – A Board of Trade Report, March 2021
[26] Harlan Grant Cohen, Nations and Markets, Journal of International Economic Law, Volume 23, Issue 4, December 2020, Pages 793–815, https://doi.org/10.1093/jiel/jgaa032
[27] See for example Gu, J., Holmes, P., Rollo, J. and Snell, S. with Mendez-Parra, M. and Procopio, M. 2017. China–UK–Africa Trilateral Cooperation on Trade and Investment: Prospects and Challenges for Partnership for Africa’s Development, IDS Evidence Report 218, Brighton: IDS.
[28] Global Britain, Local Jobs – A Board of Trade Report, p.30
[29] Holmes, Peter, Tom Reilly and Jim Rollo (2011), ‘Border Carbon Adjustments and the Potential for Protectionism’, Climate Policy, 11(2), 883–900.
[30] Misch, F. and Wingender, P. (August 2021) Revisiting Carbon Leakage (IMF), p.19
[31] Lydgate, E. (May 2021) The Carbon Border Adjustment Trilemma (UKTPO)
[32] For a series of articles on WTO compatibility of EU plans see https://worldtradelaw.typepad.com/
[33] The UK Emissions Trading Scheme, HoC Briefing Paper, and Jensen, C., Gasiorek, M. and Lydgate, E. (December 2021). UK Policy on Carbon Leakage. (UKTPO)
[34] Burke, J., Sato, M., Taylor, C. and Li, F. (April 2021) What does an EU Carbon Border Adjustment Mechanism mean for the UK?; Centre for Climate Change Economics and Policy, Policy Report.