

 10 February 2023
Guillermo Larbalestier is Research Assistant in International Trade at the University of Sussex and Fellow of the UKTPO. Nicolo Tamberi is Research Officer in Economics at the University of Sussex and Fellow of UKTPO.
Today, HMRC have released UK trade data for 2022, which we can use to assess UK-EU trade two years after the introduction of the UK-EU Trade and Cooperation Agreement (TCA).
To examine the impact on UK goods trade since the introduction of the TCA, some context is important here. The work of John Springford at the Center for European Reform indicates that in aggregate UK trade to the world is approximately 7% lower with regard to both goods and services as a result of Brexit.
In this blog, we are not looking at those aggregate flows, rather, we compare UK trade with the EU relative to UK trade with a comparator group of non-EU countries, before and after the 2016 Brexit referendum.[1],[2] Specifically, our approach compares the difference between UK trade with the EU, and non-EU, for each month between July 2016 and December 2022 in comparison to the period January 2013-June 2016. This allows us to see how both the 2016 referendum result and the implementation of the TCA may have affected UK-EU trade in comparison to UK-non-EU trade.[3]
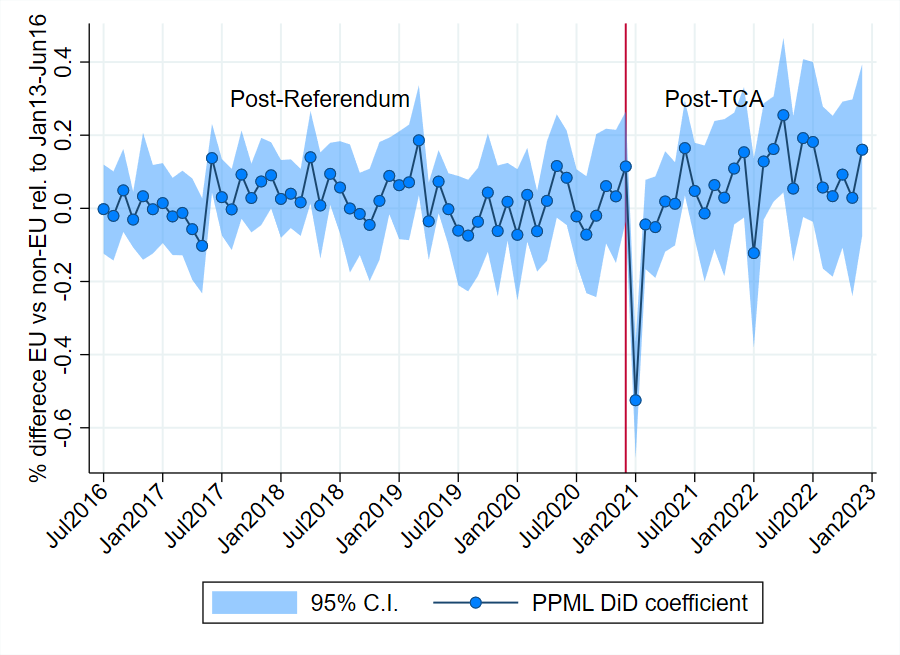
The results are clear. First, there are no discernible effects of the referendum on UK-EU trade relative to UK-Non-EU trade, neither for exports nor for imports. Regarding the post-TCA period, UK exports to the EU dropped dramatically in January 2021 (-41%), and quickly recovered thereafter. There is no sign of the TCA affecting total exports beyond January 2021. It is worth noting however, that in our previous work these total effects masked considerable sectoral variation with some industries experiencing a persistent decline in relative exports to the EU. We will report on this in future blogs.
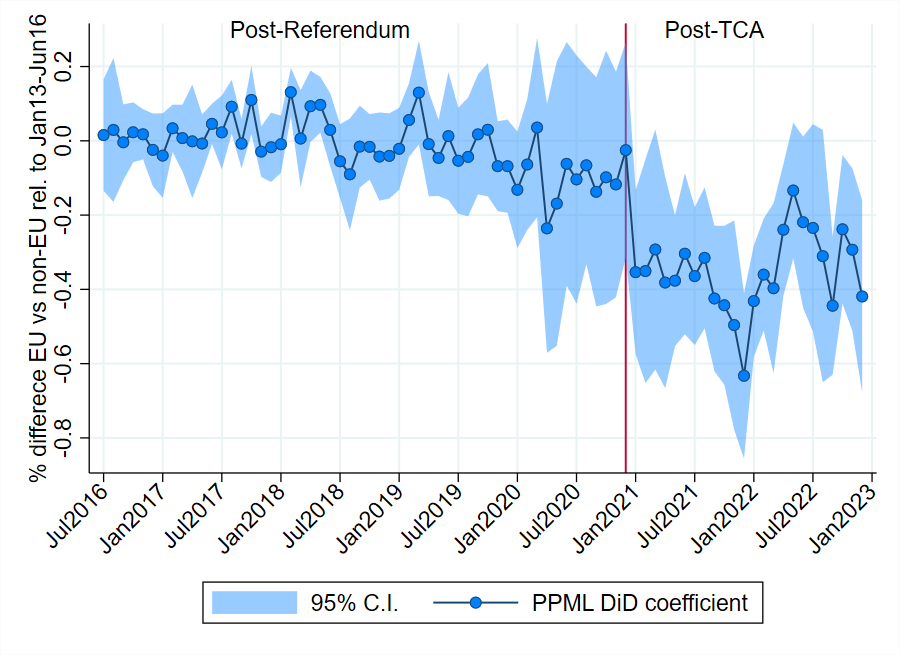
On the other hand, UK imports from the EU fell substantially after January 2021, and this effect appears to be persistent, although there is some sign of a possible recovery in 2022 compared to 2021. Over the period 2021-22 UK imports from the EU, relative to imports from the non-EU are down by -28.4%.
Figure 1: Percentage changes in UK-EU trade, Jul 2016-Dec 2022
|
a) UK Exports |
b) UK Imports |
|
Note: The dots represent the estimated difference between EU and non-EU trade, and the shaded area is a degree of precision of the estimate (95% C.I.). The estimation is a PPML regression of UK trade (exports or imports) to the 27 EU countries and the control countries (OECD+BRICS ex. Canada and Japan) on post-referendum dummy interacted with time dummies, including partner-month and time fixed effects. Estimation details available on requests. |
|
The data indicates that while UK goods exports to the EU suffered a large drop in January 2021, over the two-year period exports to the EU have performed similarly to exports to non-EU countries. Conversely, UK goods imports from the EU relative to imports from non-EU are down by -28%. All this needs to be borne in mind in the context of the reported decline in aggregate UK trade. Somewhat interestingly this suggests that the impacts of Brexit on exports may have been more on the aggregate levels, which impacted on both trade with the EU and non-EU, while the effect on imports has been more asymmetric.
[1] The comparison group is formed by OECD and BRICS countries. We exclude Canada and Japan from the sample as they signed and implemented trade agreements with the EU and the UK over this period. We also exclude trade in gold (HS product 7108) as it is very volatile.
[2] Technically, the method applied is a difference-in-differences. The method is based on Gasiorek and Tamberi (forthcoming) where we showed that other more sophisticated methodologies yield similar results.
[3] In our previous analyses we compared the post-TCA period with 2017-20, but our results are robust to changing the base period.
Disclaimer:
The opinions expressed in this blog are those of the author alone and do not necessarily represent the opinions of the University of Sussex or UK Trade Policy Observatory.
Republishing guidelines:
The UK Trade Policy Observatory believes in the free flow of information and encourages readers to cite our materials, providing due acknowledgement. For online use, this should be a link to the original resource on our website. We do not publish under a Creative Commons license. This means you CANNOT republish our articles online or in print for free.
Very interesting, timely, and nicely presented! I assume that the calculations refer to trade in goods plus services, but it might have been (and might still be) worth making that explicit, particularly since this point is made clear in the reference to the work by John Springford. I look forward to the sectorally disaggregated results in due course.
Thanks for your comment Adrian. Our calculations refer to goods trade only, using data reported by HMRC.