Hi there, Ollie here. Today I’m going to be reviewing the statistics program IBM SPSS Statistics. I am by no means a master of SPSS; if you’re looking for THE master I recommend checking out Andy Field’s website. As I look through Andy’s enormous book on the subject, I realise I probably know less than 1% of all there is to know about SPSS. Notwithstanding this, I’d like to share my experience of using SPSS as a student.
I was introduced to SPSS in my first year of studying psychology at Sussex, in our statistics classes. I’m now in my third year so I’m fairly familiar with it. It’s a statistical analysis program that’s perfect for analysing and manipulating large amounts of data as so often encountered by psychologists. Basically, it’s a super advanced version of Microsoft Excel.
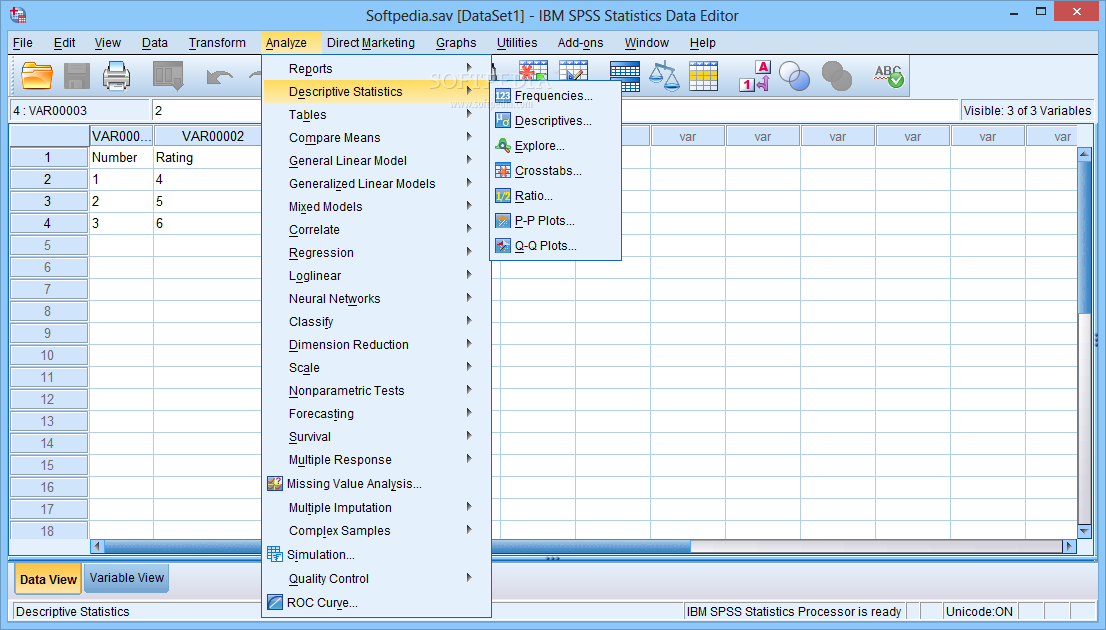
However, I certainly find SPSS much more difficult to use than Excel. This is unsurprising as SPSS has many more functions which are difficult to understand, however I also find it less intuitive to use. The names and corresponding icons of functions are much less clear and indicative than in Excel. For example, the icons of the Descriptives and Crosstabs functions in SPSS aren’t much help to me, whereas the icons of the Sort and Filter functions in Excel are pretty explanatory.

I also find the general interface of SPSS to be less user-friendly. For example, scrolling the page vertically and horizontally is much less easy to control than on Excel. Also, zooming in and out of the page is much harder on SPSS. Overall the interface of SPSS is somehow more primitive, the kind of interface you’d expect programs to have in about 2001, whereas Excel’s interface feels very slick and modern. For example, in Excel, as the highlighted cell changes, it smoothly glides over the spreadsheet to the new cell – one of many nice touches which SPSS lacks.
Another thing I dislike about SPSS is its incompatibility with Microsoft Word. I often want to copy and paste graphs from SPSS to Word and format them, but that’s simply not possible. I don’t even have much luck copying and pasting tables into Word. In contrast, this is made very easy by Excel, to the extent that I usually have to open Excel, insert the data I want to make a graph of, then copy that graph to Word. It would be a great feature of SPSS to have greater formatting compatibility in Word.
However, that said, SPSS is an incredible statistics program. It’s extremely reliable and accurate and has more functions than I know what to do with. In short, SPSS the solution to almost any statistics problem, even if it’s a little rough around the edges.
Let’s get social:
Hi Ollie,
Re SPSS and word … it’s a bit old now, but check out my tutorial at https://youtu.be/FDwGnWC5nQY
for tables, if you want to format then export as RTF
andy