


Do you know which sections of your teaching content students are engaging with the most, (and perhaps perceive as the most valuable) and conversely, which are often neglected? Do students return to specific pages or even particular sections of a recording when they start revising for an exam? How can tracking weekly online participation and average course grade analytics help tailor the way you structure and deliver effective online teaching resources? This blog will take you through the benefits of using learning analytics.
Virtual Learning Environments (VLEs) like Canvas produce a huge amount of usage data on a daily basis, like a digital footprint. This data often goes overlooked despite its potential to allow greater insights into how your teaching materials are currently used by students to foster their learning. Canvas has an integrated tool called New Analytics which provides an overview of grade distribution, class activity, participation and individual student analytics.
Why is using course analytics important?
Learner activity can be gleaned from students’ interactions with the module based upon clicking through content and links. There have been multiple studies that show the total number of hits or views on a VLE was one of the strongest predictors of student success. This case study from the University of Maryland found that ‘students who obtained a D or F grade had been using the VLE on average 40% less than students with C grades or higher’ and this figure remained constant year on year.
Therefore, looking at online interaction data could help identify ways of improving engagement through the materials that we produce and help predict student outcomes. In essence, learning analytics can:
- Help you evaluate the effectiveness of different teaching methods and content.
- Allow you to easily view average grade and distribution of marks for any Turnitin, Canvas Online assignment or Canvas quizzes (including formative assessments) and see how students are progressing throughout the term.
- Provide data that indicates which students stop engaging, could be at-risk and need additional support.
How to access course analytics
To access the engagement data for your module, click on ‘New Analytics’ which will appear on the right-hand side of a module’s homepage. The data presented in the New Analytics reports are refreshed every 24 hours and are based on active/completed student enrolments. The dashboard is useful for showing data based on recent activity, but you can download data for a longer period. New Analytics is currently only available for staff to view, students do not have access to this feature.
What does the Learning Analytics dashboard show me?
The data that is pulled from your Canvas module is presented in four main sections namely, ‘Module Grades’, ‘Weekly Online Activity’, ‘Students’ and ‘Reports’.
Module Grade:
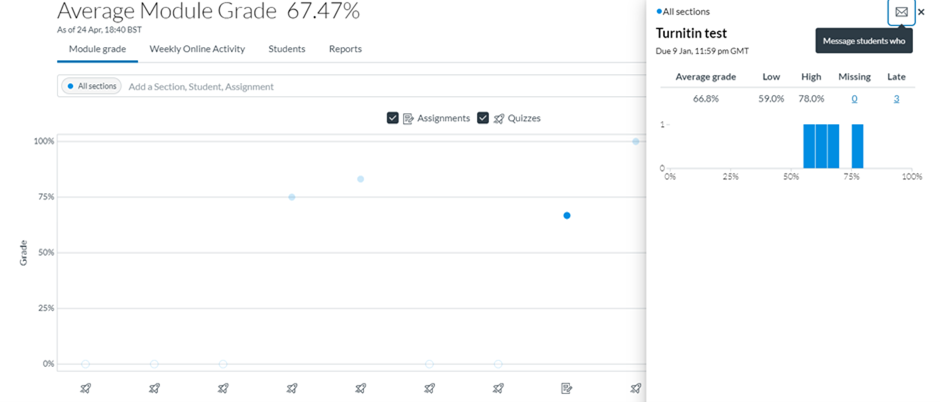
The information in the graph below shows overall marks for any assignments or quizzes that have a grade outcome. The dots in blue indicate assignments that have been graded and appear in order of due date. Clicking on each individual assignment will show an overview of average, lowest and highest grade and the number of missing and late submissions. You can filter the results based on sections, assignments or individual students. There is also the option to message groups of students dependent on specific criteria, for example, who received a 2:1.
It is important to note that Canvas doesn’t apply penalties (this happens in Sussex Direct), therefore the grades in this graph won’t be reflective of any marks deducted for lateness. Accessing this data can be incredibly useful to see how students’ grades are progressing across various assignments e.g., formative weekly quizzes or contributory submissions.
Weekly Online Activity
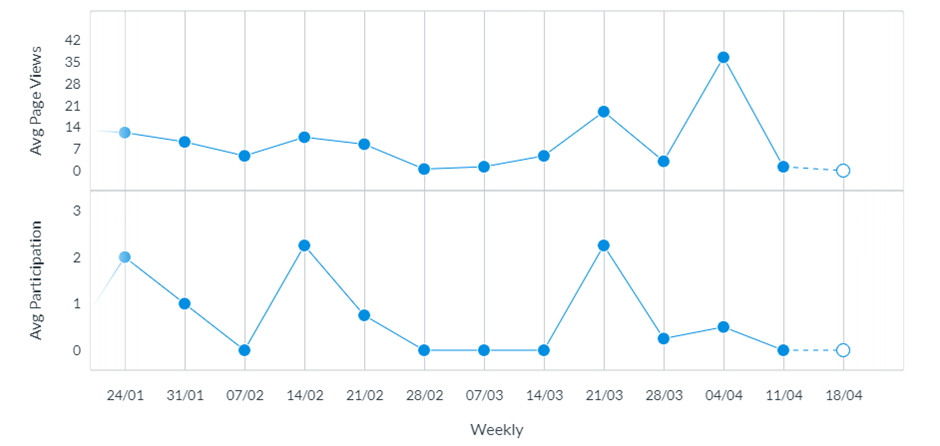
This data is displayed as a graph (or a table if preferred), that presents the average number of page views and average participation of module resources on a weekly basis (across all devices including the Canvas mobile app). Once again you can filter the data by sections or individual students. Additionally, there is the same option to message students en masse who viewed / didn’t view or participated / didn’t participate on any of the resources on the module. This feature is helpful to use as a reminder or check-in with specific students for a more personalised approach.
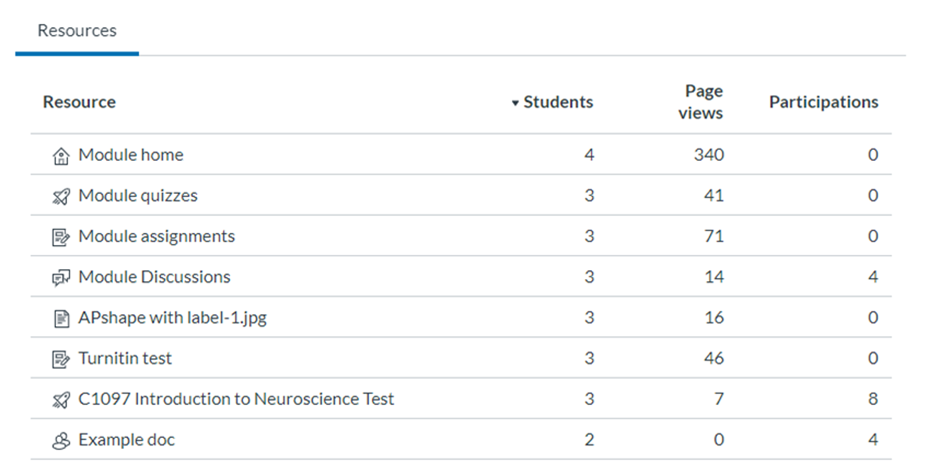
One of the most effective ways to use the analytics tool is assessing how students are engaging with your teaching resources. At the bottom of the ‘Weekly Online Activity’ tab, all your teaching materials (except Panopto recordings) are listed e.g., individual module pages, assessments, discussions and files. For each specific resource you can see how many students have viewed the content, the number of page views overall (e.g., repeat visits to a page) and the number of participations (on discussions, quizzes etc). The teaching materials are listed from the most engaged with to the least, which gives you a fantastic overview of which resources are the most popular amongst your students. There are limitations of course, the statistics can’t tell us more than whether a link has been clicked on, it won’t tell us if the student read the content fully or the amount of time users spent on each resource.
Students
The students tab provides an overview of individual student engagement data including overall grade, % of on-time assignments, date of last participation, date of last page view, overall number of page views and number of participations. This data can be used alongside attendance records etc. to track to what extent students are engaging and can be very useful to predict student outcomes.
Reports
The reports tab contains several queries you can run, including missing assignments, late assignments, excused assignments, class roster and module activity. From here you can download a csv of the overall raw data, but you can also download filtered data from any of the other tabs.
Panopto Recordings Analytics
Panopto is third party software that is integrated into Canvas, although it is not included within New Analytics, you can view analytics on any recordings you have created. To do so, simply click on the ‘Panopto Recordings’ tab on your Canvas module and click on the graph icon that will display folder statistics. This provides a summary of the overall views and downloads of all recordings within the subfolder, presented on a weekly basis. The statistics for the top five recordings are shown and this can be expanded to see all recordings based on popularity (number of views and downloads). You can also view statistics for an individual recording by opening a Panopto recording and clicking on ‘stats’ at the top right.
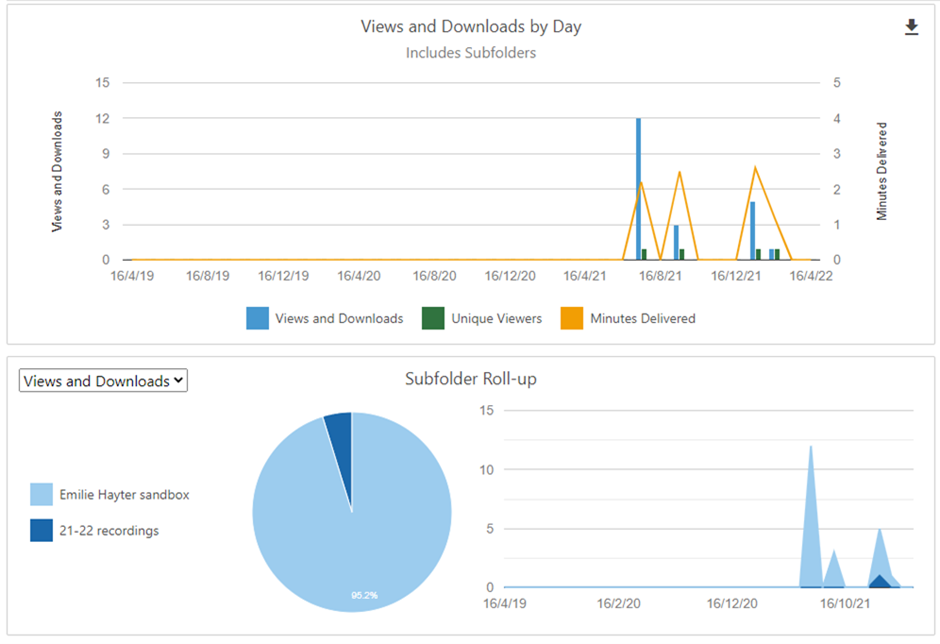
Unique viewers relate to the number of individual students who viewed the recording and the number of minutes they watched the video (to gauge their overall engagement). You can hover over an individual video for the detailed statistics, e.g., you can see when people are accessing a video over time and which parts of the video students are watching. Students generally start at the beginning but might skip through to relevant parts or taper off towards the end e.g. if they mean to come back to the recording at a later date. Students can search through videos using the captions for keywords or scrolling, therefore this analysis can help us understand what sections are perceived as most useful when targeting content for revision etc.
The Future of Learning Analytics
This blog provided an overview of learning analytics tools currently available at your disposal within Canvas and Panopto. Predictive modelling of student outcomes based on VLE data has been an emerging trend in learning analytics, along with the potential for personalised / adaptive learning through the integration of AI-powered tools. It is clear that as content becomes progressively more digital there will be an increase in the value of educational activity data to analyse learning.
Useful resources and further guidance
- What is New Analytics?
- What are Canvas Analytics?
- University of Edinburgh Learning Analytics
- Jisc – Learning analytics and student success
- Jisc – learning analytics in higher education
- Can you predict a degree from 5 weeks of VLE data?
- Jisc code of practice for analytics
- Canvas analytics instructor FAQ
- Panopto user statistics
If you would like to discuss the use of Learning Analytics in your teaching, please contact tel@sussex.ac.uk
