

In February we told you about some great updates and new features coming to Canvas. As one of these, the enhanced Rich Content Editor (RCE) will soon replace the existing RCE which is used in creating nearly all content in Canvas it seemed a good idea to re-publish this post. Both of the features mentioned below are available for staff to try now and the Rich Content Editor will replace the existing RCE on 20th June 2020.
Rich Content Editor enhancements
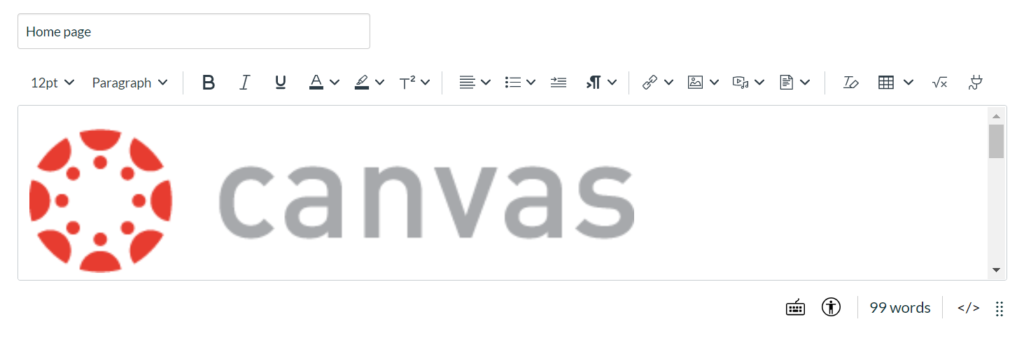
The Rich Content Editor (RCE) is the screen that appears when editing most types of content in Canvas. The updated RCE includes a condensed, more intuitive toolbar and the ability to resize the editing field. When you are editing, the RCE will expand to the full width of the screen, but if your screen is not wide enough to show all the icons you will find the others under the 3 vertical dots menu at the end of the toolbar.
The new RCE moves the Accessibility Checker and HTML edit option to underneath the editing window and adds a word count, keyboard shortcuts and the ability to resize the editing window.

Linking to other content
The options to insert links to files, images or other parts of the module which used to be in separate tabs on the right of the screen when editing are now integrated into the RCE toolbar. Options are grouped together under recognisable icons such as these which indicate links, images, media and documents.

When you choose to link to content that is already in the module site, a sidebar will appear allowing you to choose what you want to link to. The list will show which items are published, so it is easier to find the right thing.

Embedding images
Images can be added via the image menu where you can choose images already in the module or your own Canvas files. If you want to add a new image you can drag and drop a file from your computer, browse your computer, choose an image from Unsplash or add an image with a URL. Unsplash has replaced Flickr as the platform for finding images within Canvas and gives you over 1 million free-to-use images to choose from.

When your image has appeared, you can click on it to see an Options button. This will allow you to edit the alternative text (a text description for students with visual impairments using screen readers and others unable to view images directly), choose whether to embed the image or link to it and choose from some standard sizes or set a custom size. You can also adjust the size by dragging the blue squares in the corners of the image.

Direct share
It is now possible to share content between modules and with colleagues, without using Commons. On Pages, Assignments, Discussions and Quizzes, you will see additional options to ‘send to’ or ‘copy to’ when opening the 3 vertical dots menu.

‘Send to’ allows you to add the emails of Sussex colleagues with whom you wish to share the item. Any shared item you have received will appear under Shared Content in your account, from where you can preview it and/or import it into one or more of your modules. ‘Copy to’ allows you to copy an item from one of your modules to another.
Some possible uses for his functionality would be sharing a mid-term student feedback survey with colleagues or copying a Page with your contact details and office hours to all your modules.
How can I start using these features?
Direct Share is already enabled on all Sussex modules, and you can enable the RCE Enhancements on your module via Settings and Feature Options. This is a per-module setting so if it is enabled, all editors on the site will see the new RCE.
You can read more about enhancements to the RCE and Direct Share in the Canvas Guides. If you would like any help using any of these new features please contact tel@sussex.ac.uk. You can learn more about making your Canvas sites and digital resources accessible in our Digital Accessibility Toolkit.